Downloaded 17 times


![Analytics: Top 5 Docker images by CPU
topk(5,
sum by (image)(
rate(container_cpu_usage_seconds_total{
id=~"/system.slice/docker.*"}[5m]
)
)
)](https://image.slidesharecdn.com/prometheusformonitoringmetricsperconaliveeurope2017-170926170709/75/Prometheus-for-Monitoring-Metrics-Percona-Live-Europe-2017-11-2048.jpg)


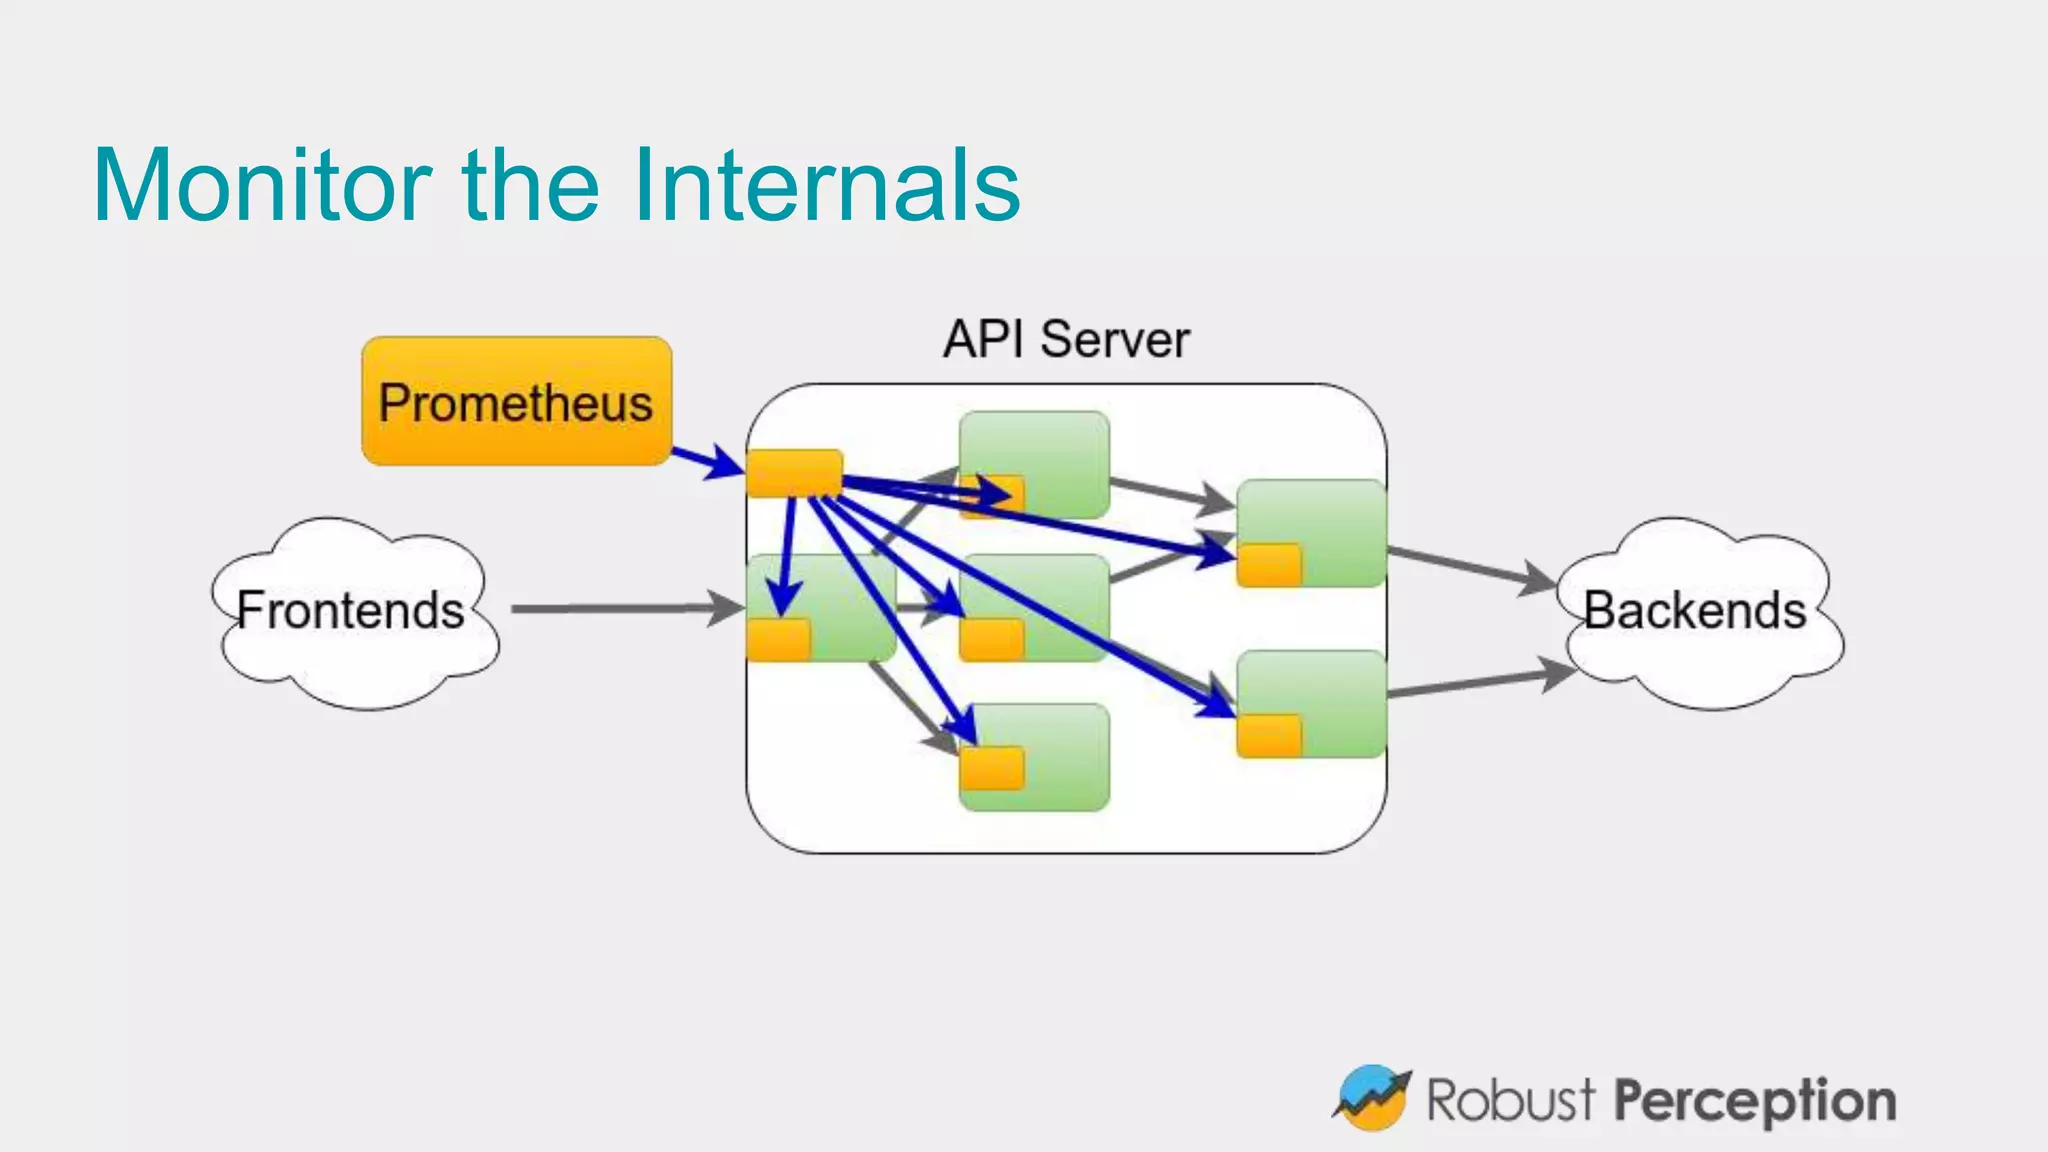
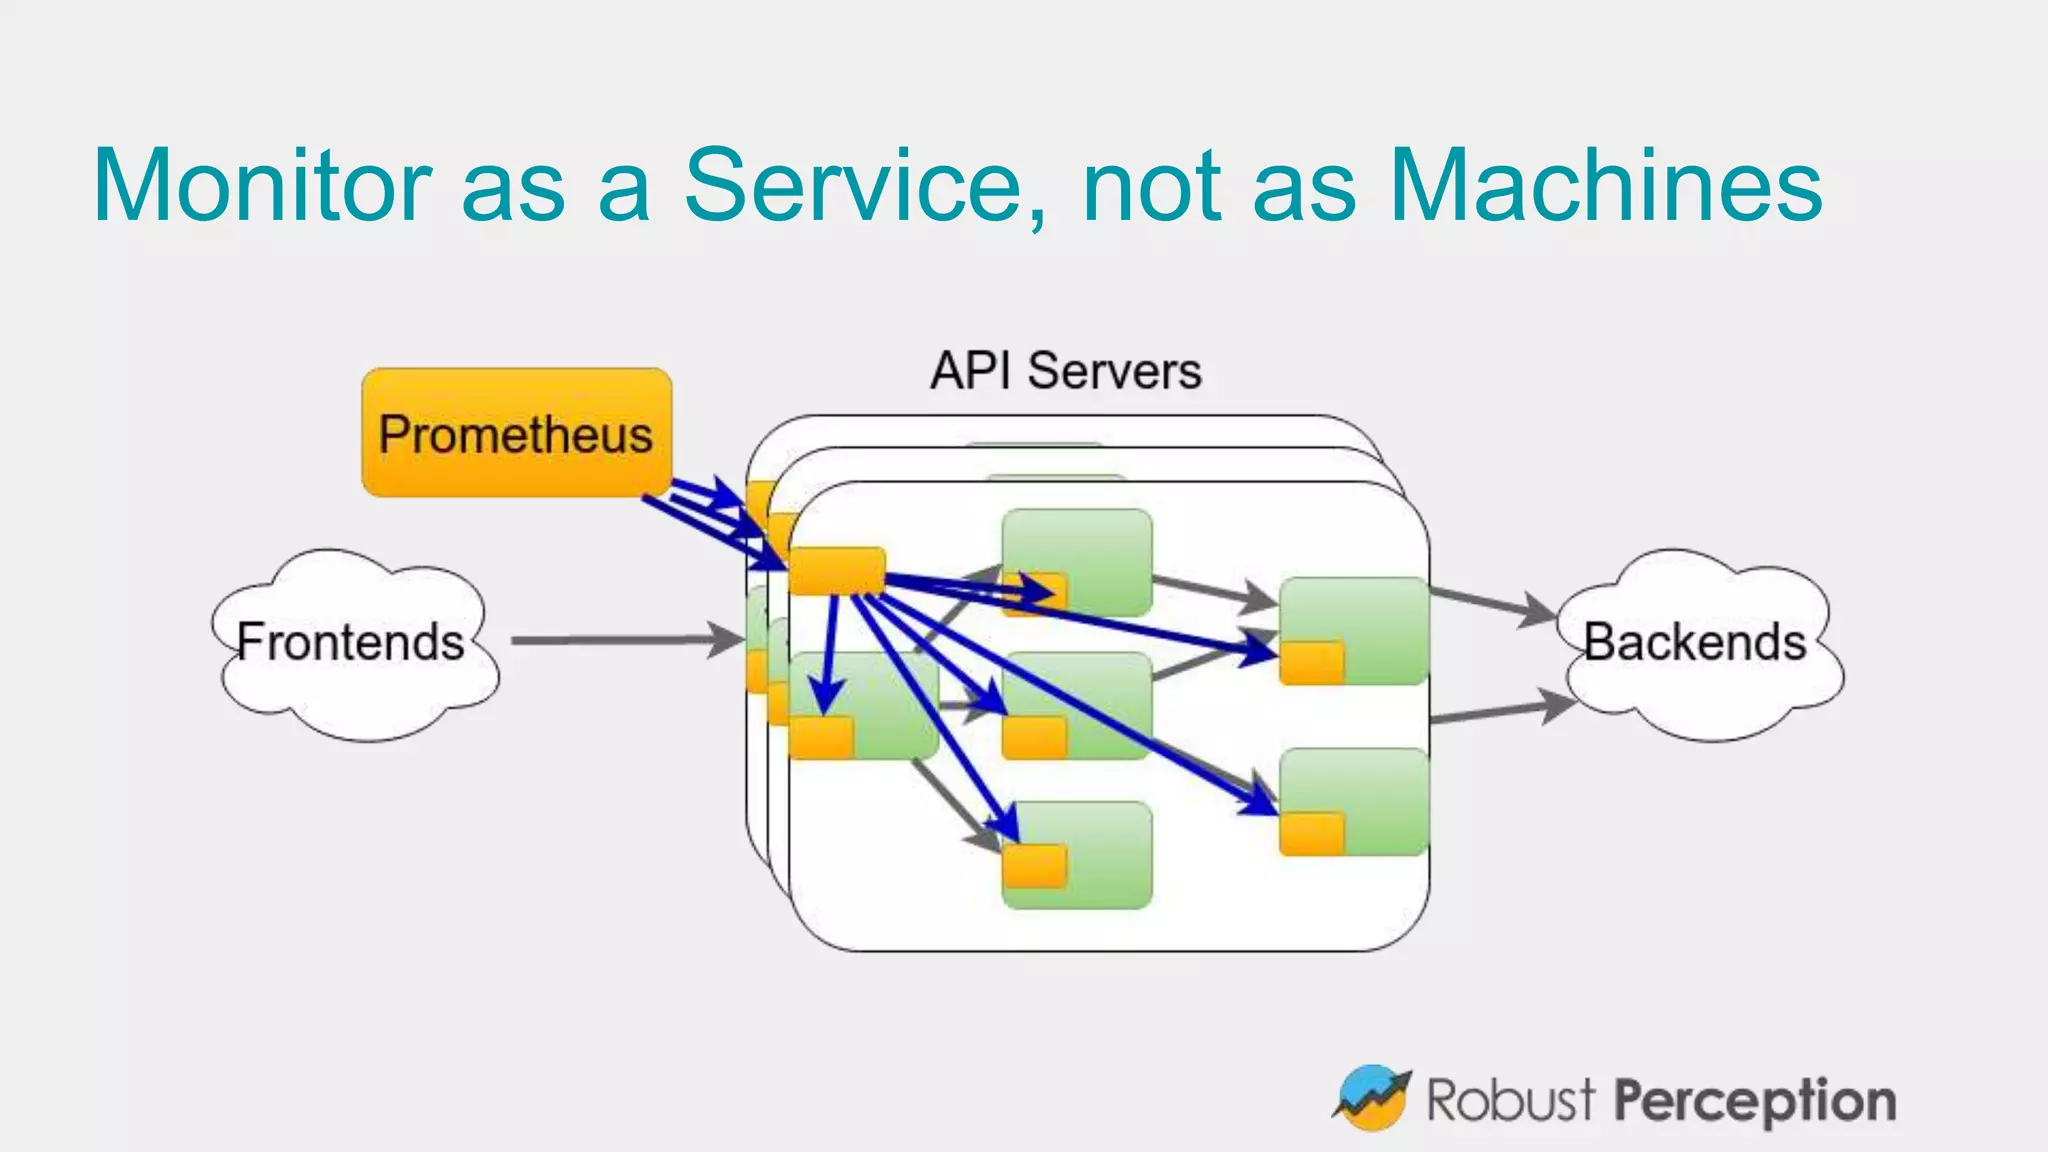
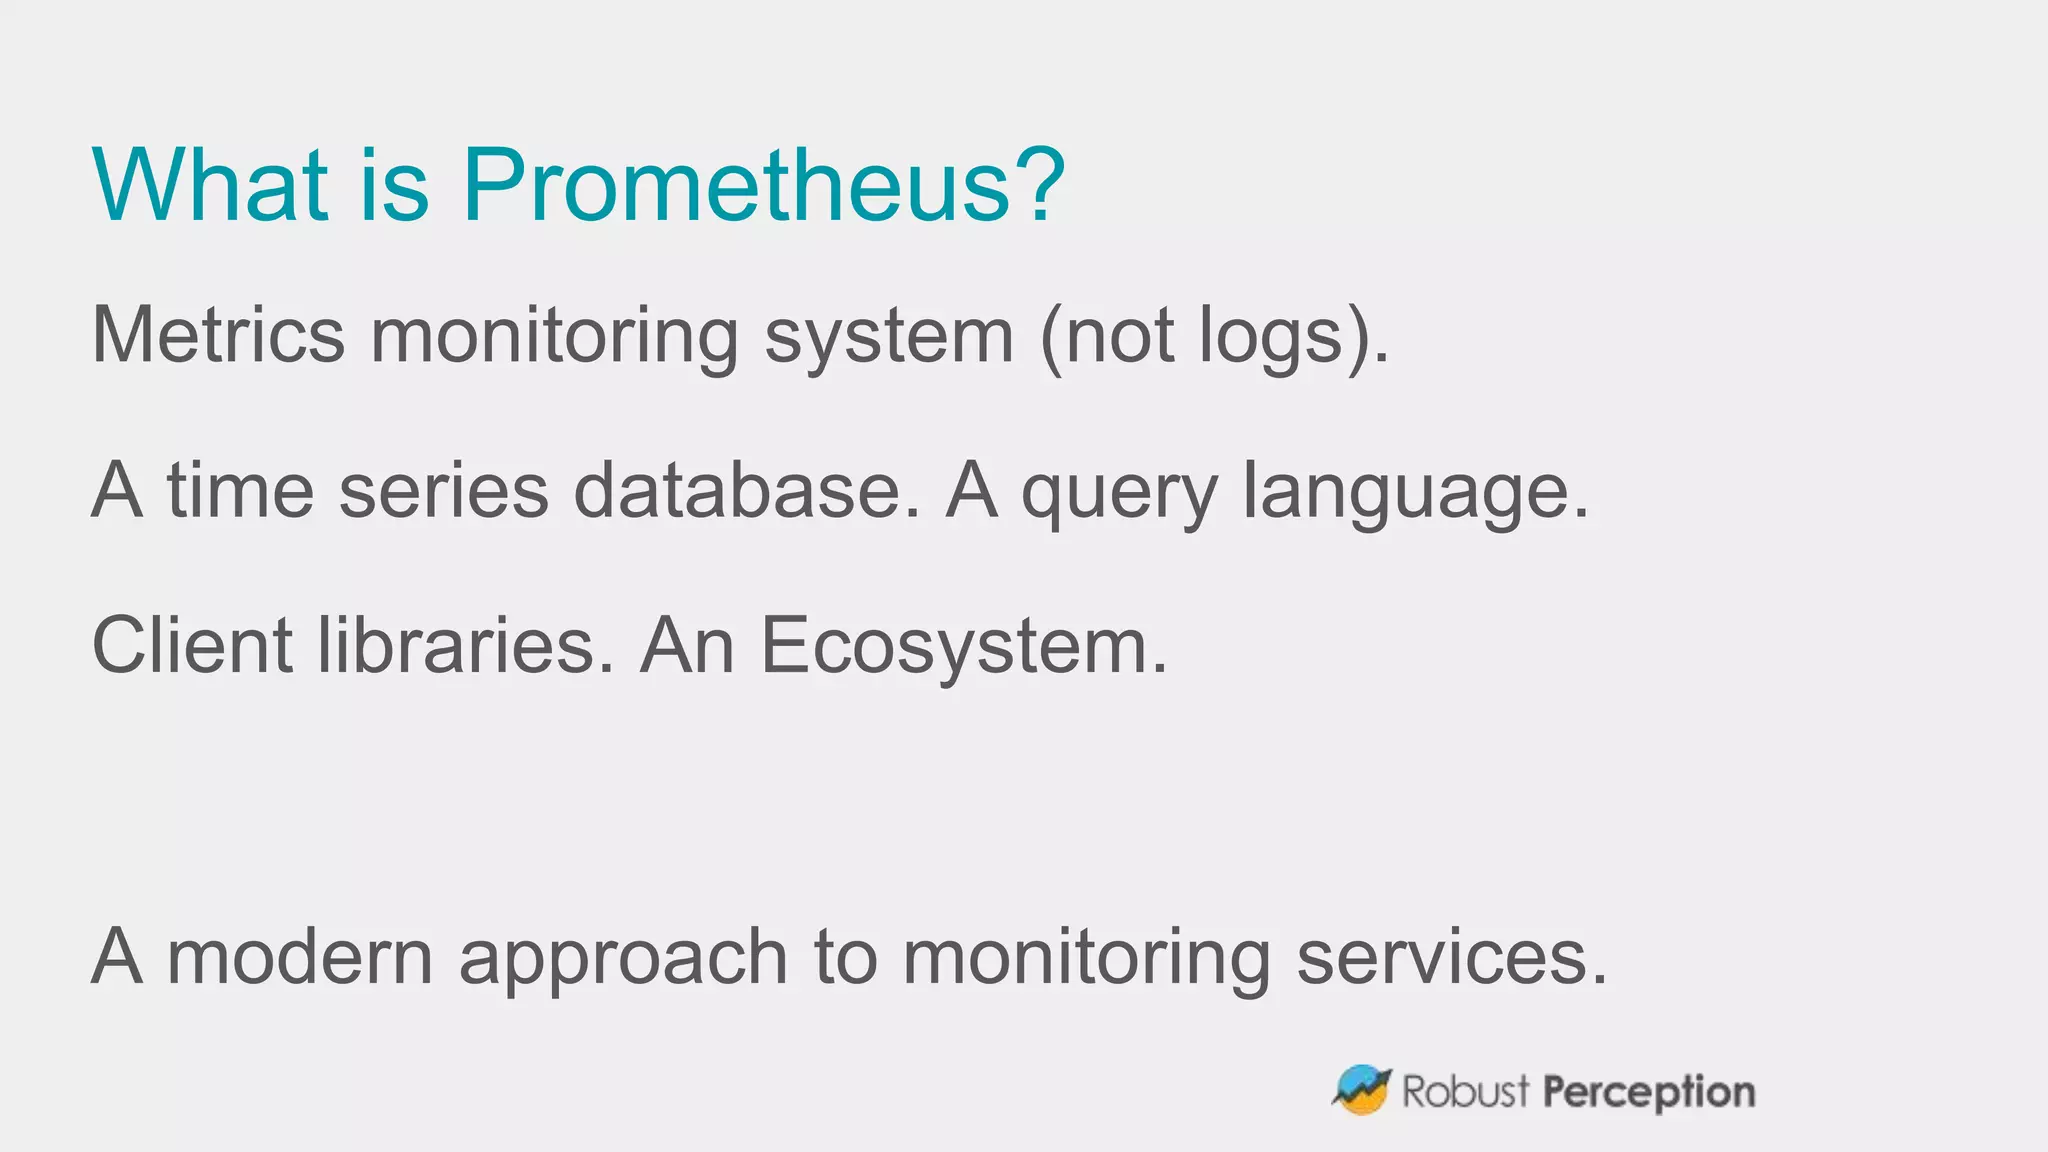
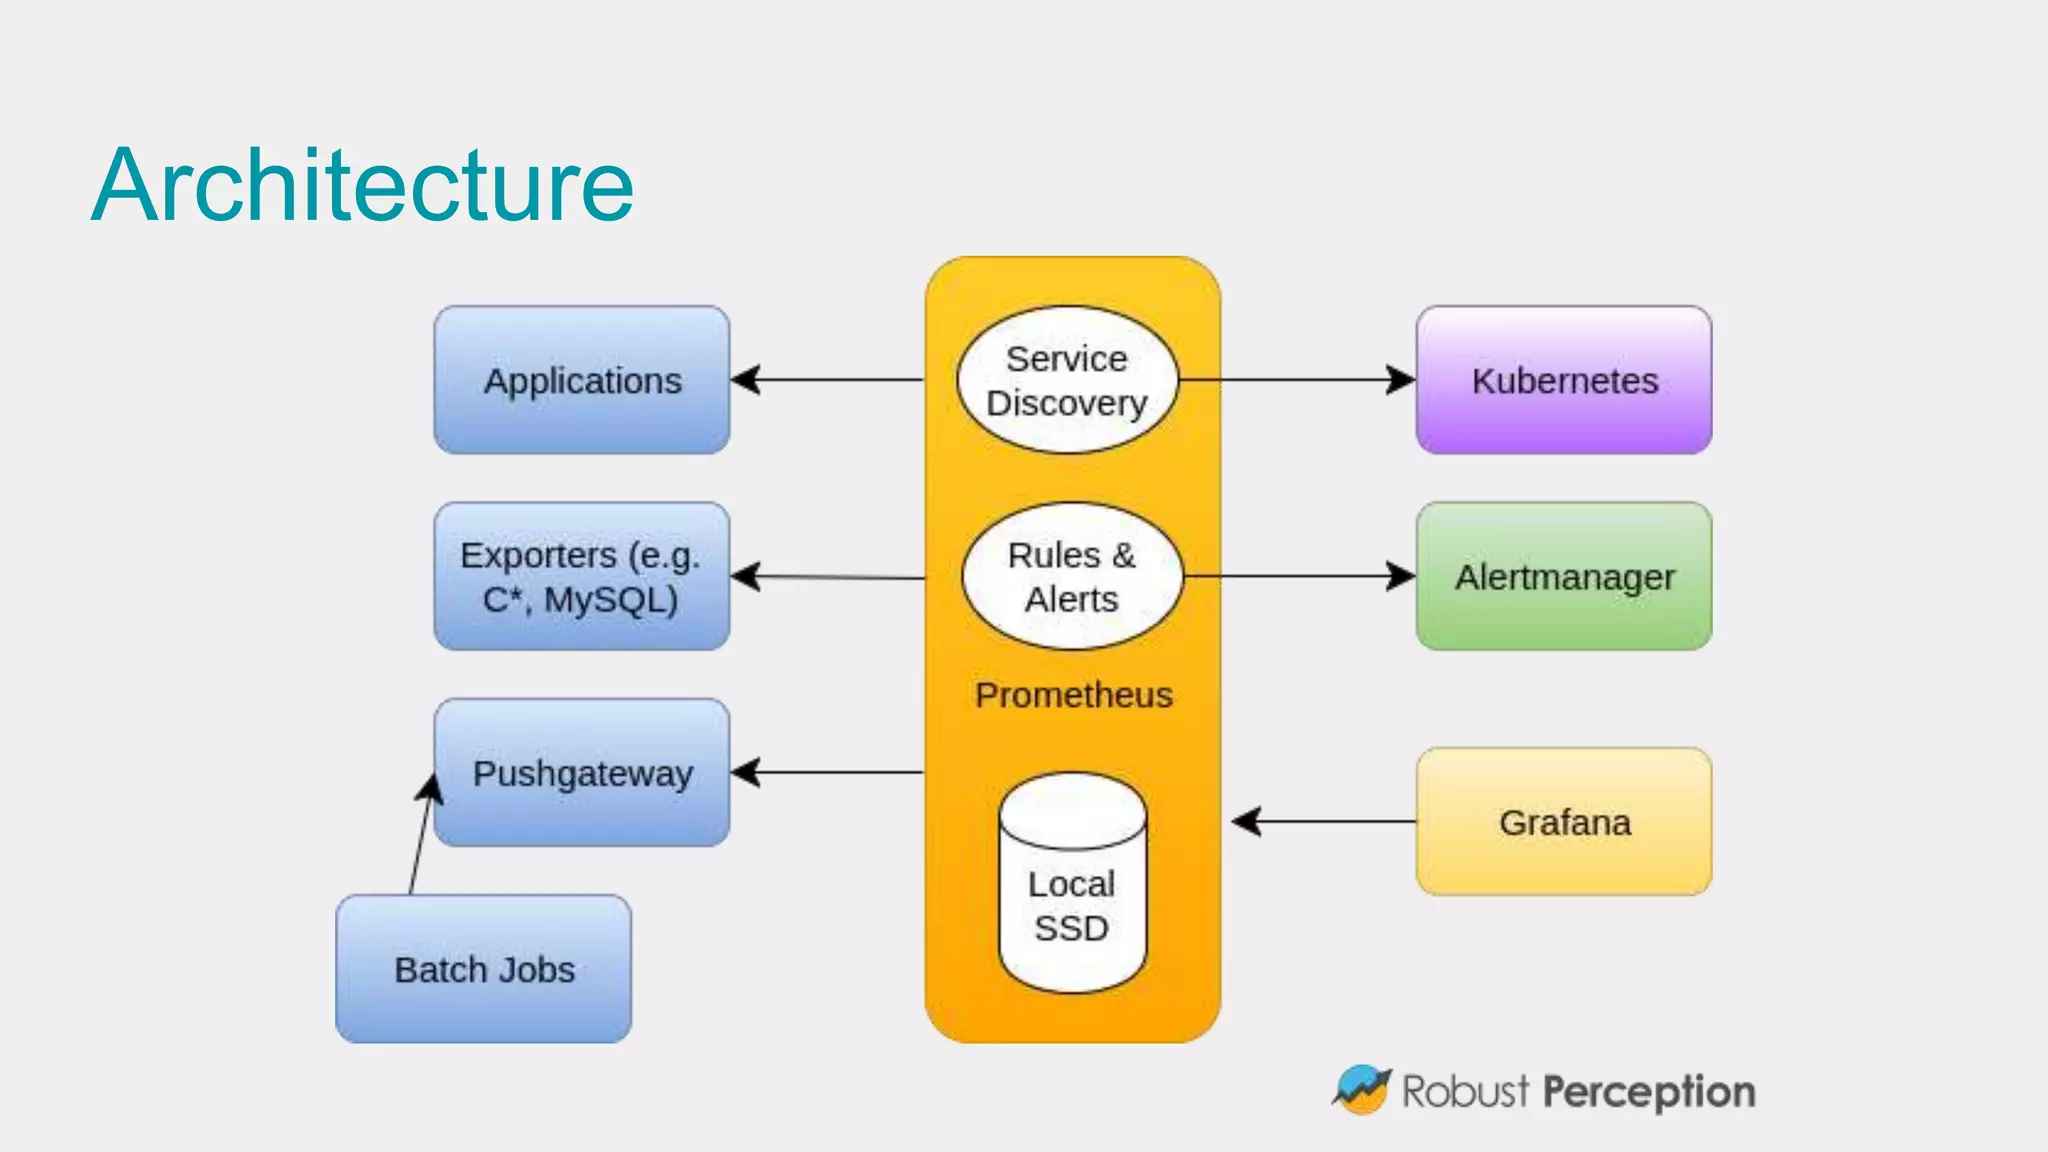
Brian Brazil is the founder of Prometheus and a core developer who emphasizes the importance of monitoring for preventing business issues and gaining insights. Prometheus is a modern metrics monitoring system, featuring a time series database, query language, and a rich ecosystem of client libraries and exporters. The tool is widely adopted by companies like Cloudflare and Google, with a vibrant community and extensive resources available for users and developers.