Download as PDF, PPTX
![Adding Dimensions (No Evil Twins Please)
from prometheus_client import Counter
REQUESTS = Counter('requests_total',
'Total requests', ['method'])
def my_handler(request):
REQUESTS.labels(request.method).inc()
pass // Your code here](https://image.slidesharecdn.com/yourdataisinprometheusnowwhat-160420082540/75/Your-data-is-in-Prometheus-now-what-CurrencyFair-Engineering-Meetup-2016-18-2048.jpg)
![Example: Top 5 Docker images by CPU
topk(5,
sum by (image)(
rate(container_cpu_usage_seconds_total{
id=~"/system.slice/docker.*"}[5m]
)
)
)](https://image.slidesharecdn.com/yourdataisinprometheusnowwhat-160420082540/75/Your-data-is-in-Prometheus-now-what-CurrencyFair-Engineering-Meetup-2016-24-2048.jpg)

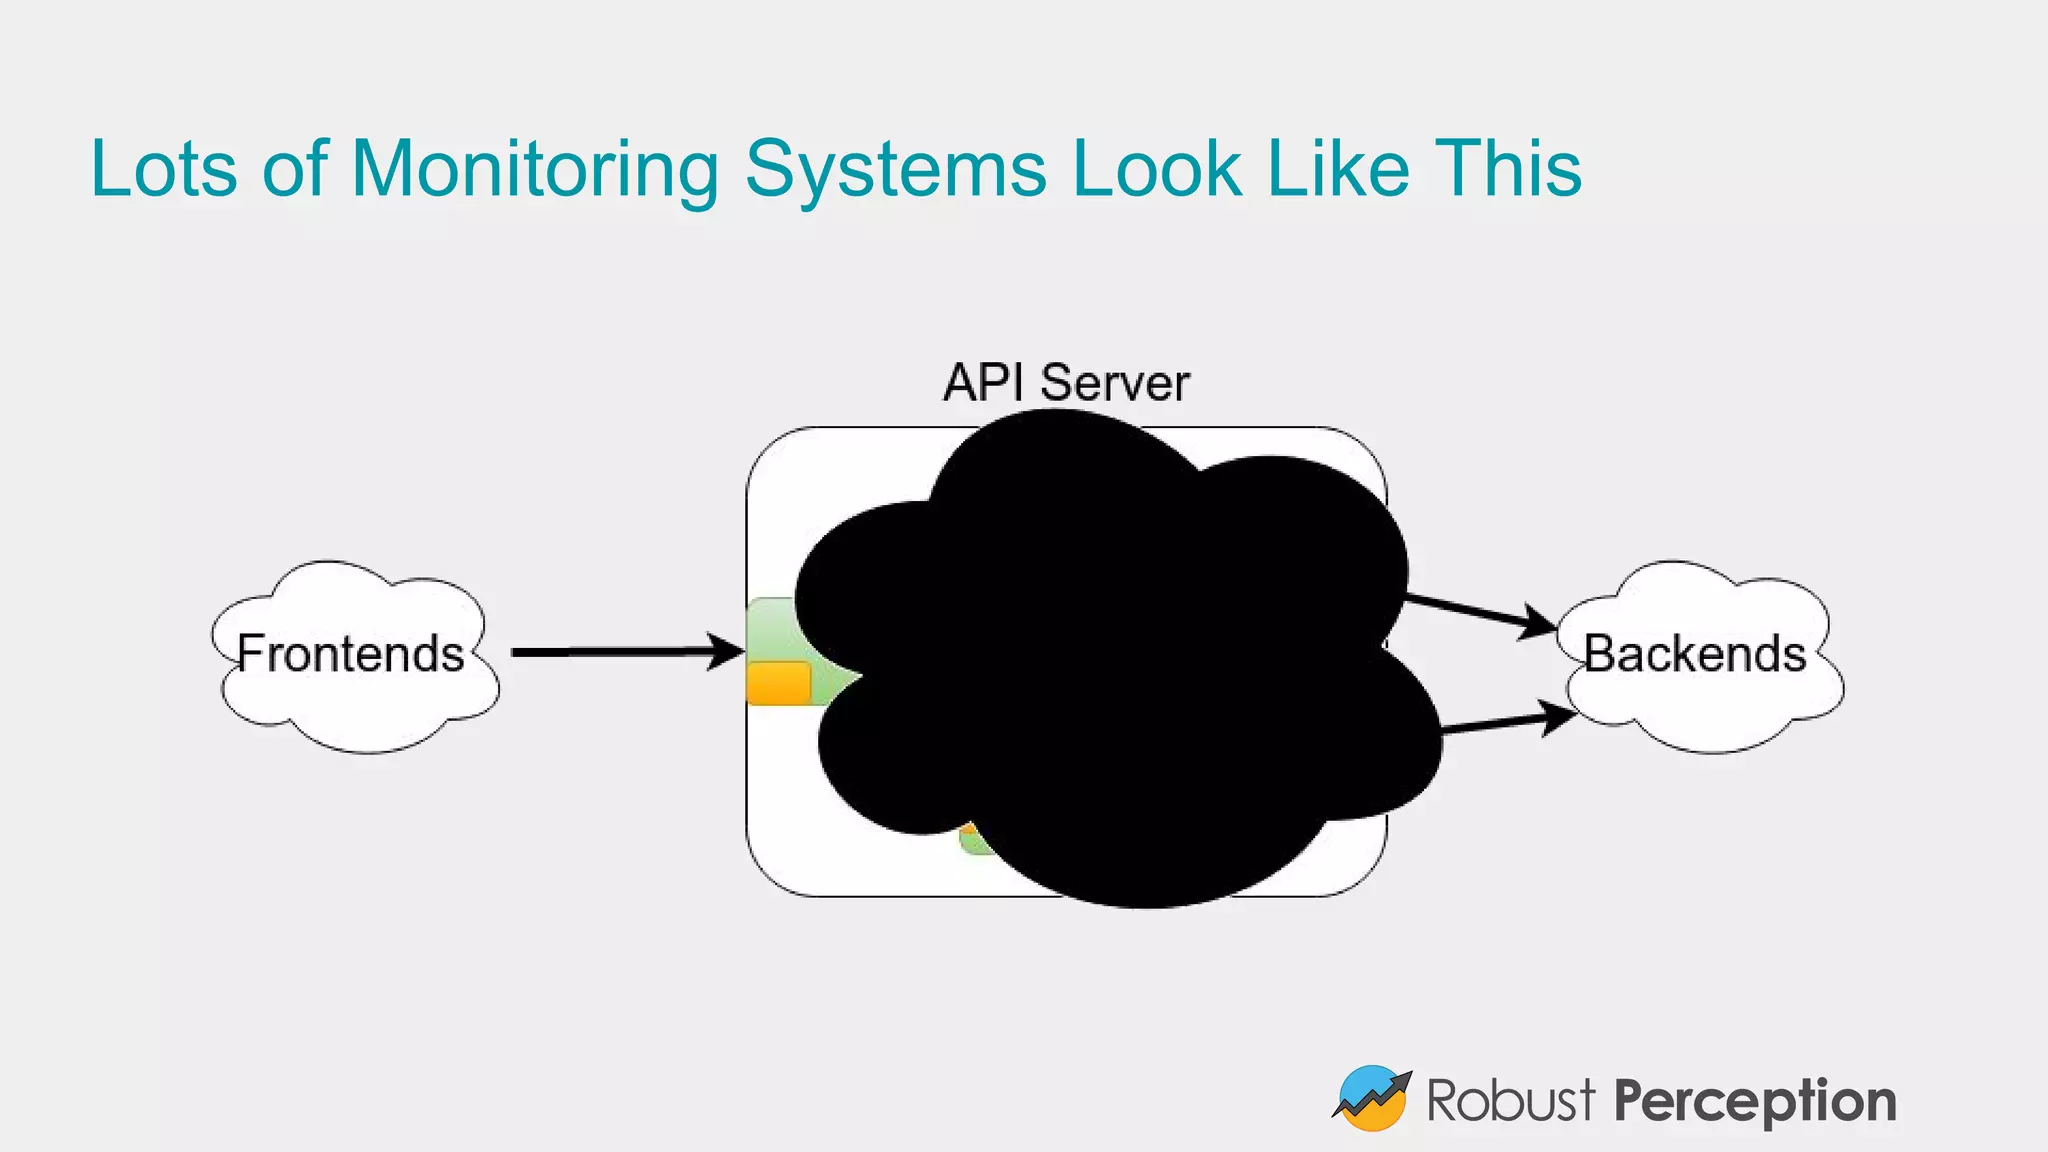
Brian Brazil, founder of Robust Perception, discusses the importance and functionality of Prometheus, a time series database designed for monitoring systems. He emphasizes the significance of tracking time series data to prevent issues, gain insights, and facilitate business decisions. The document also covers best practices for effective monitoring, the architecture of Prometheus, and how to leverage it for efficient system performance.