Download as PDF, PPTX

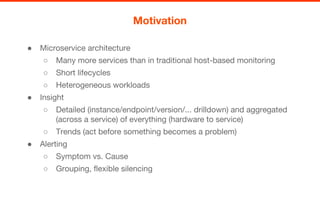
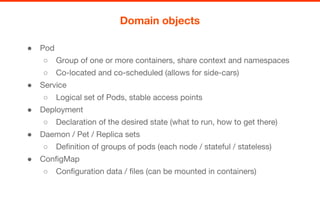
![# HELP etcd_store_writes_total Total number of writes seen …
# TYPE etcd_store_writes_total counter
etcd_store_writes_total{action="compareAndDelete"} 2
etcd_store_writes_total{action="compareAndSwap"} 4016
etcd_store_writes_total{action="create"} 218
etcd_store_writes_total{action="set"} 5
count by(job)(up == 0) / count by(job)(up)
rate(etcd_store_writes_total{action="set"}[1m]))
sum without(action)(rate(etcd_store_writes_total[1m]))
Examples](https://image.slidesharecdn.com/containerdaysnyc-monitoringkuberneteswithprometheus-161124043612/85/Monitoring-Kubernetes-with-Prometheus-6-320.jpg)
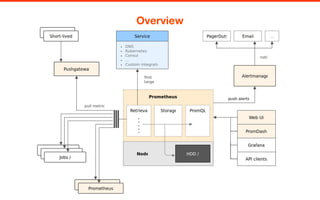
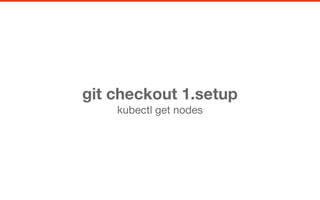
![scrape_configs:
- job_name: etcd
static_configs:
- targets: ["172.17.4.51:2379"]
- job_name: kube-components
kubernetes_sd_configs:
- role: endpoints
relabel_configs:
- # Custom filtering and label mapping
Configuration](https://image.slidesharecdn.com/containerdaysnyc-monitoringkuberneteswithprometheus-161124043612/85/Monitoring-Kubernetes-with-Prometheus-8-320.jpg)
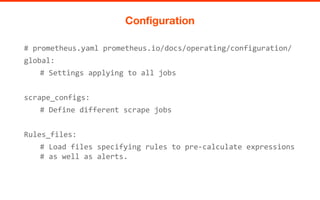
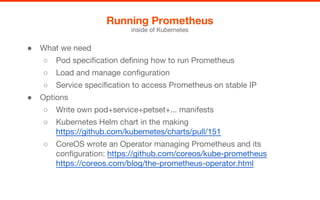
![# continued
relabel_configs:
- action: keep
source_labels: [__meta_kubernetes_service_name]
regex: "kube-(.*)-prometheus-discovery"
- action: keep
source_labels: [__meta_kubernetes_endpoint_port_name]
regex: "prometheus"
- action: replace
source_labels: [__meta_kubernetes_service_name]
target_label: job
regex: "(kube-.*)-prometheus-discovery"
Configuration](https://image.slidesharecdn.com/containerdaysnyc-monitoringkuberneteswithprometheus-161124043612/85/Monitoring-Kubernetes-with-Prometheus-9-320.jpg)


The document discusses monitoring Kubernetes using Prometheus, focusing on the benefits of detailed insights and alerting mechanisms. It outlines the architecture of microservices within Kubernetes, including configurations for deployments and scraping metrics. Additionally, it covers the installation process and practical examples for monitoring services and infrastructure with Prometheus and Grafana.