Download to read offline
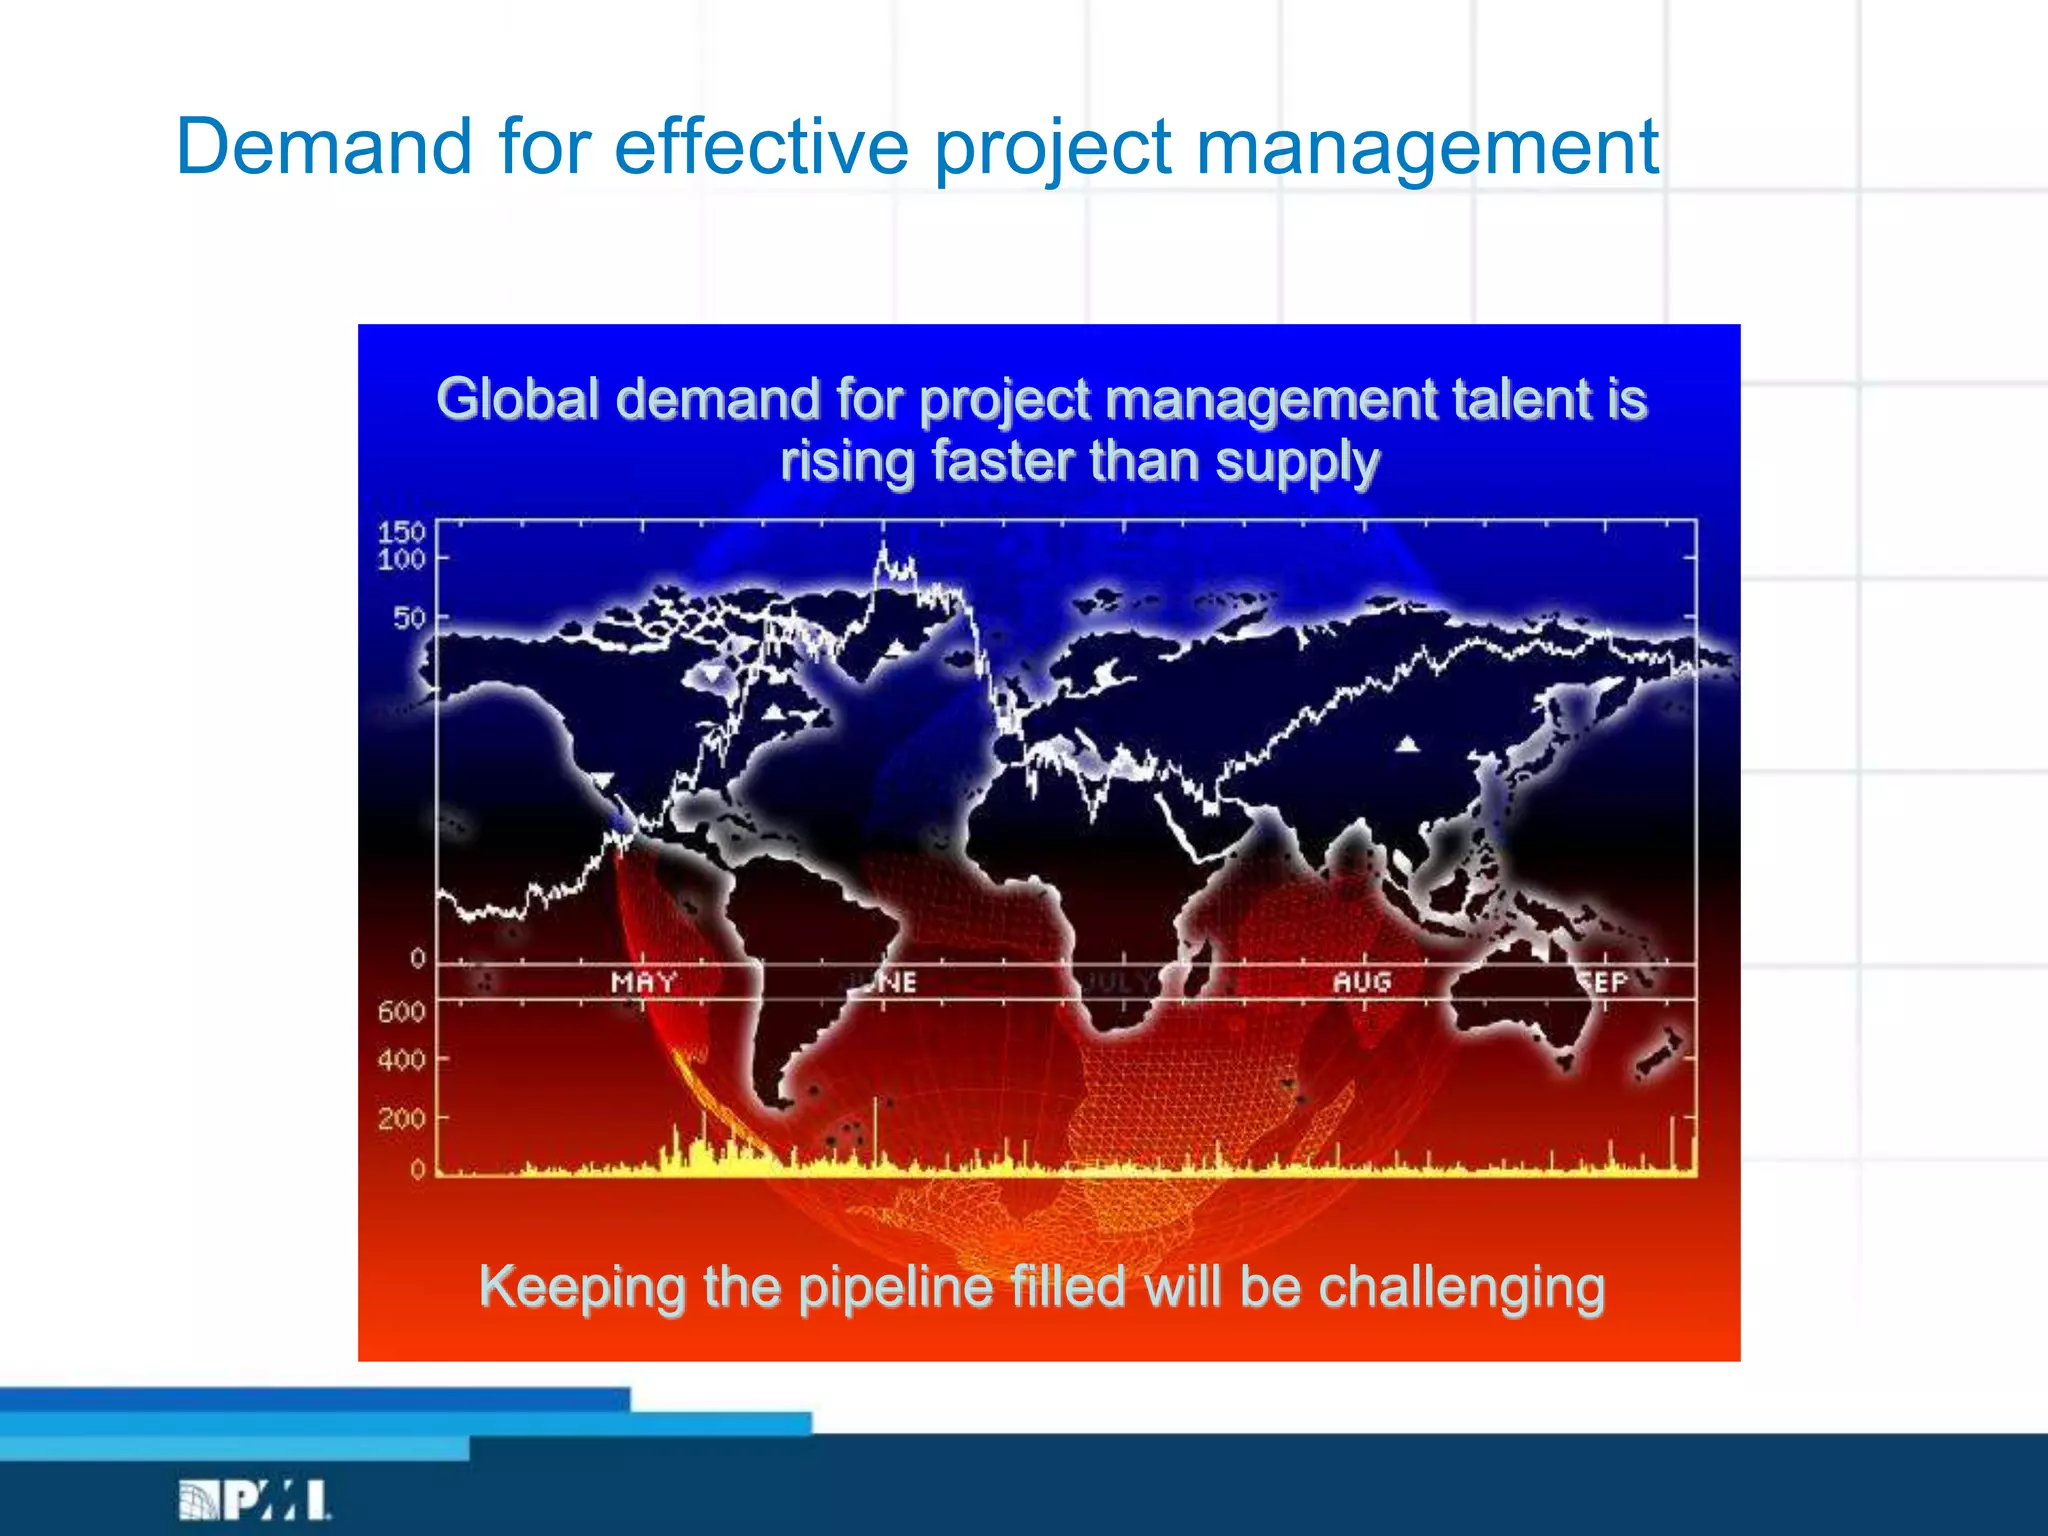
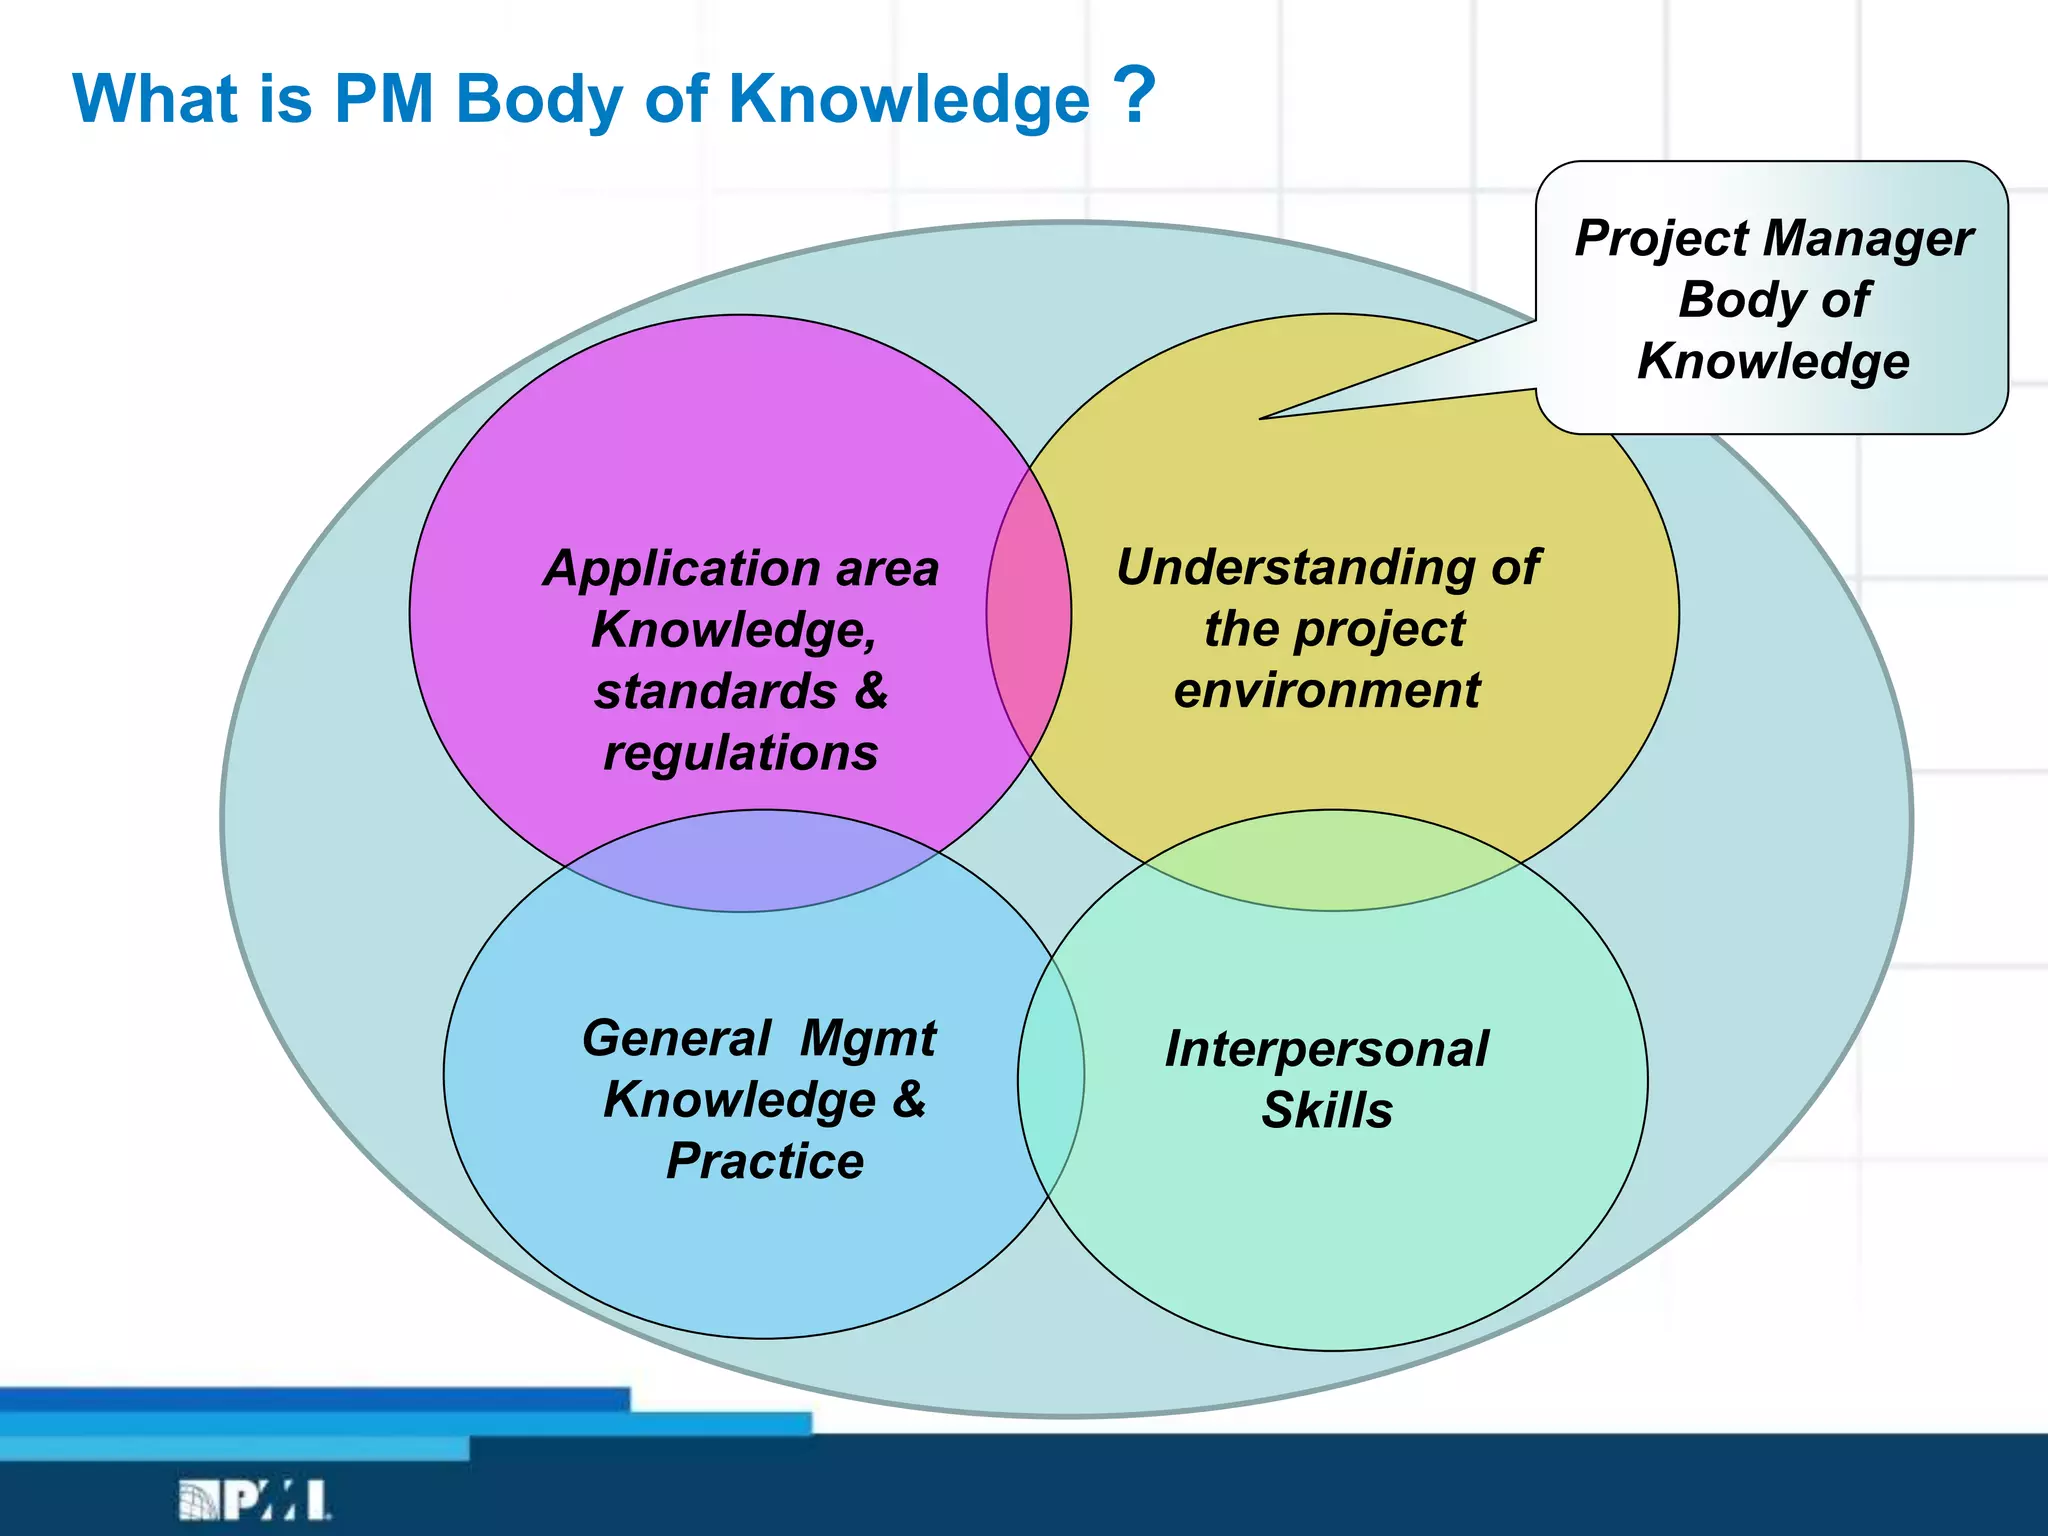
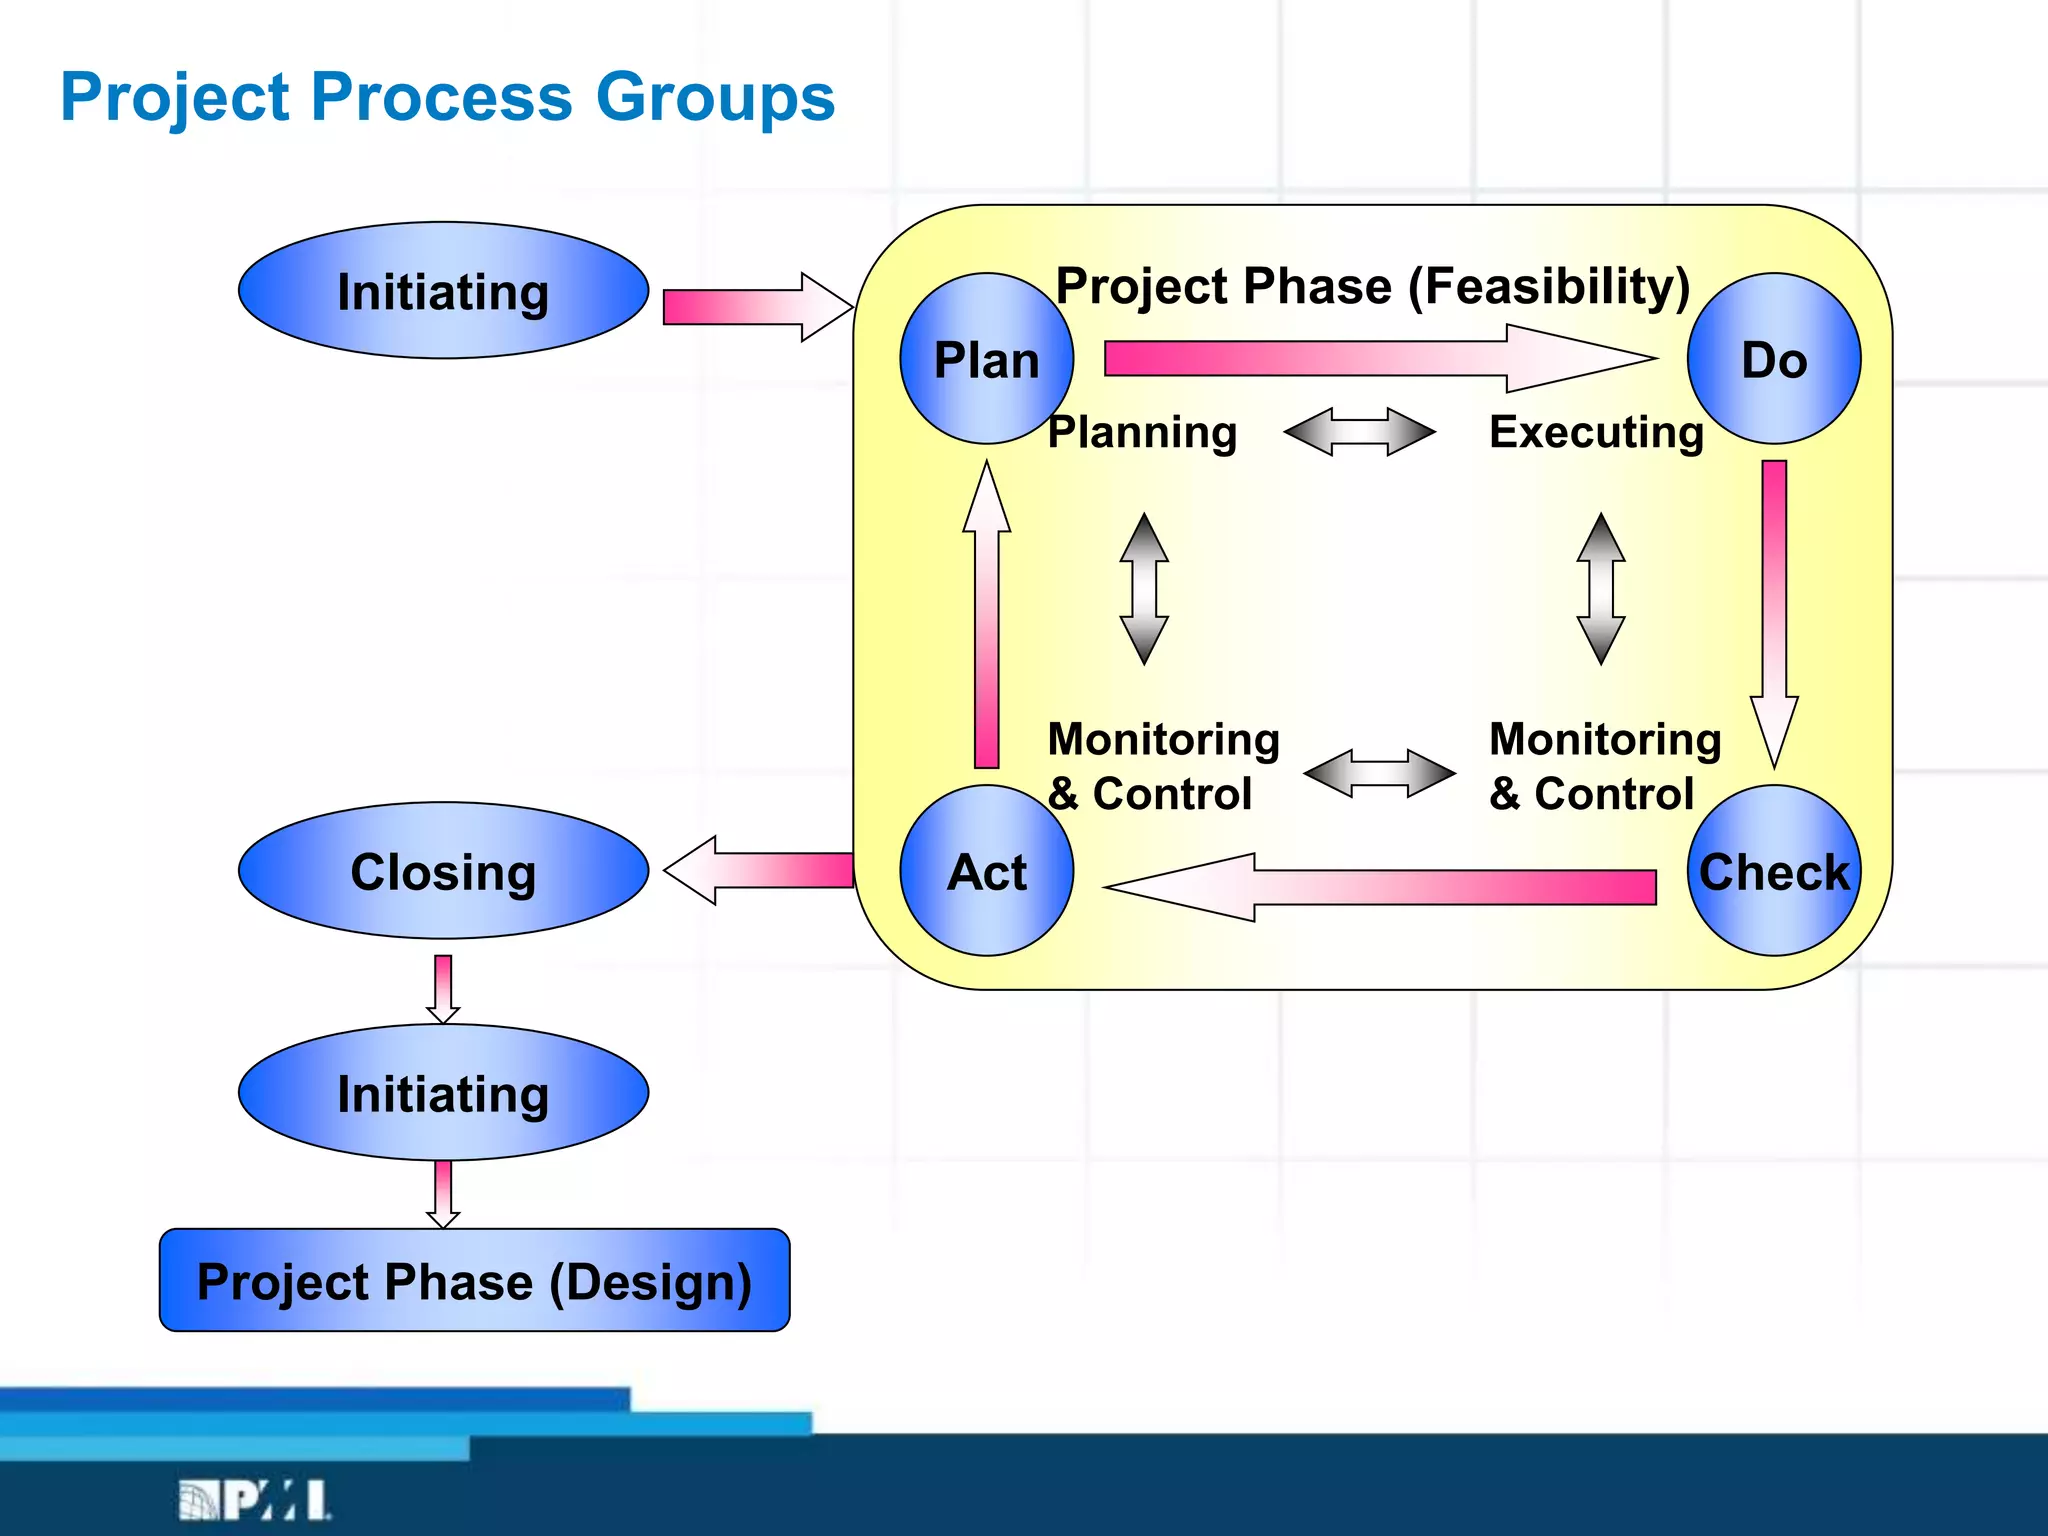
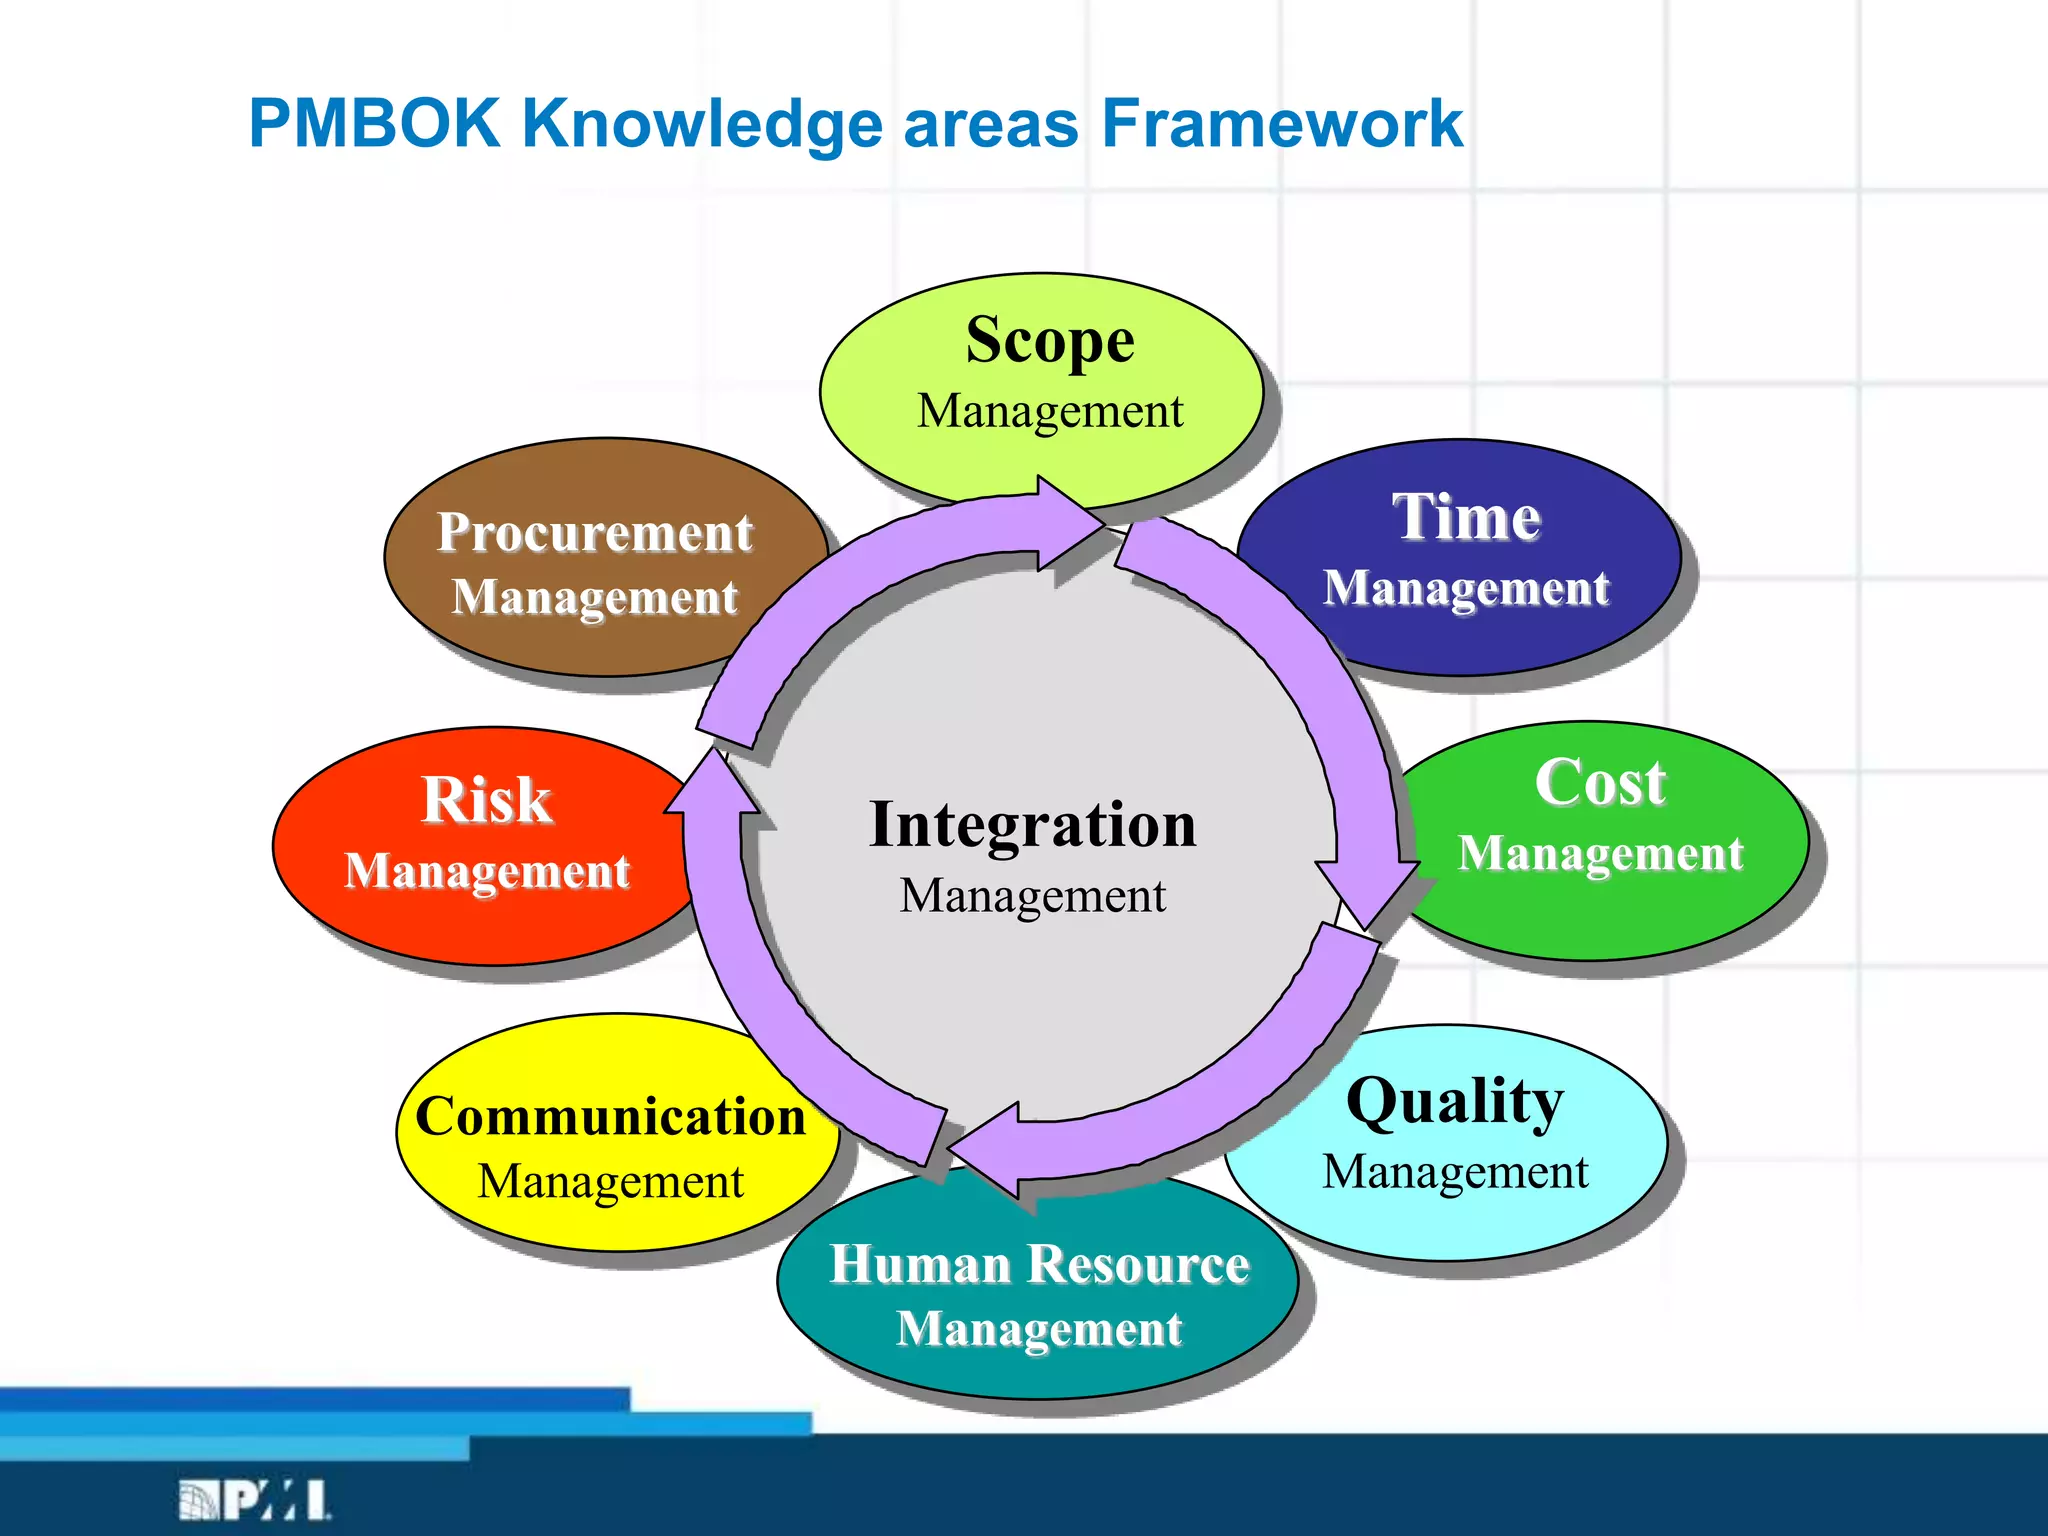
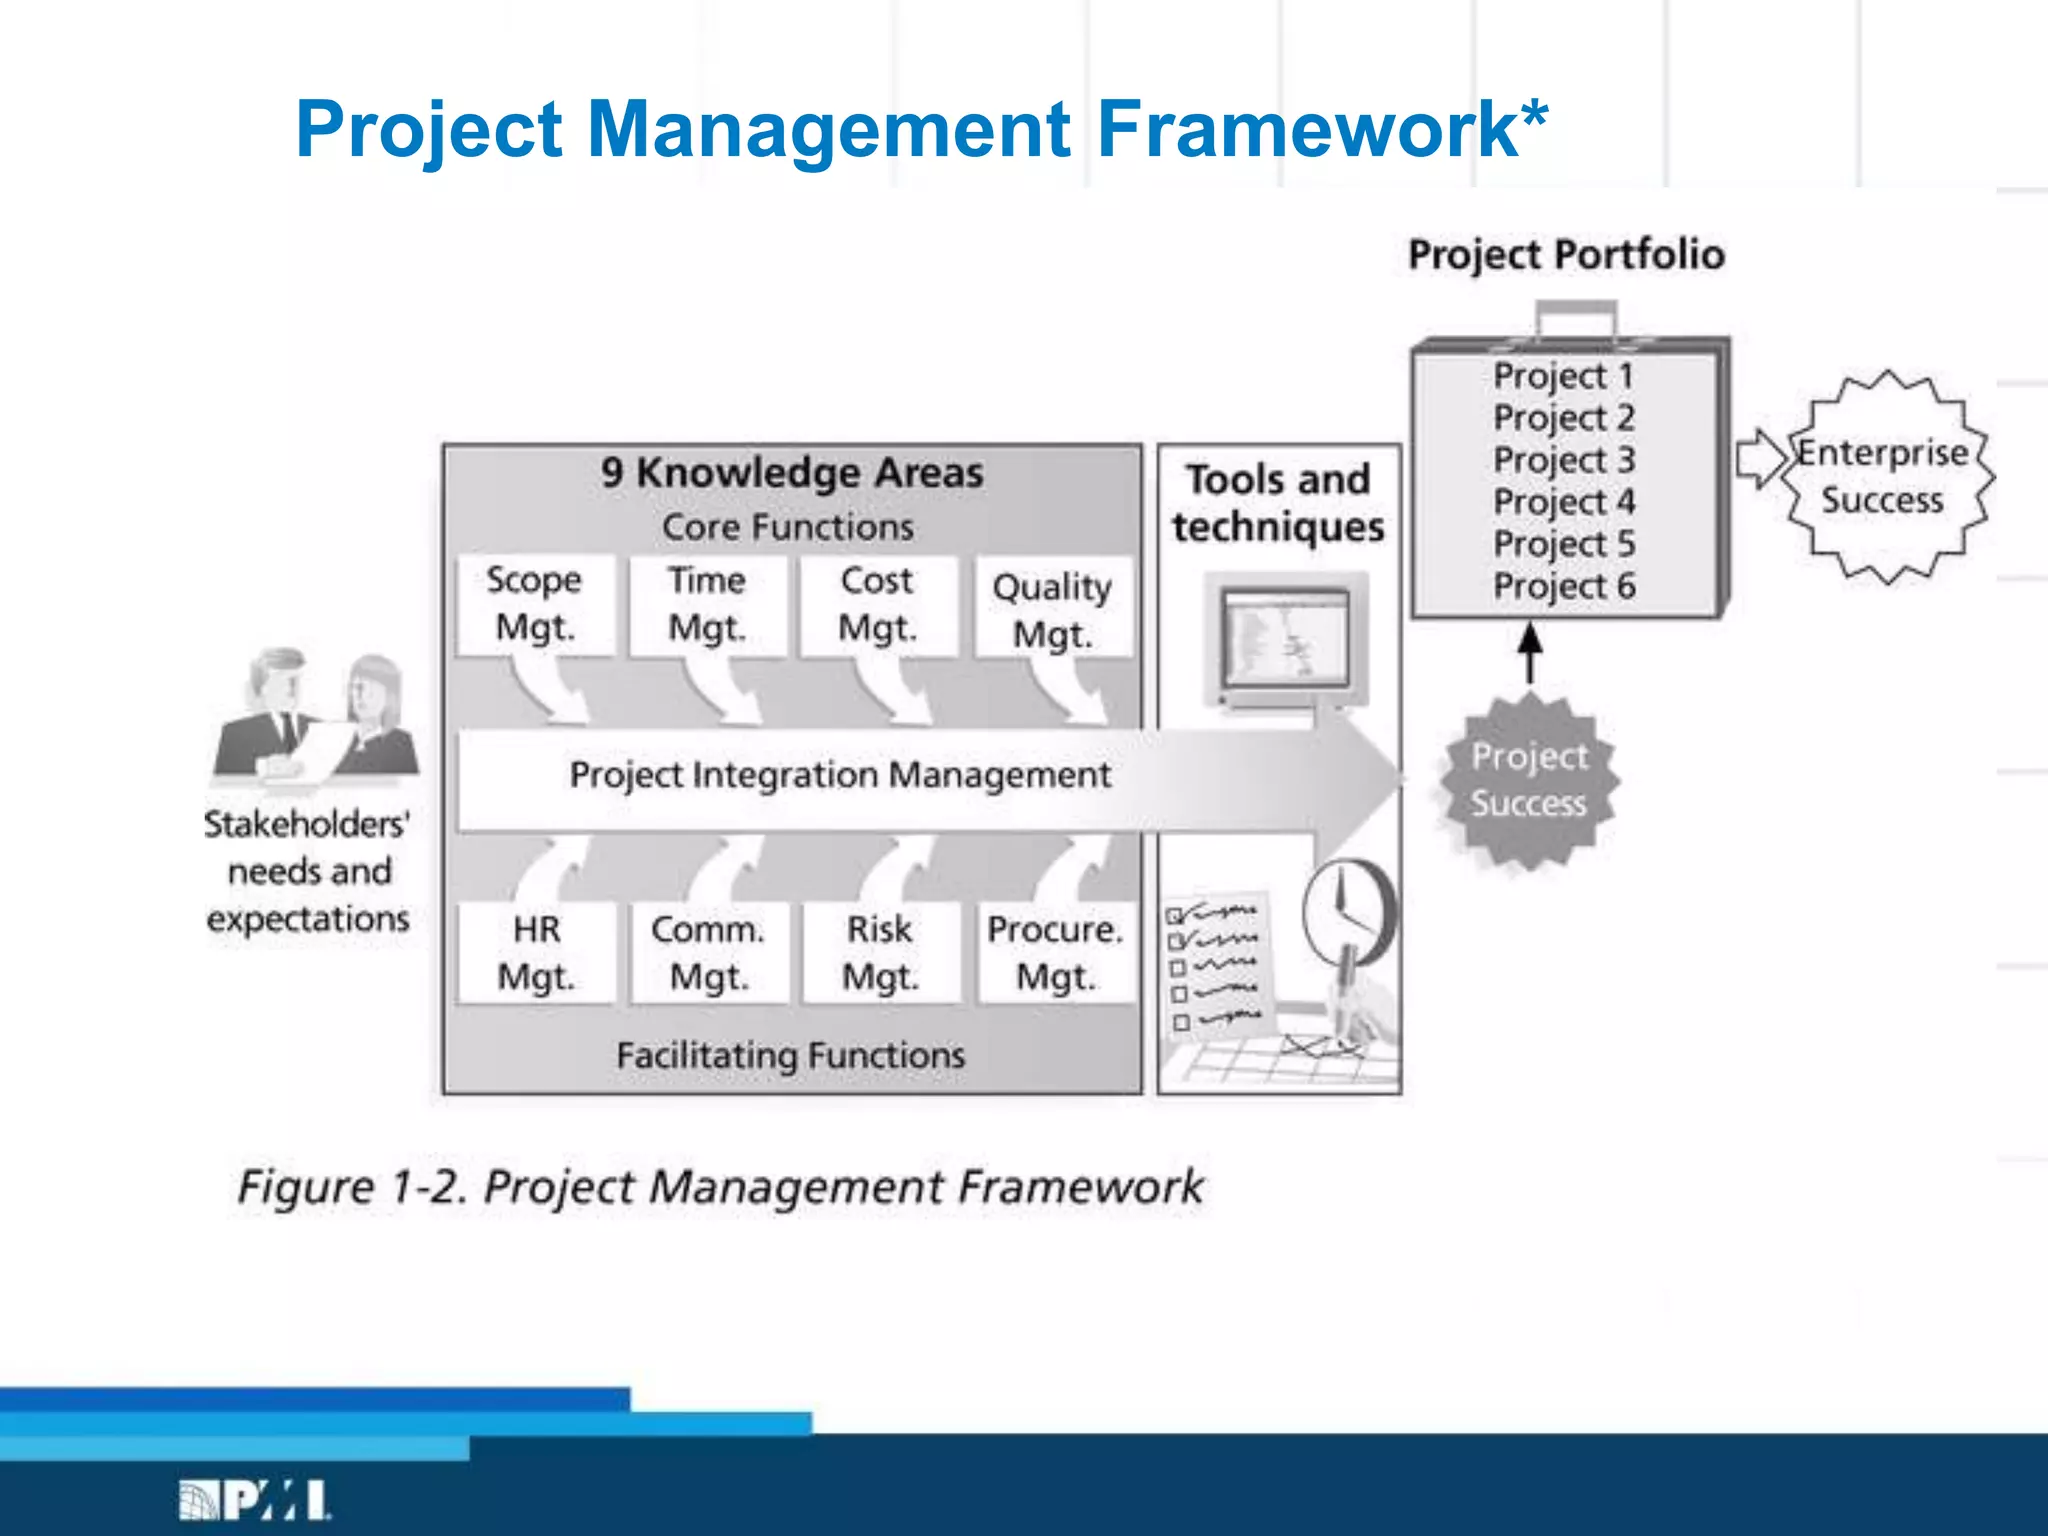
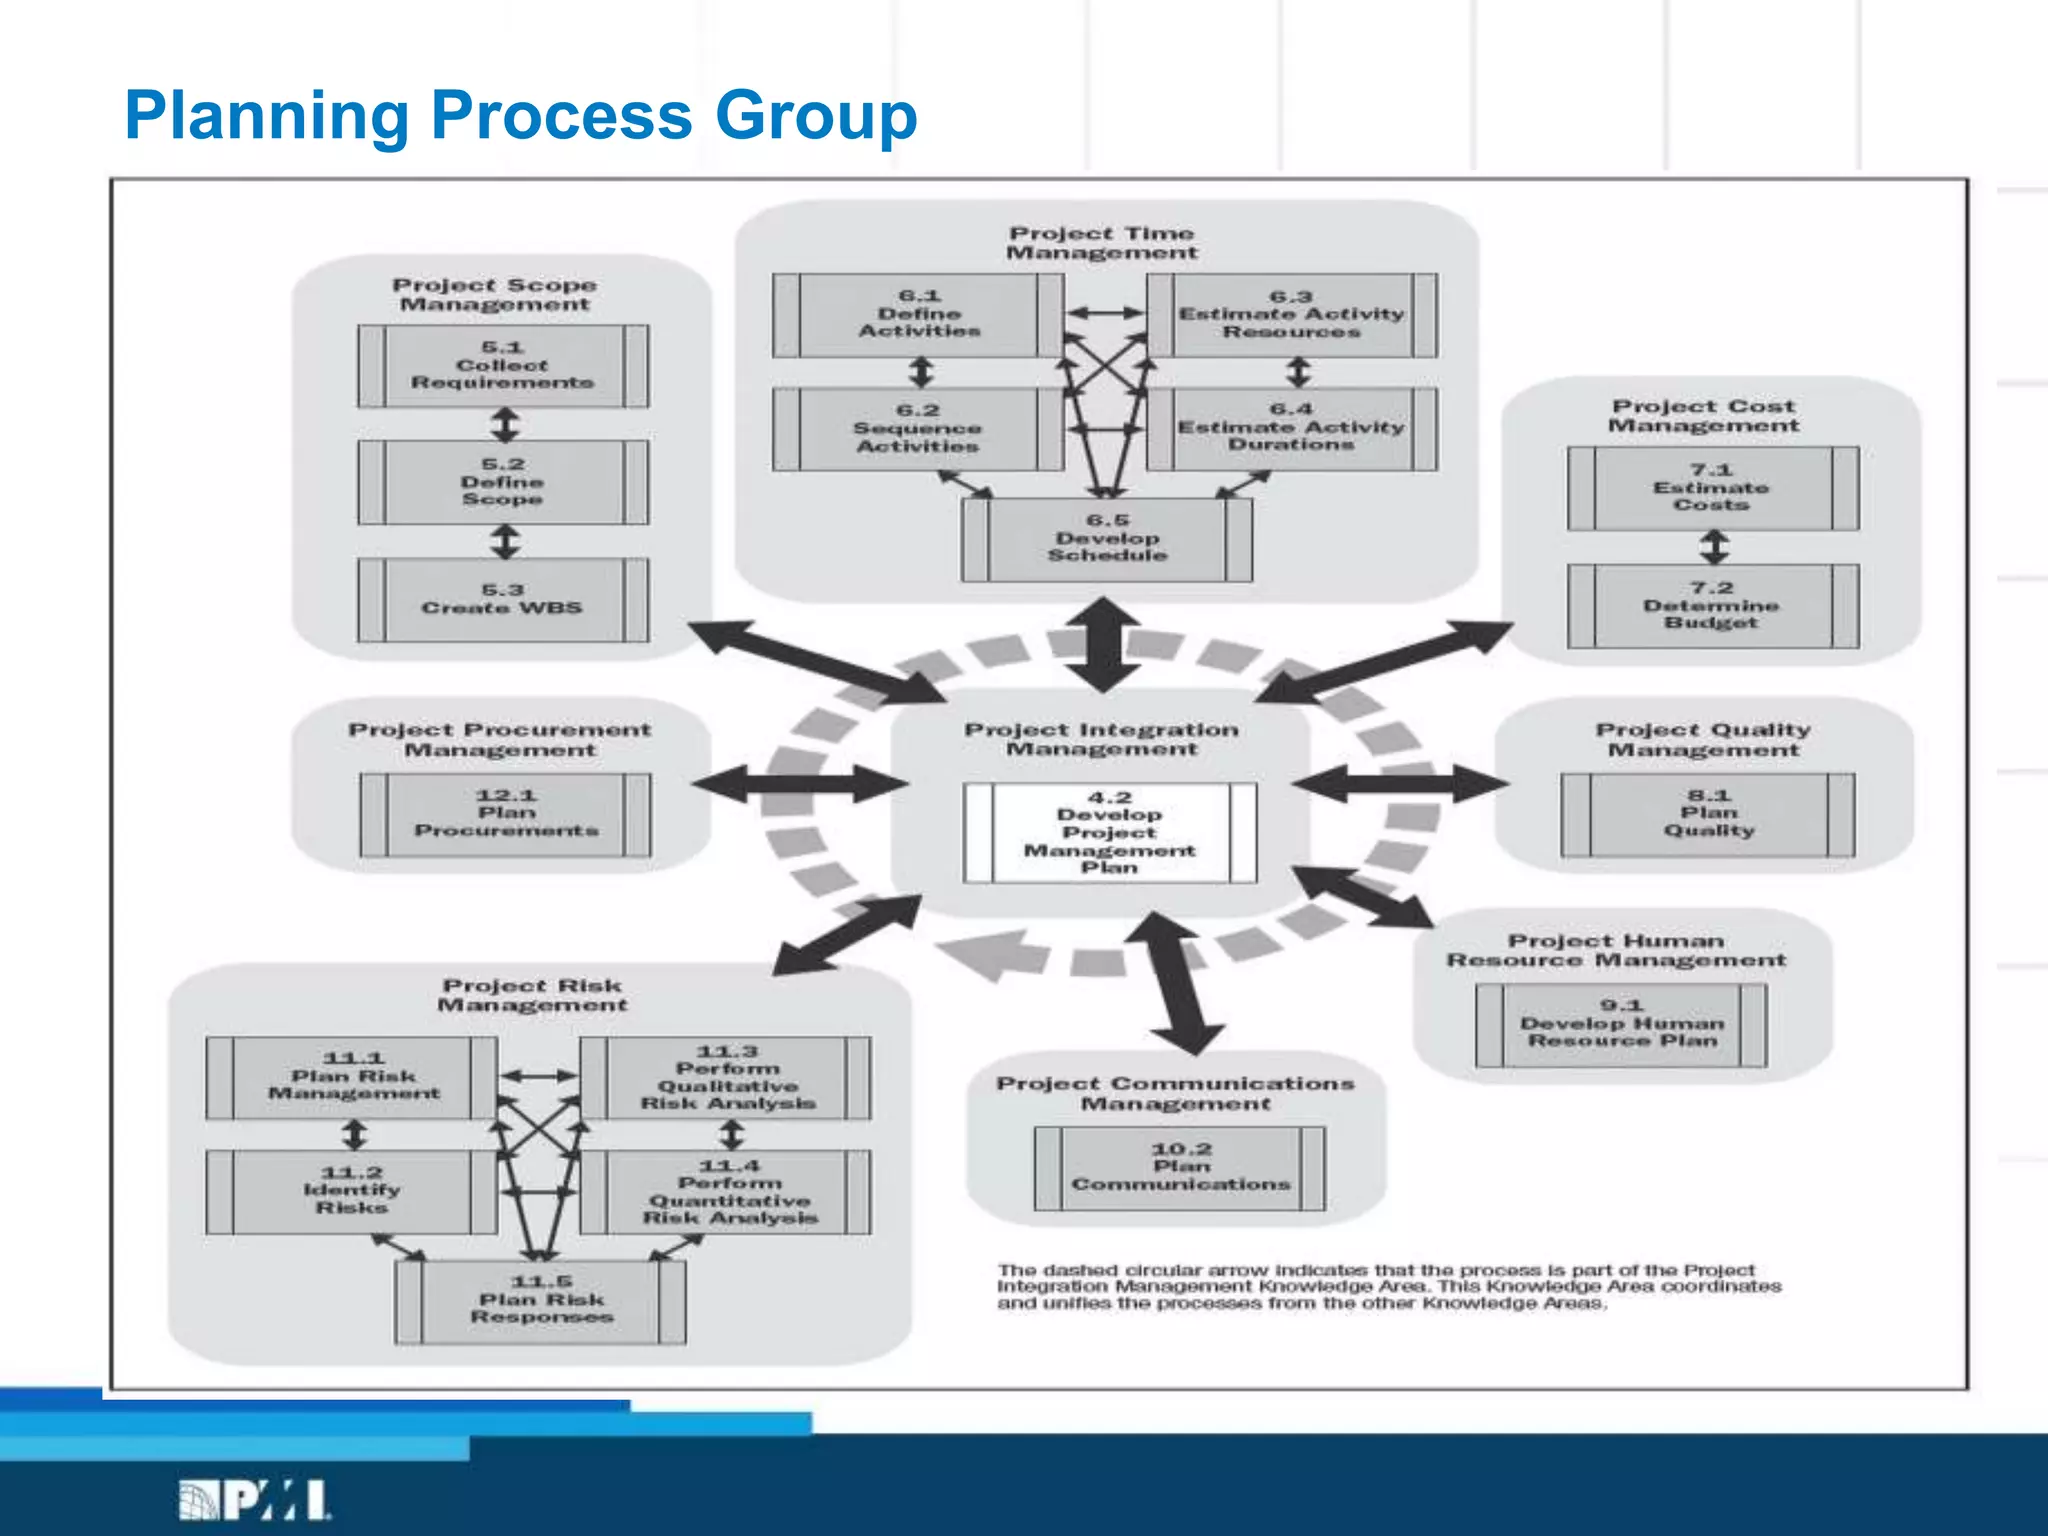
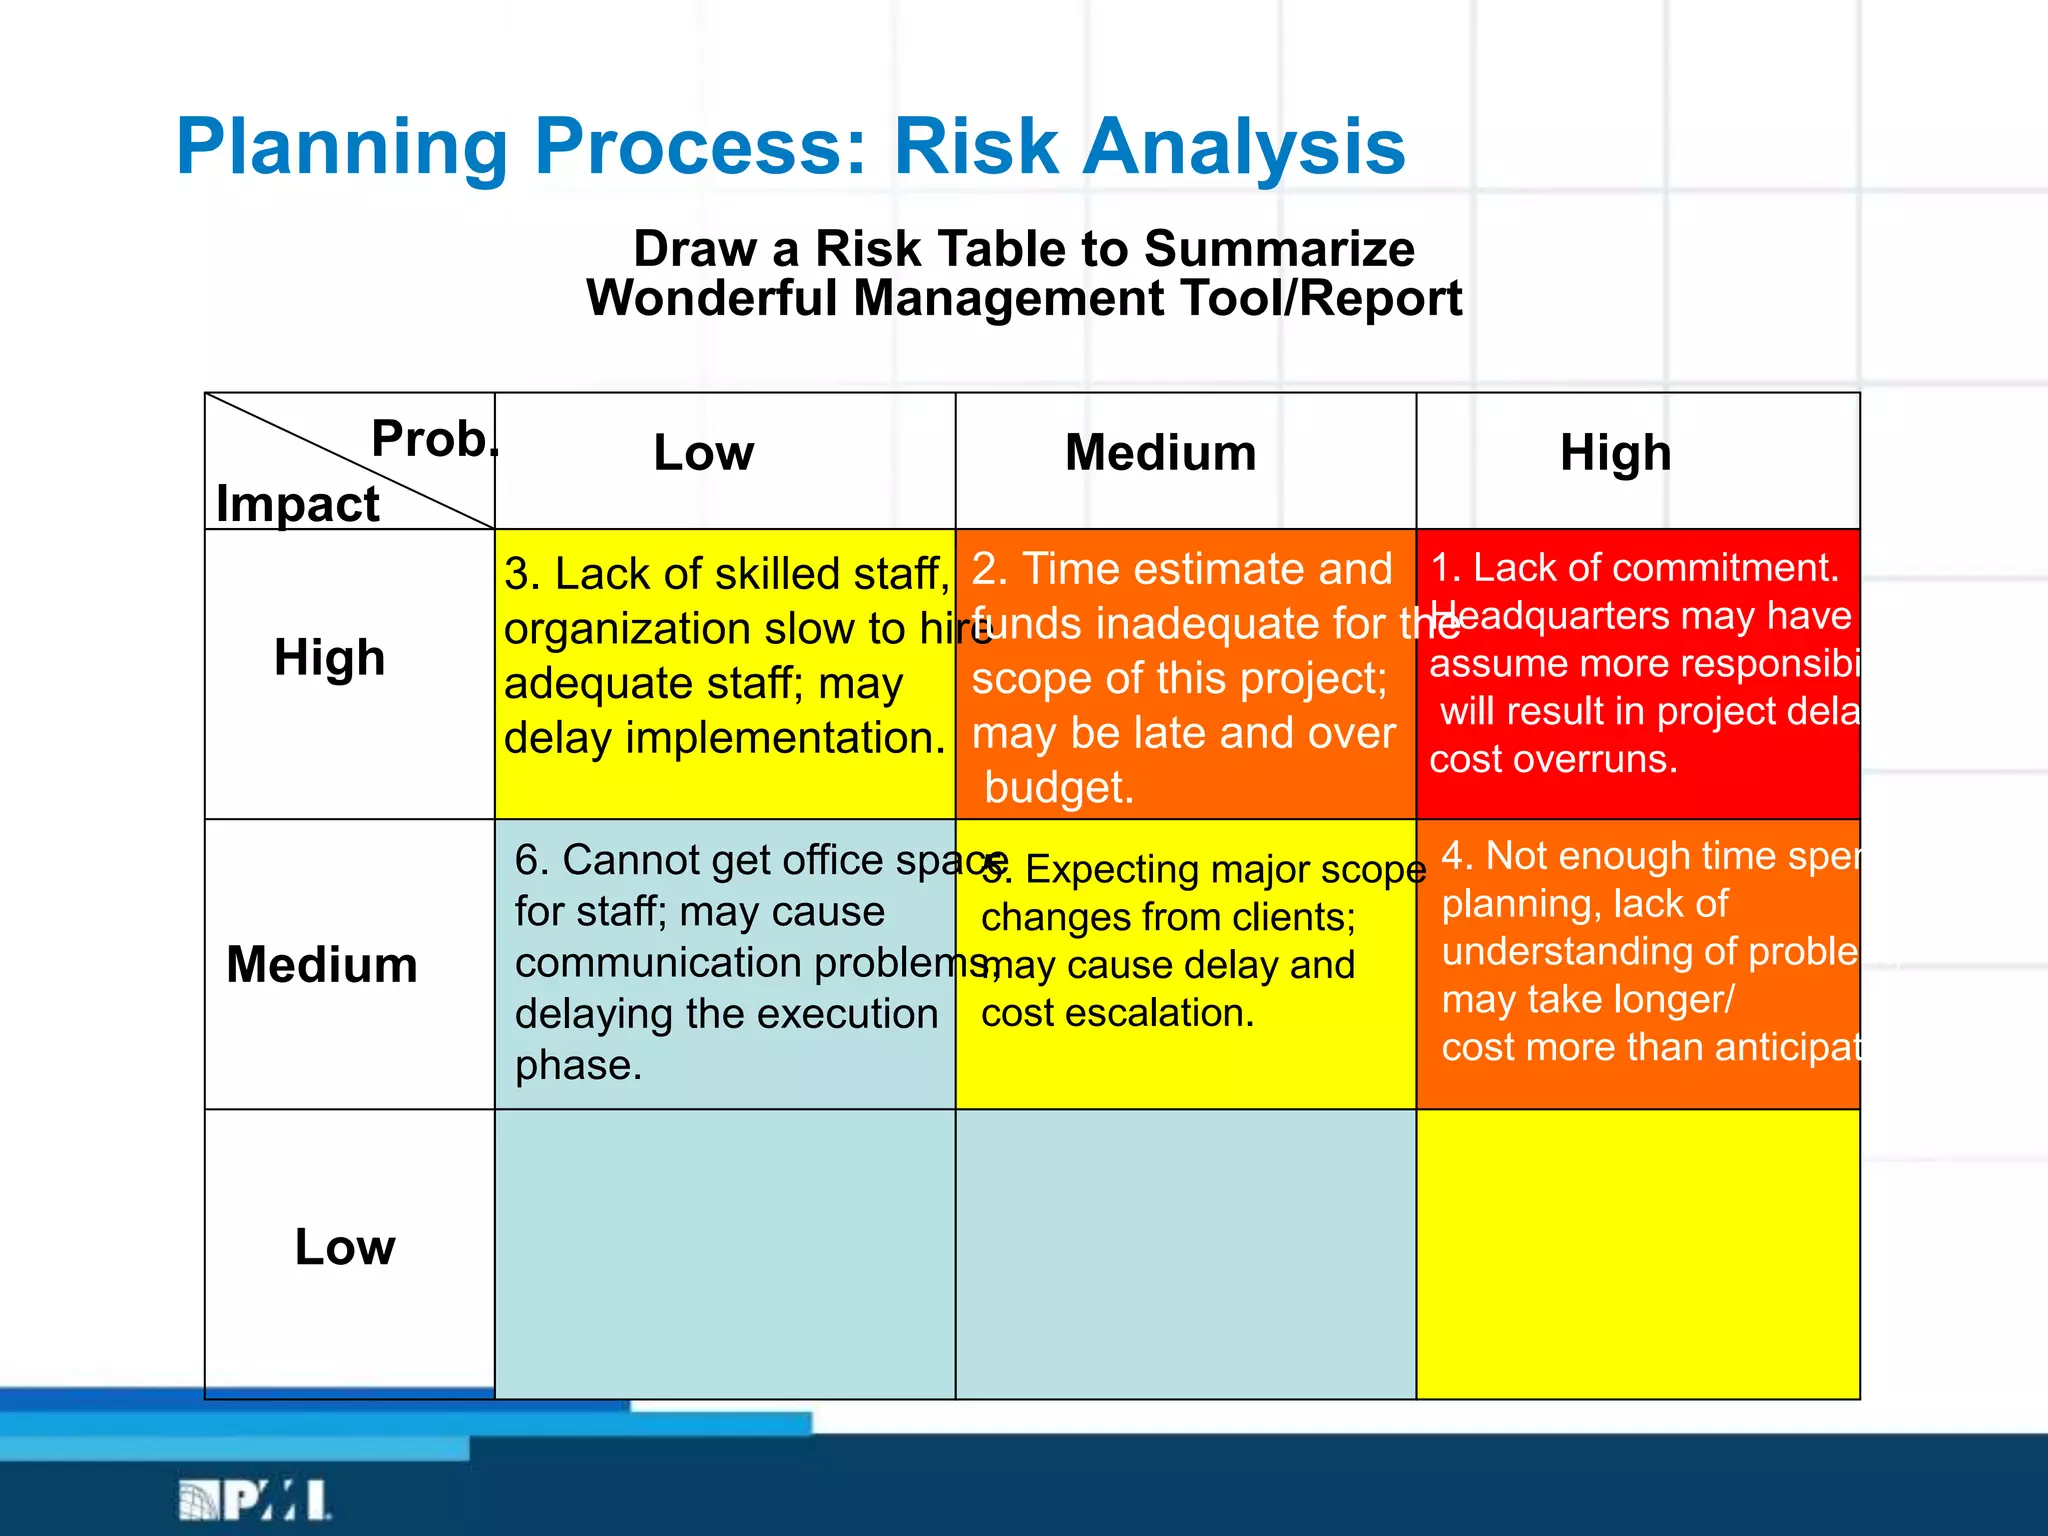
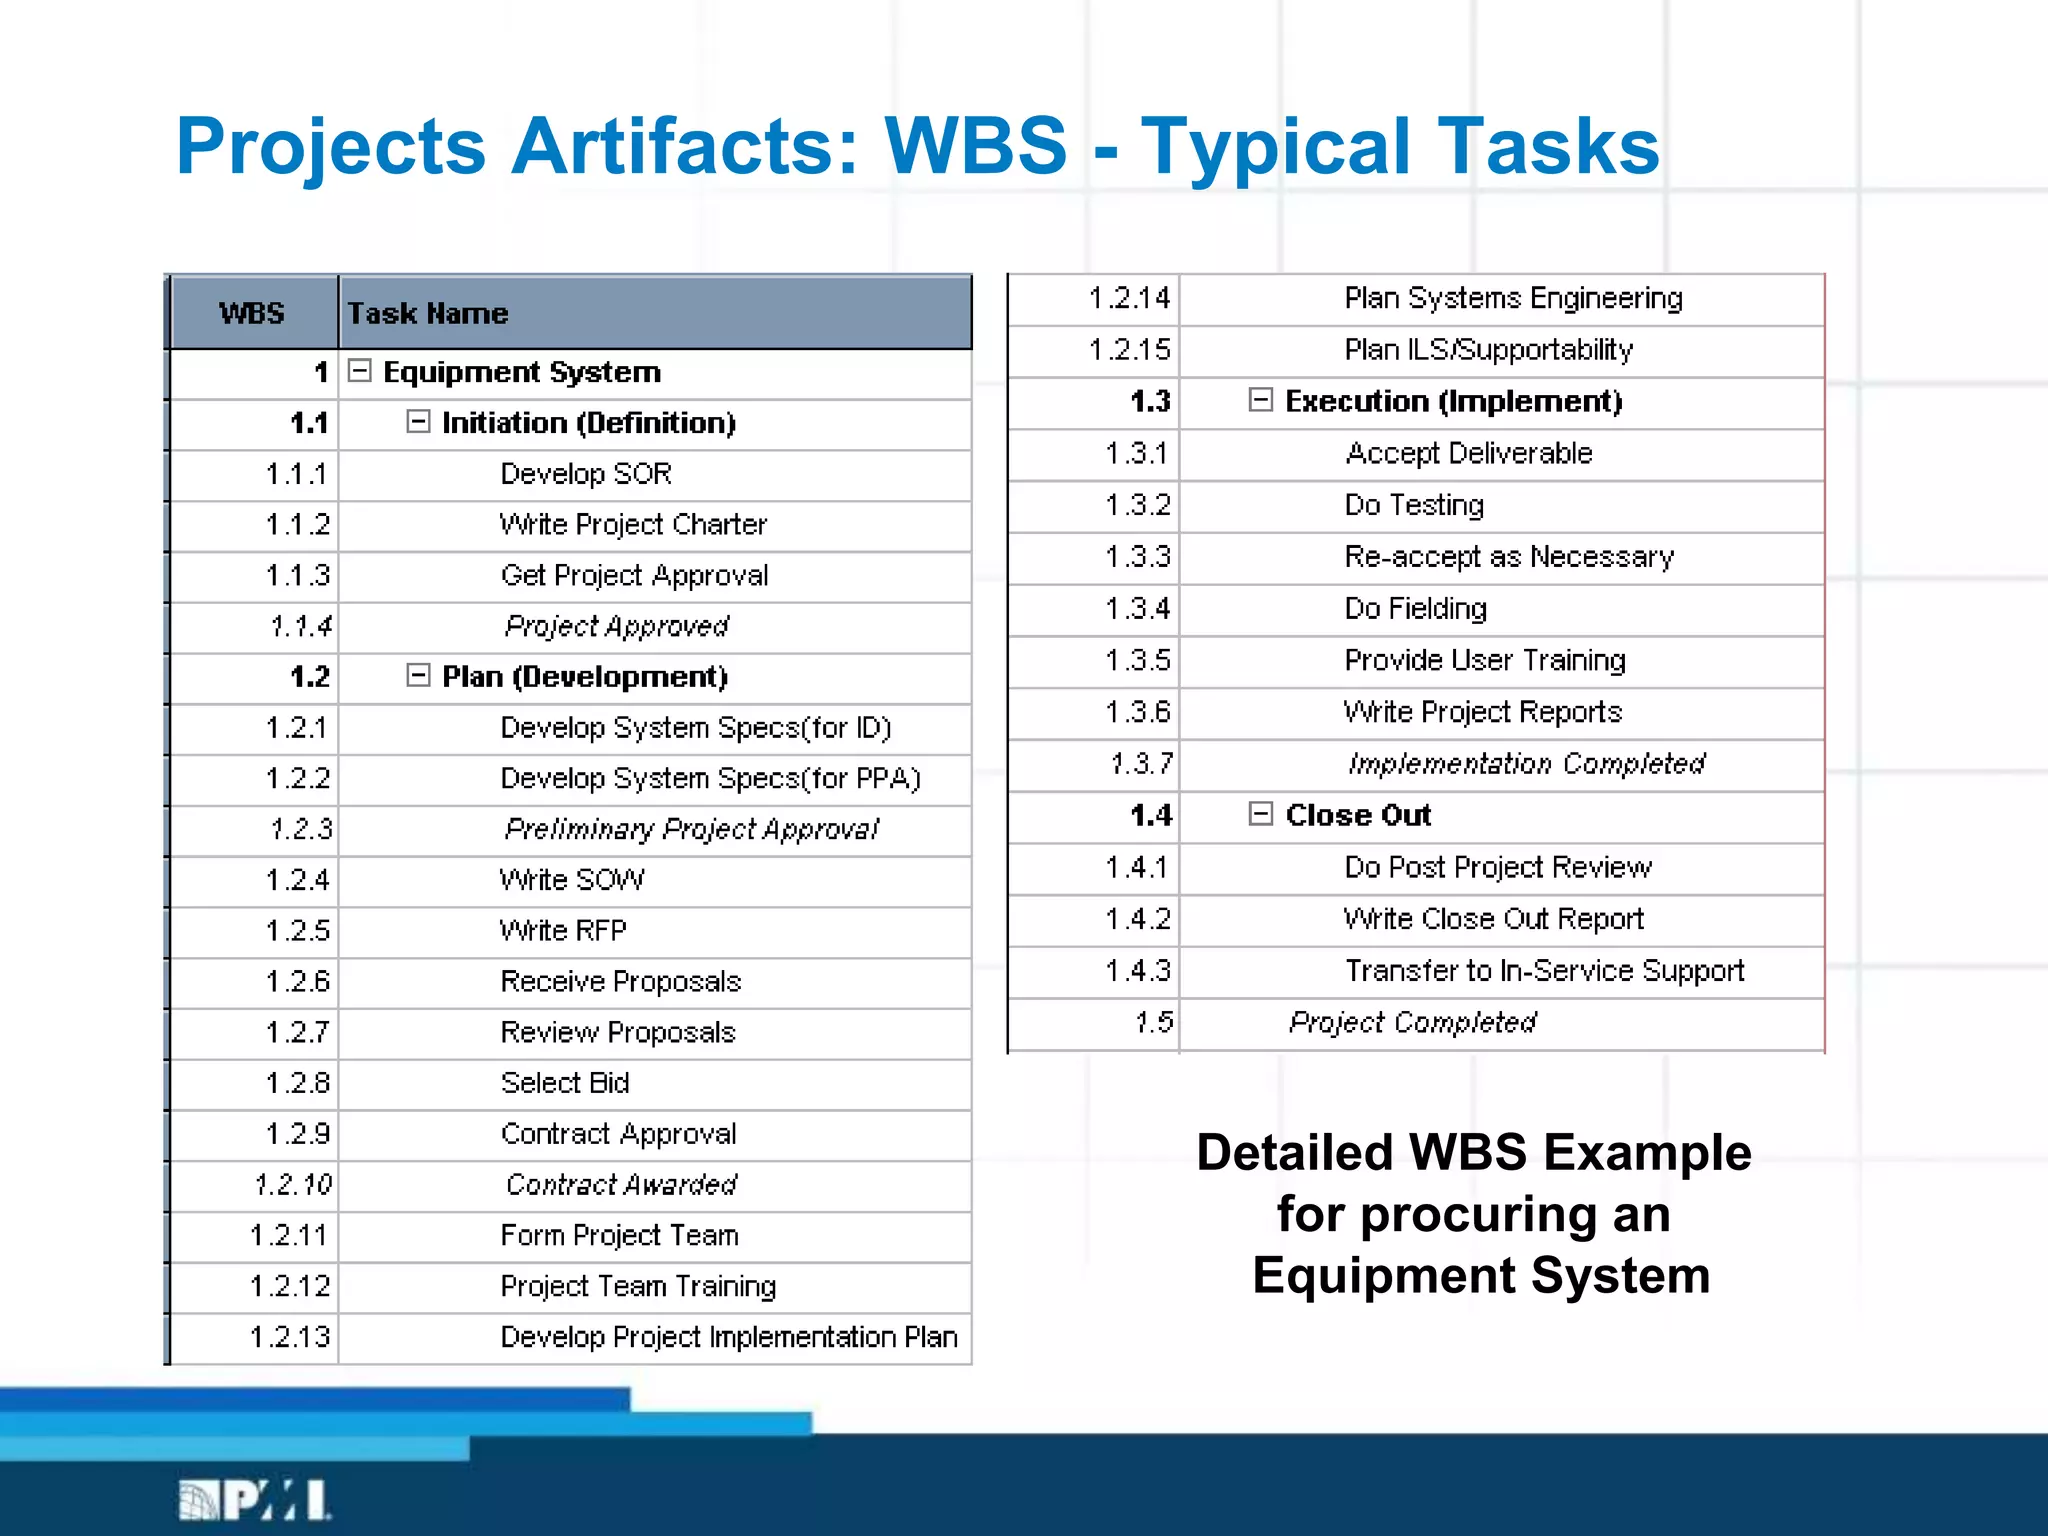
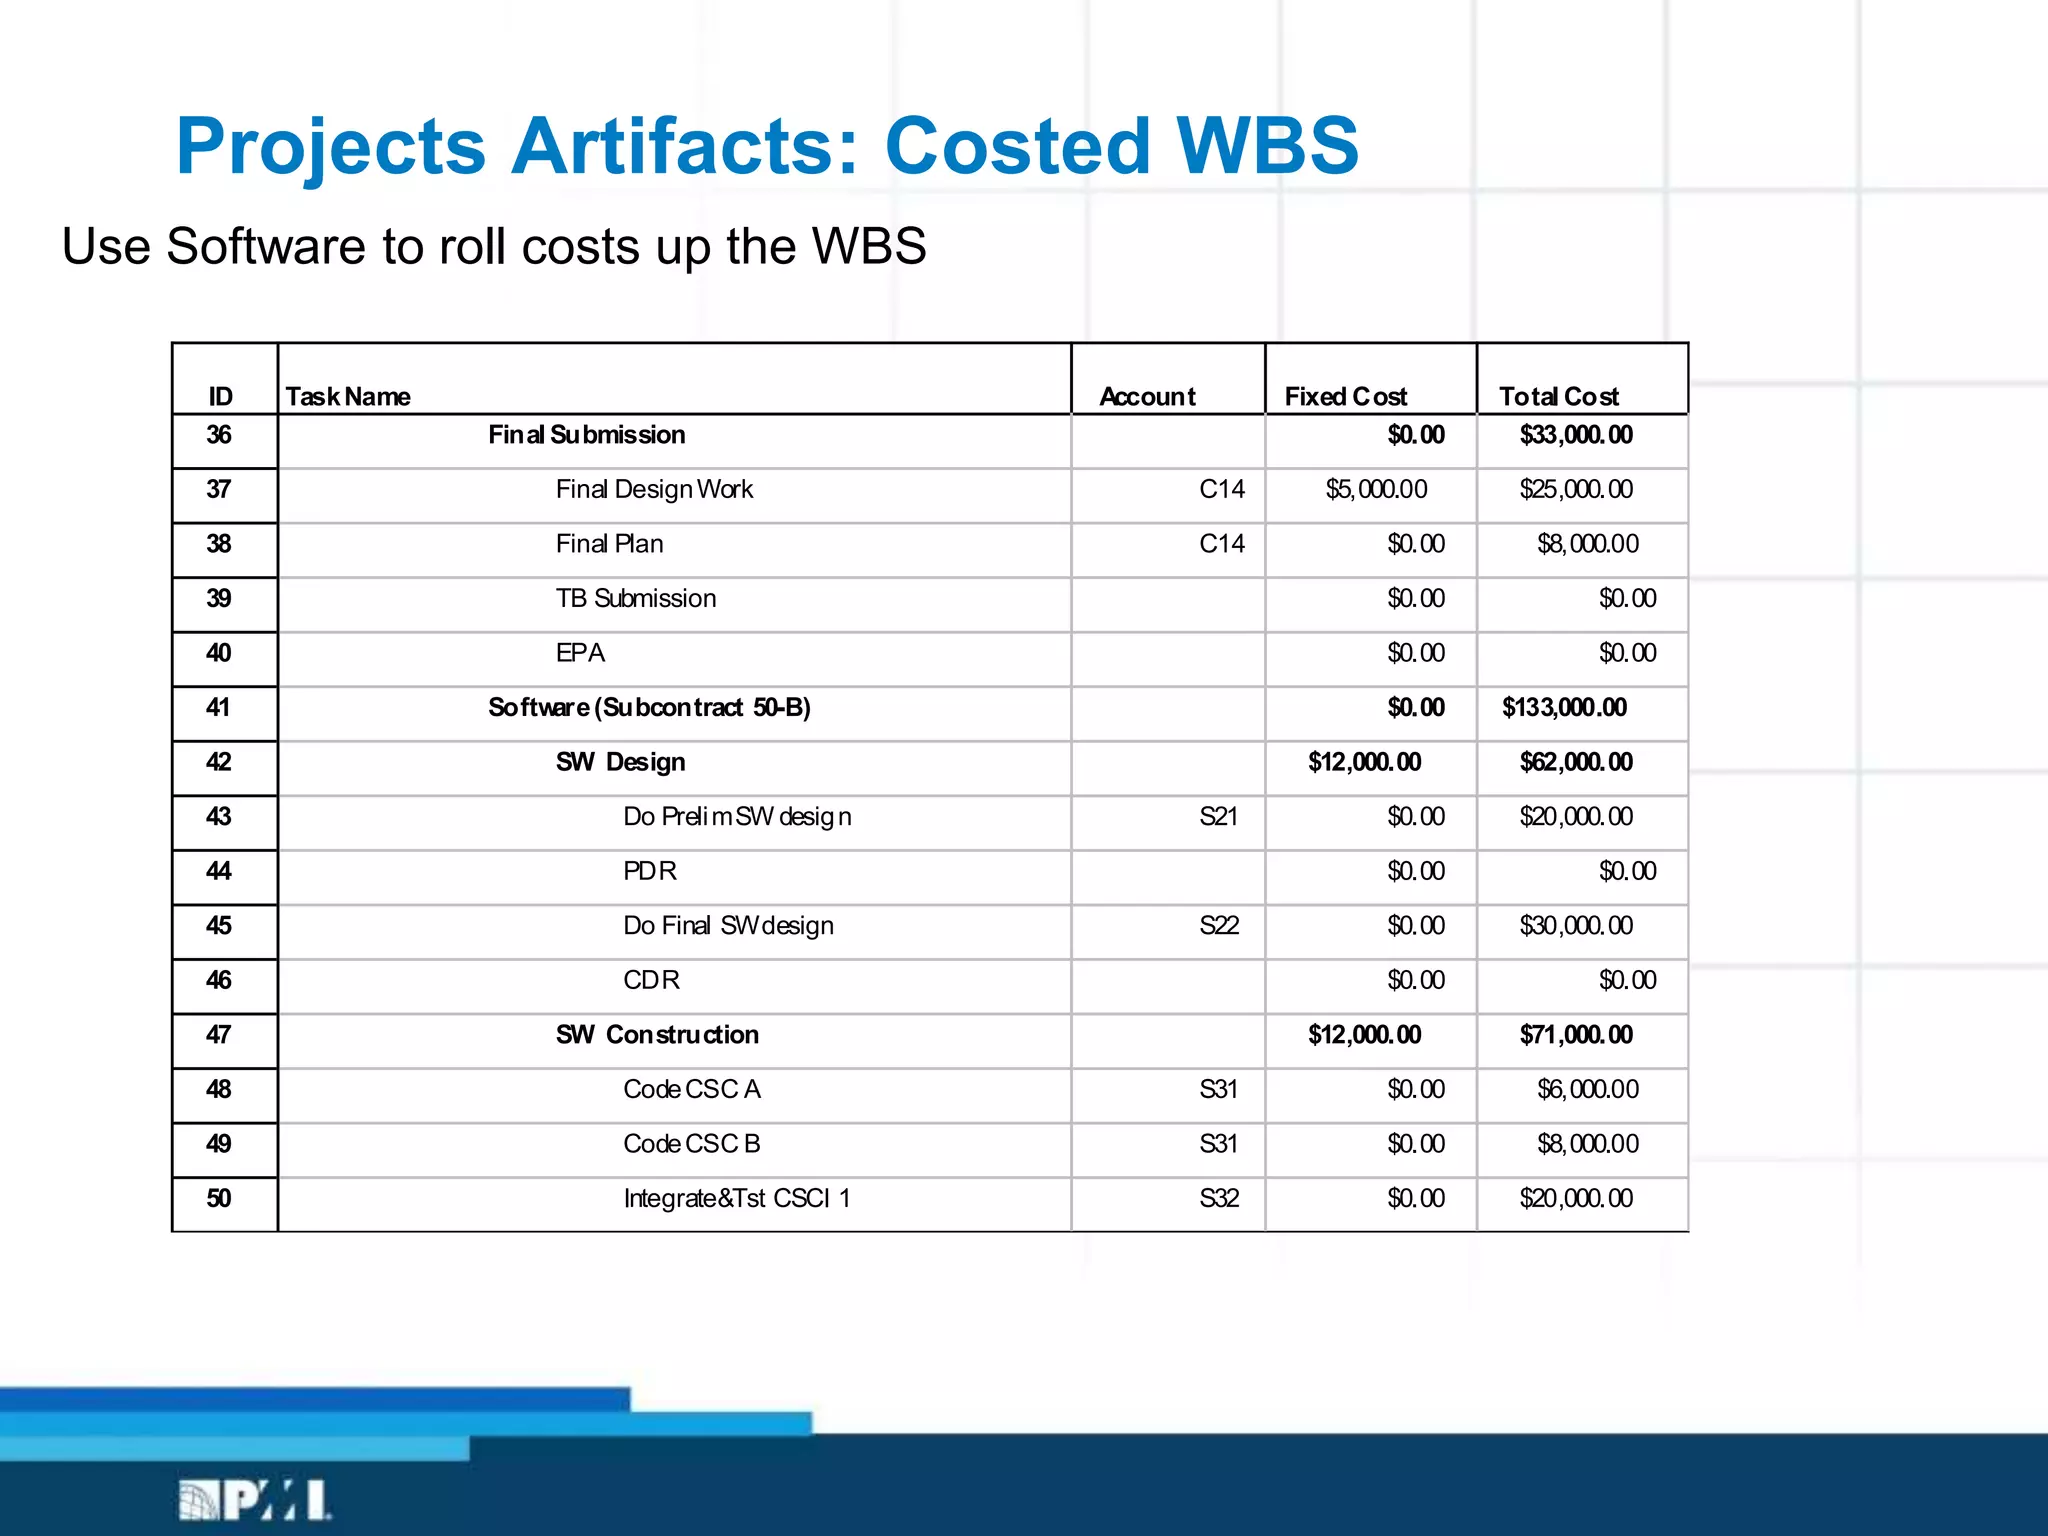
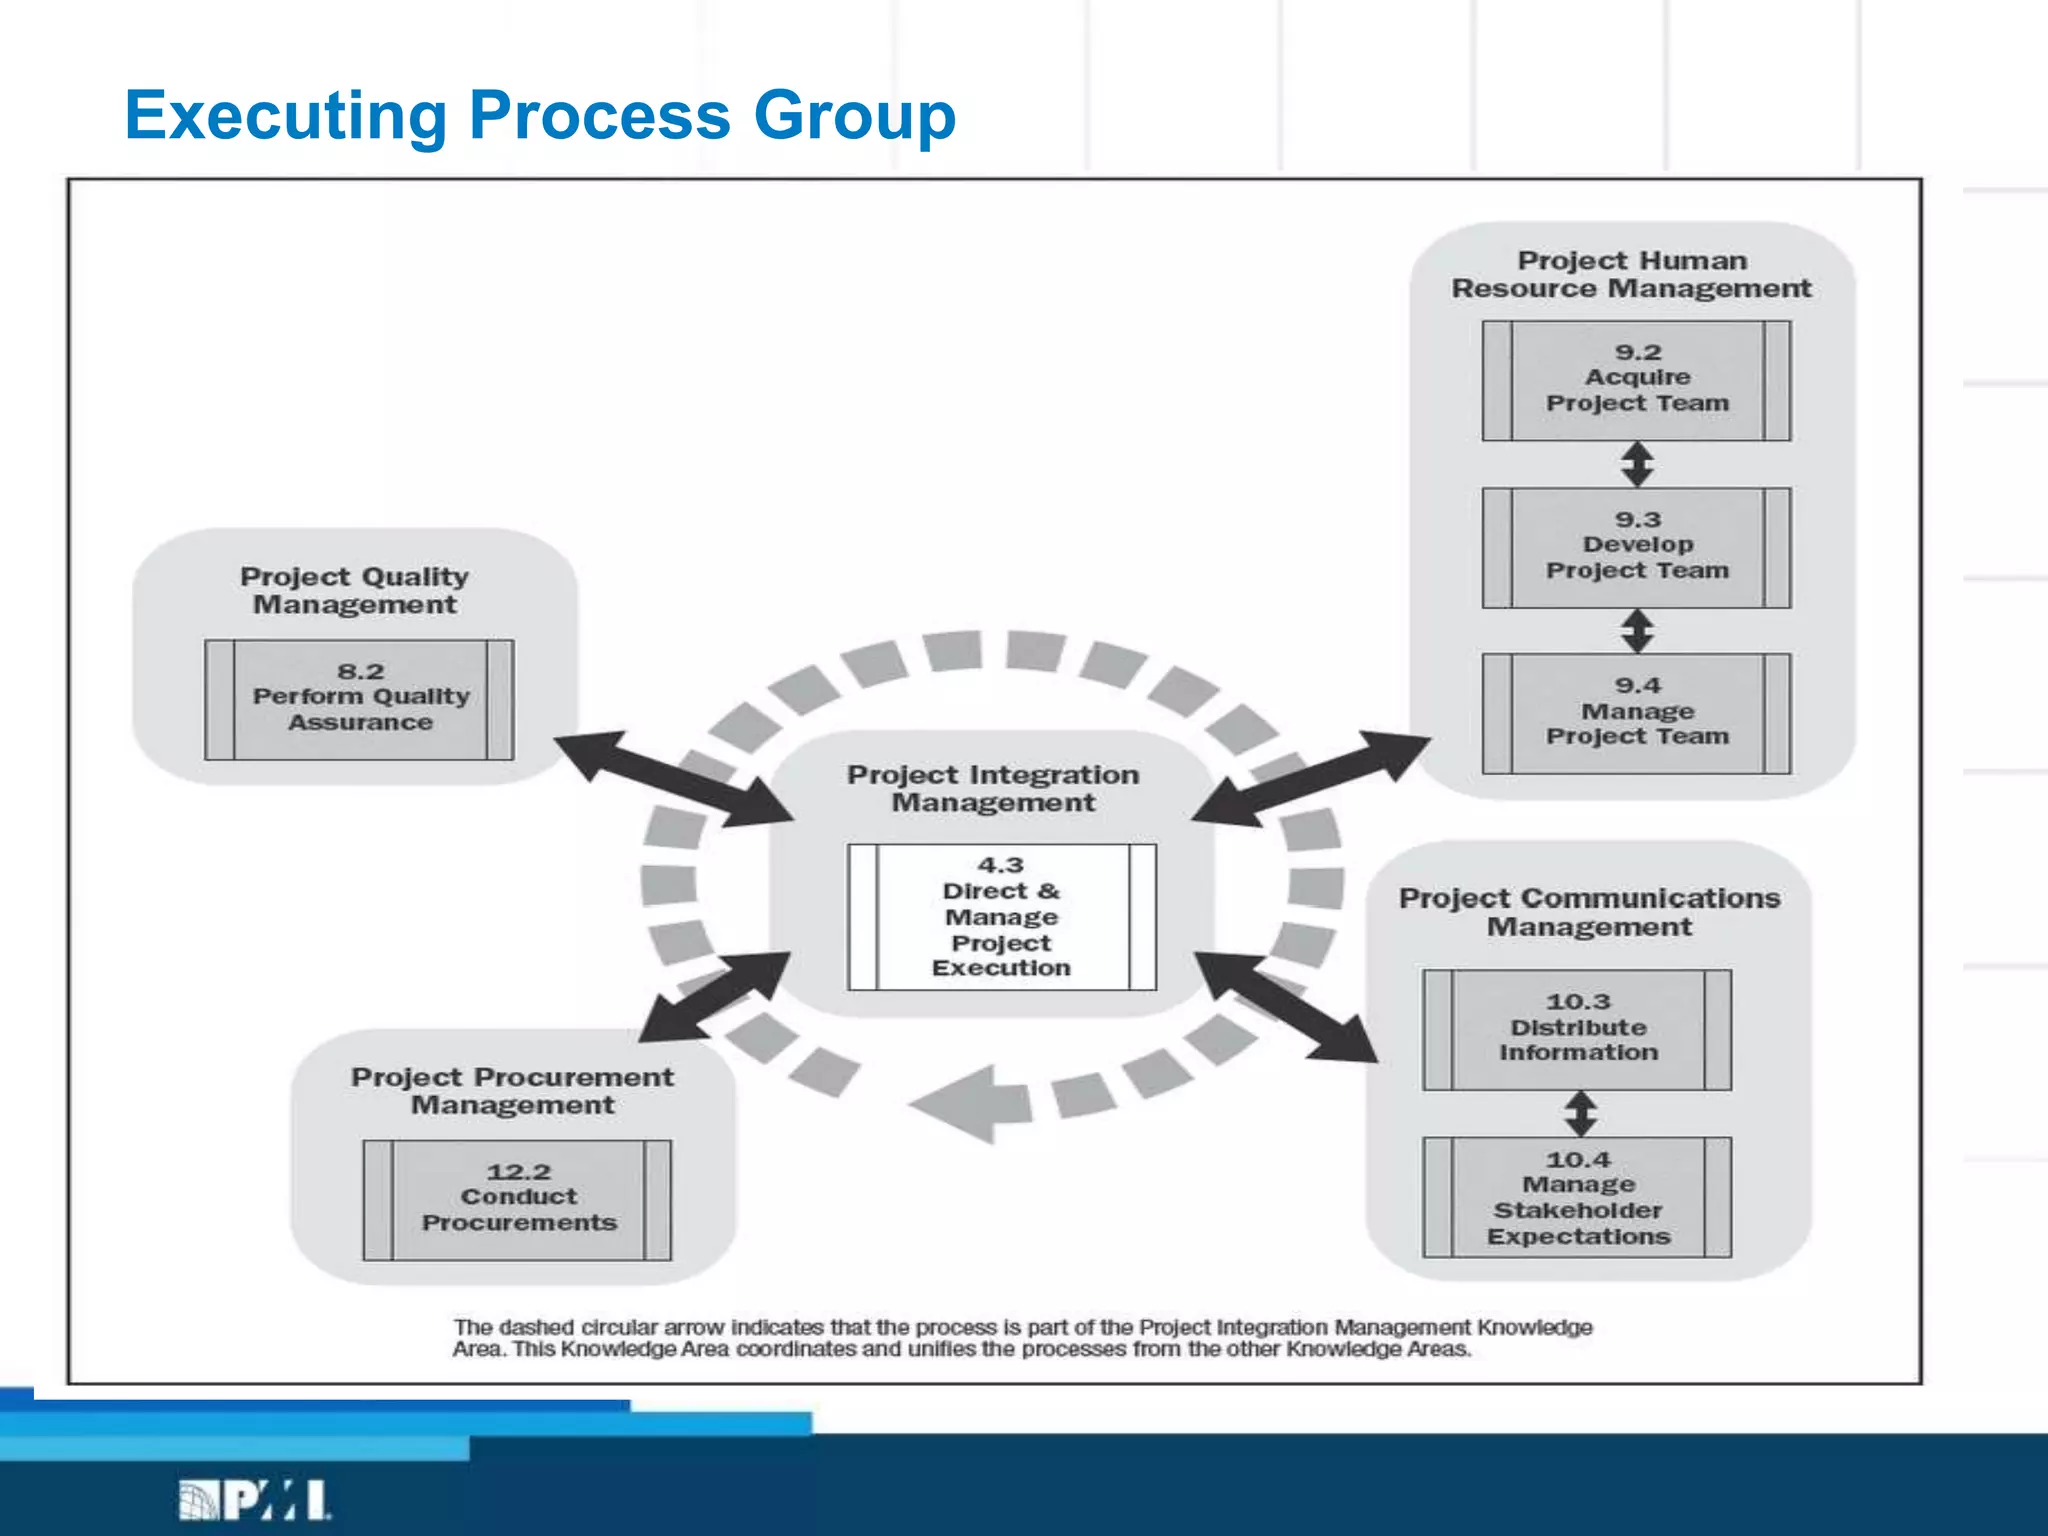
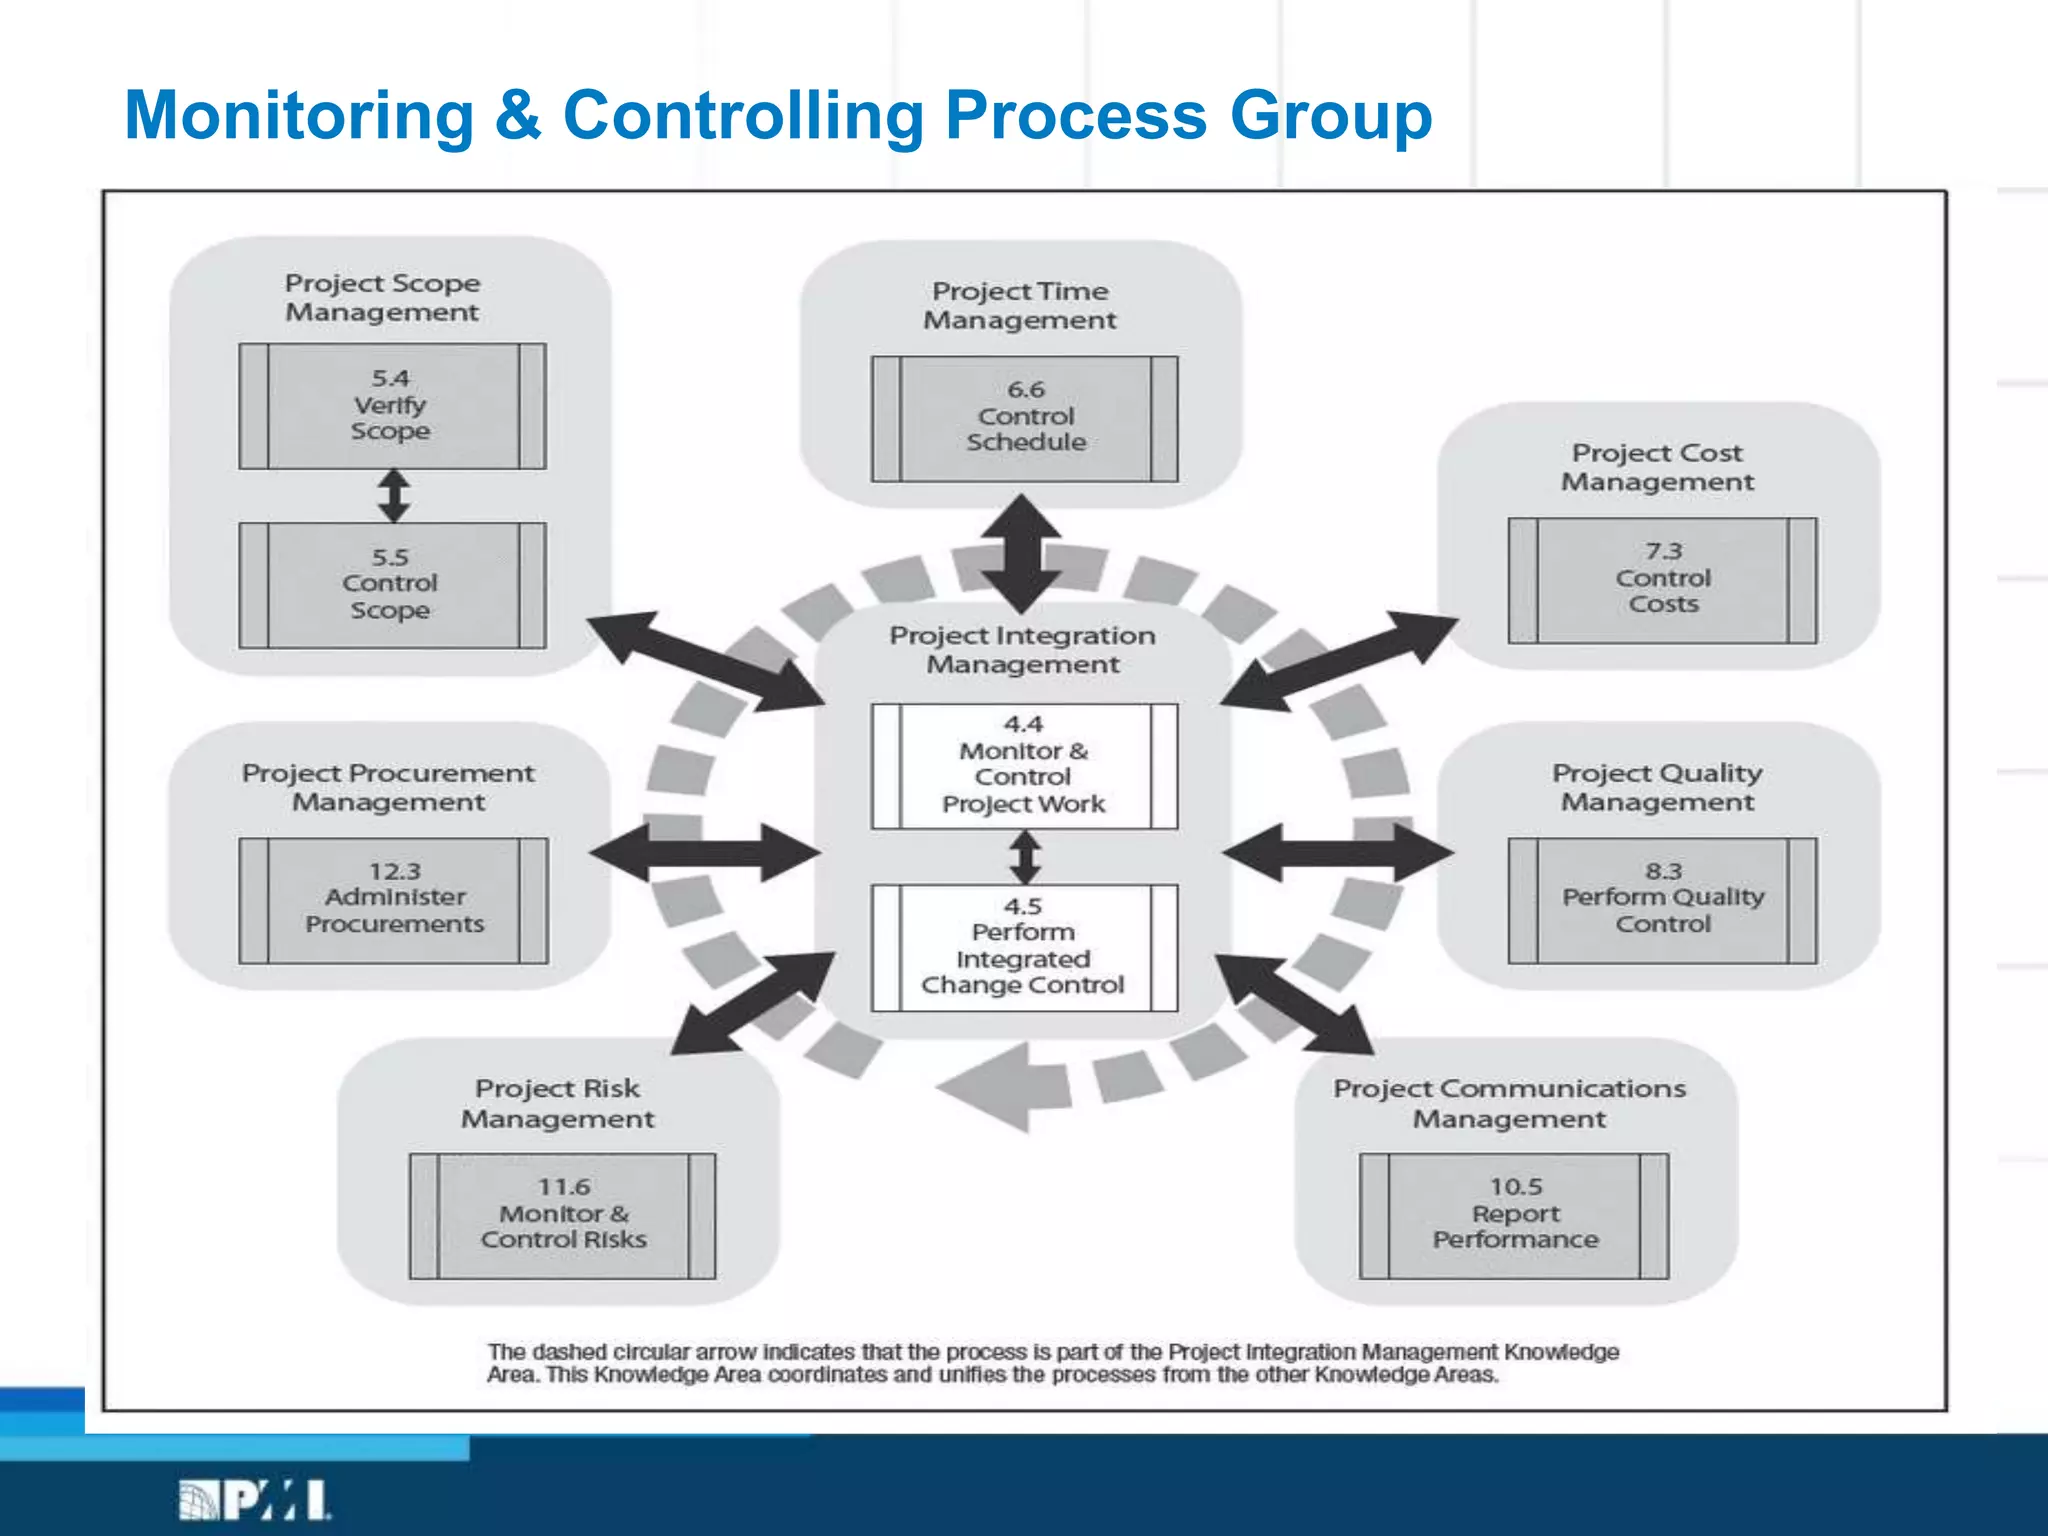
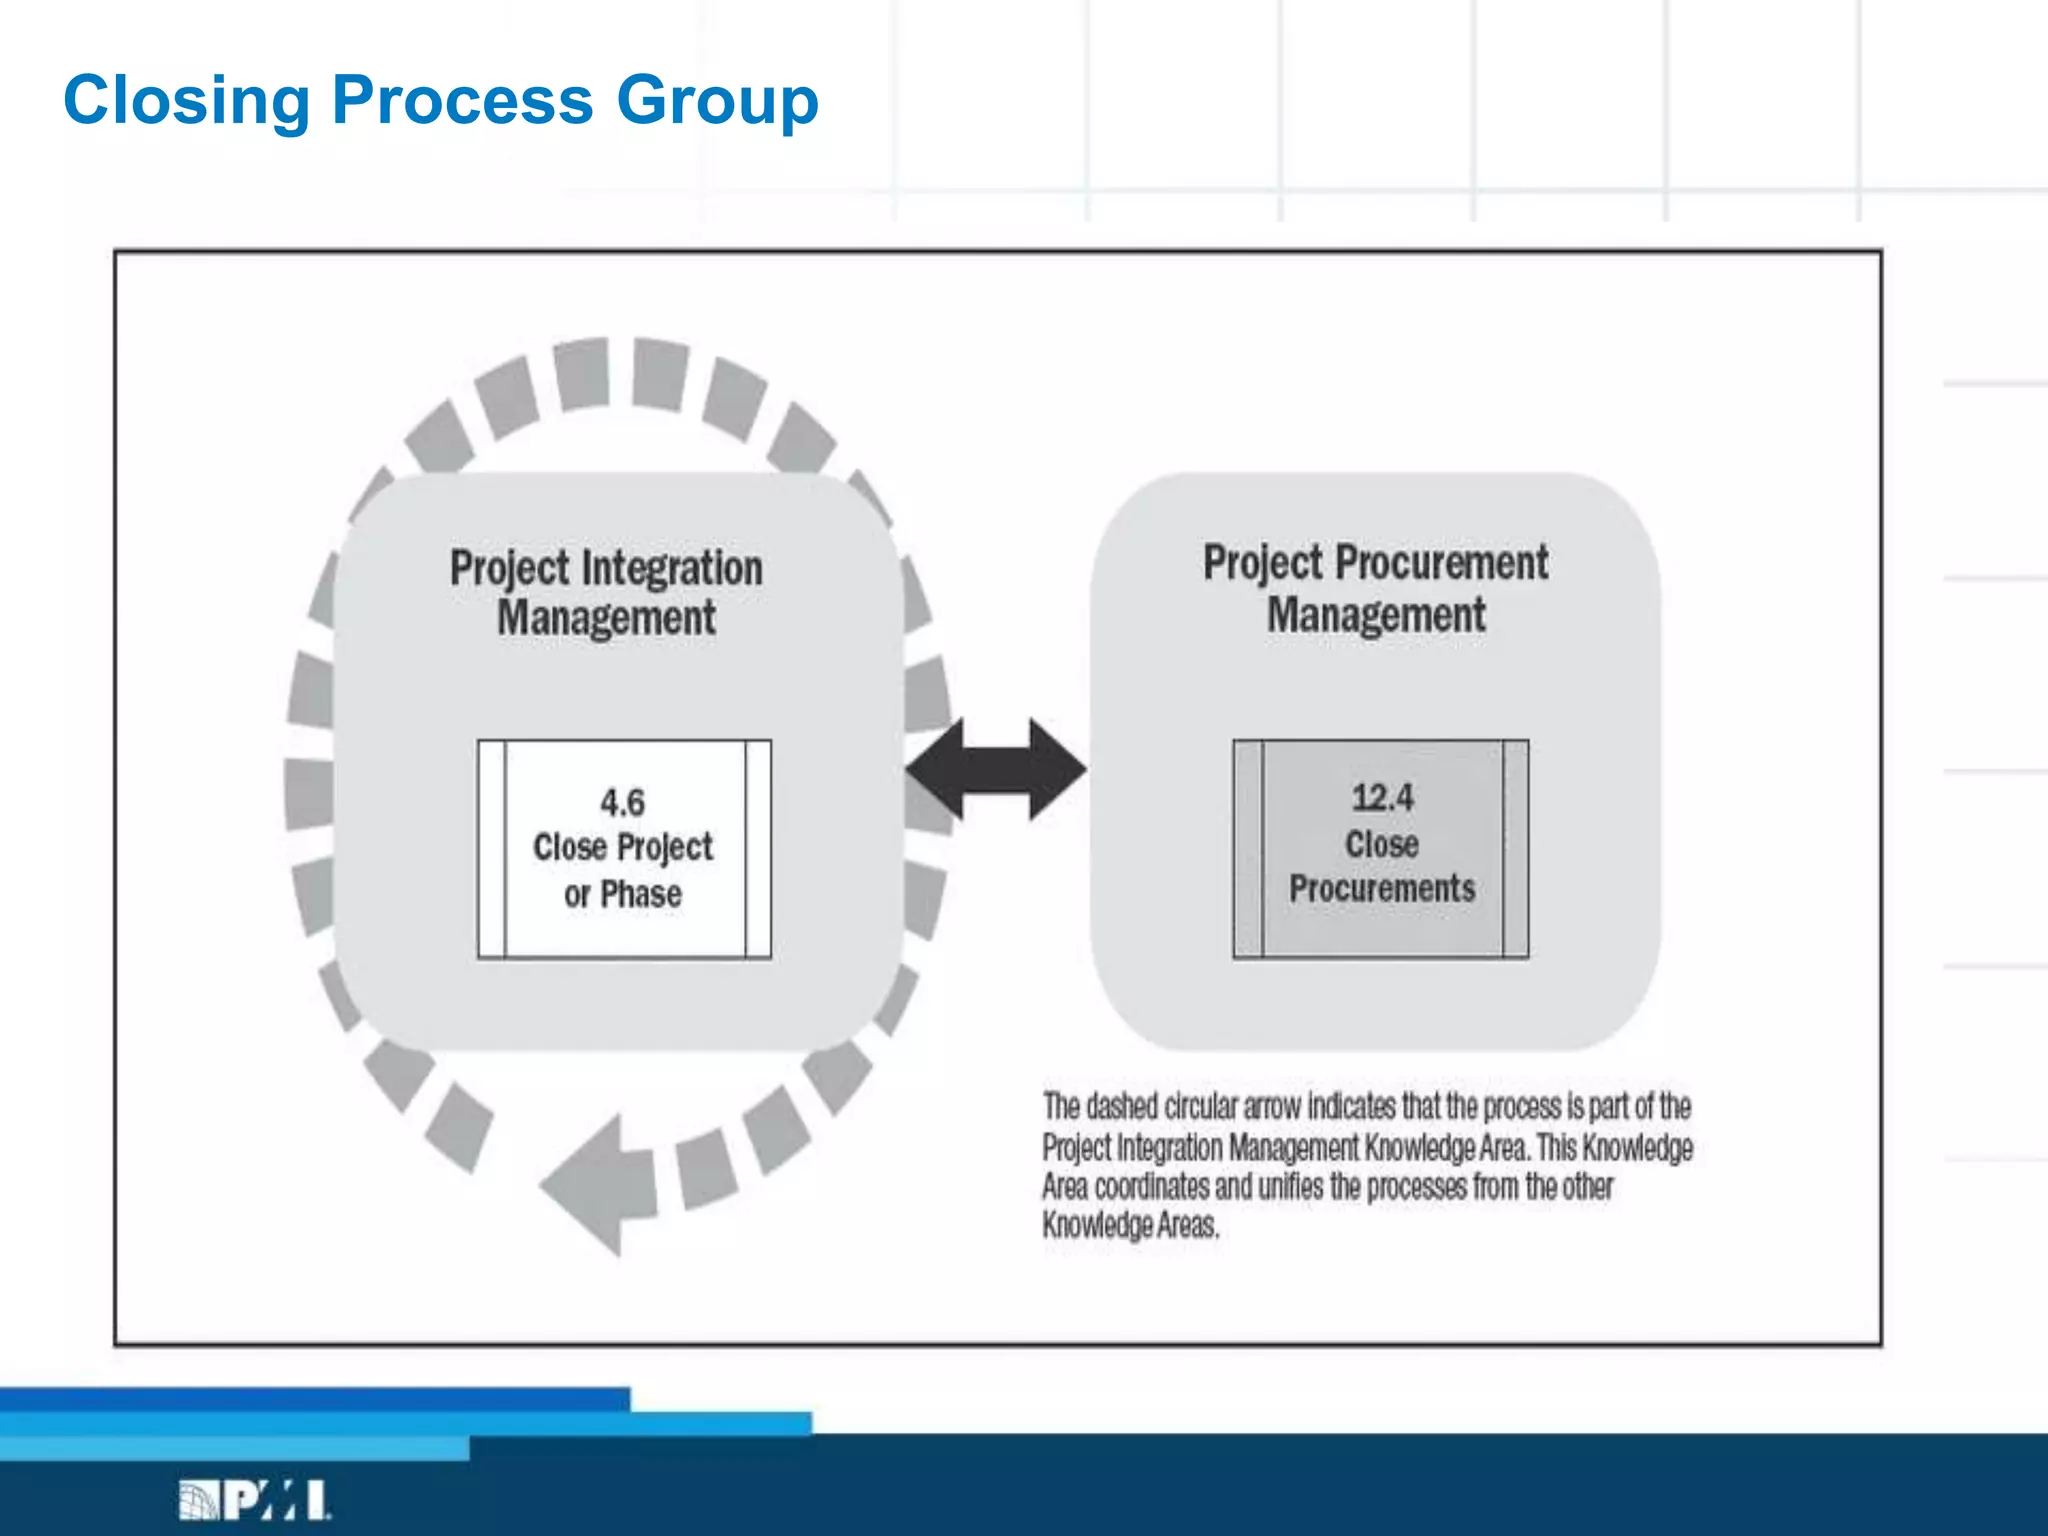
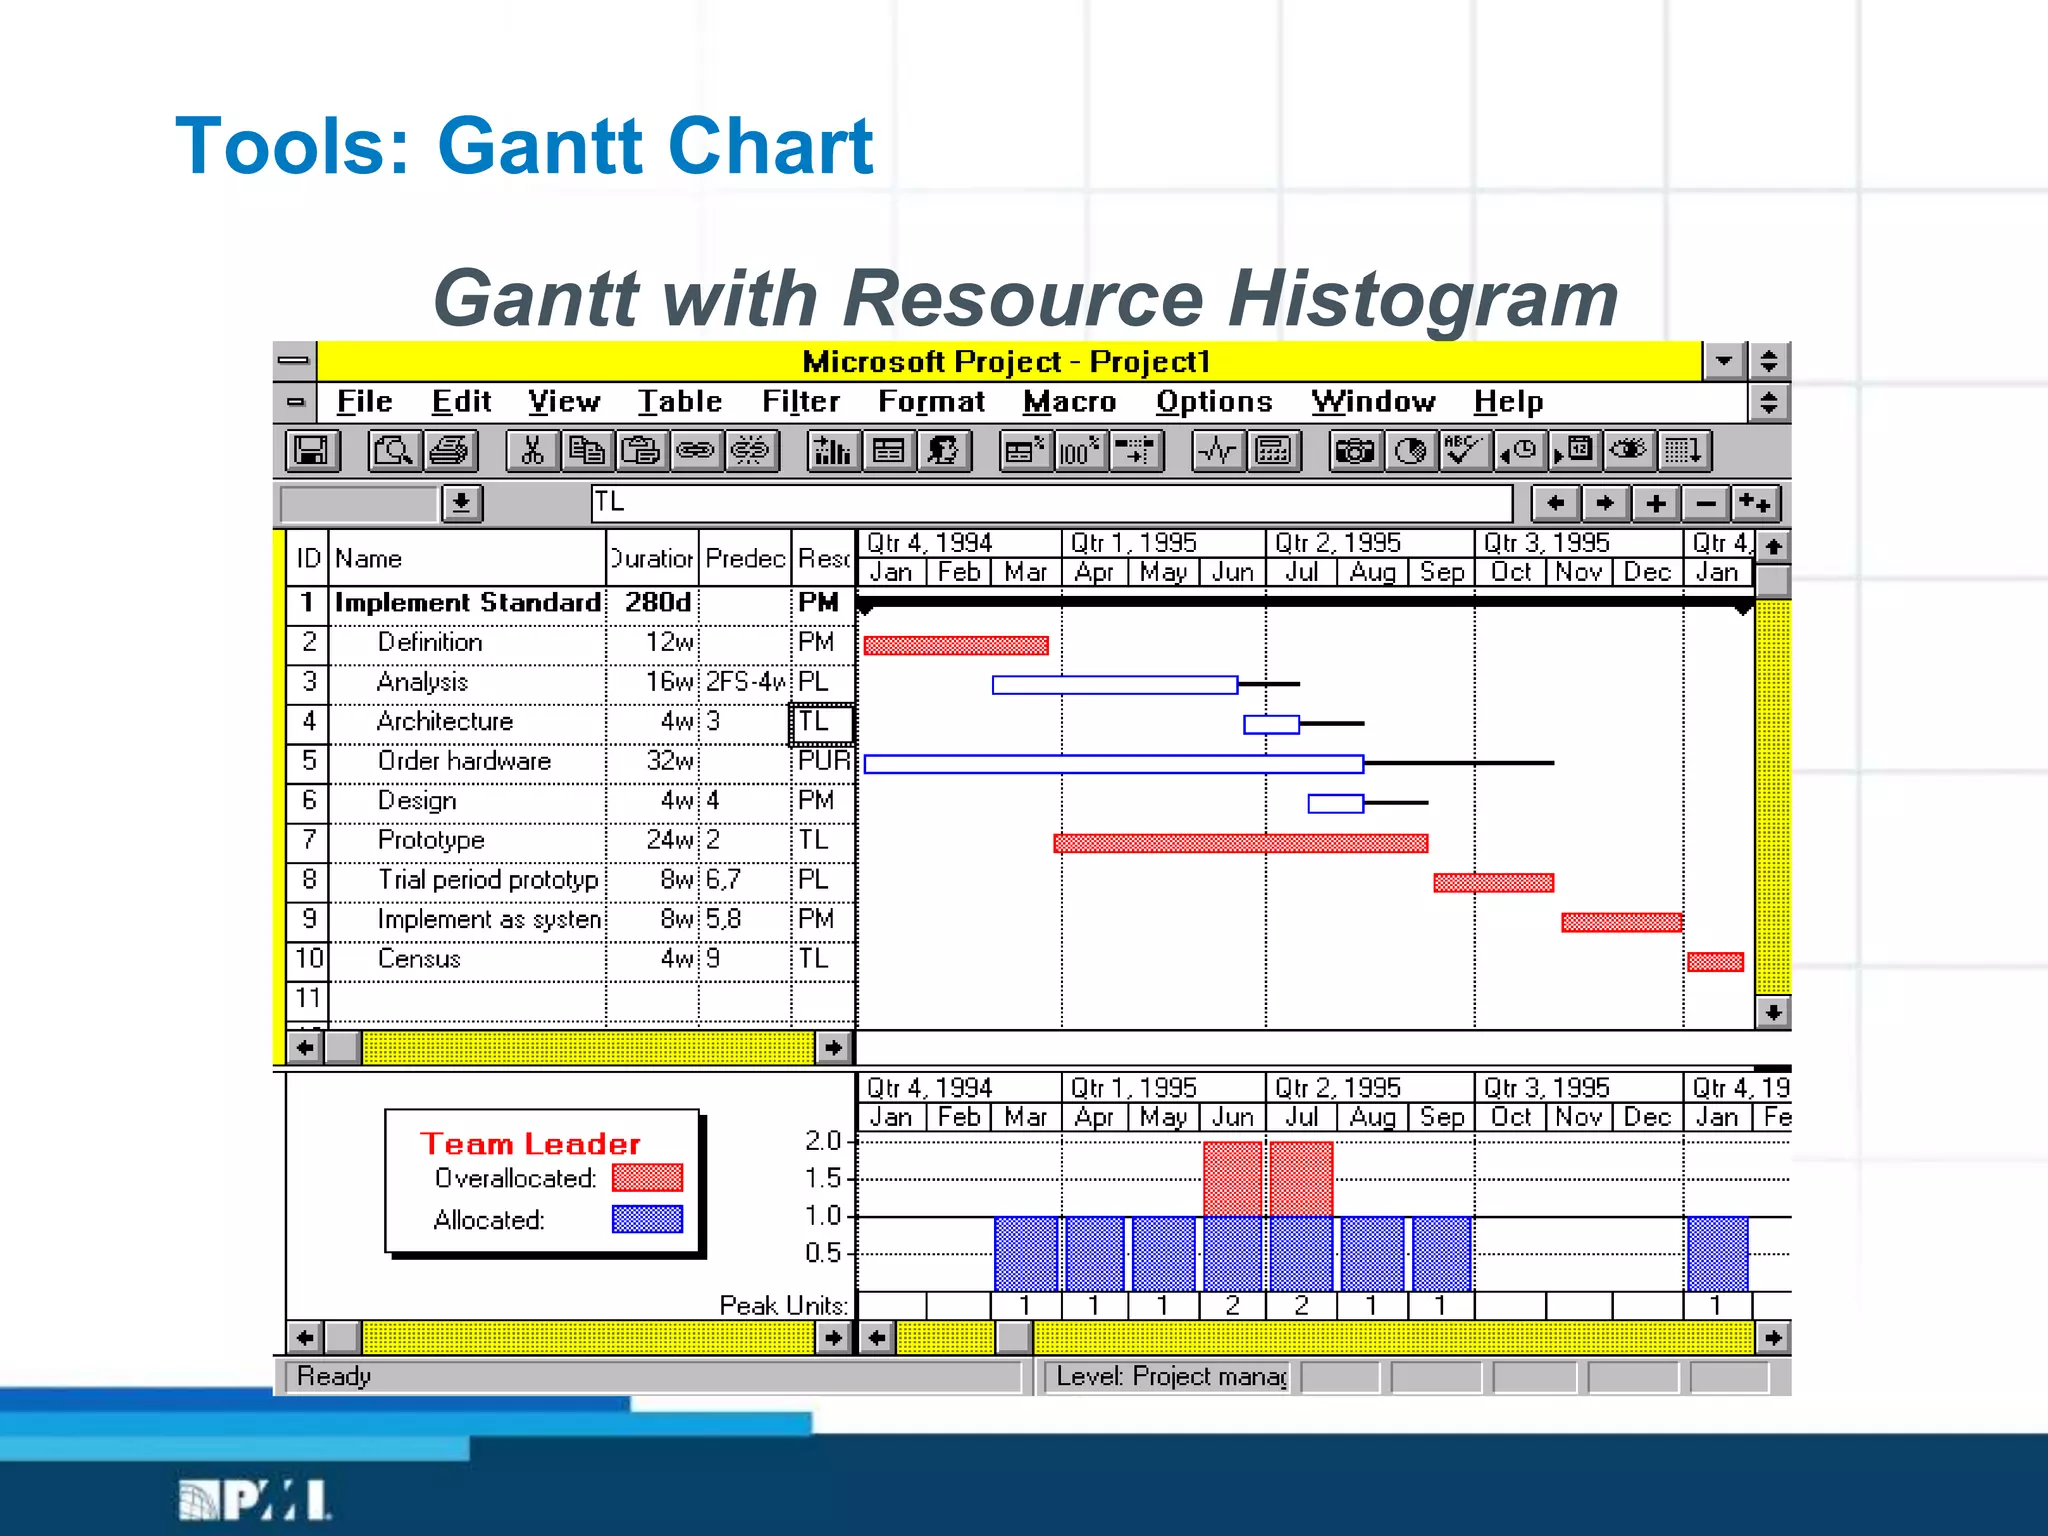
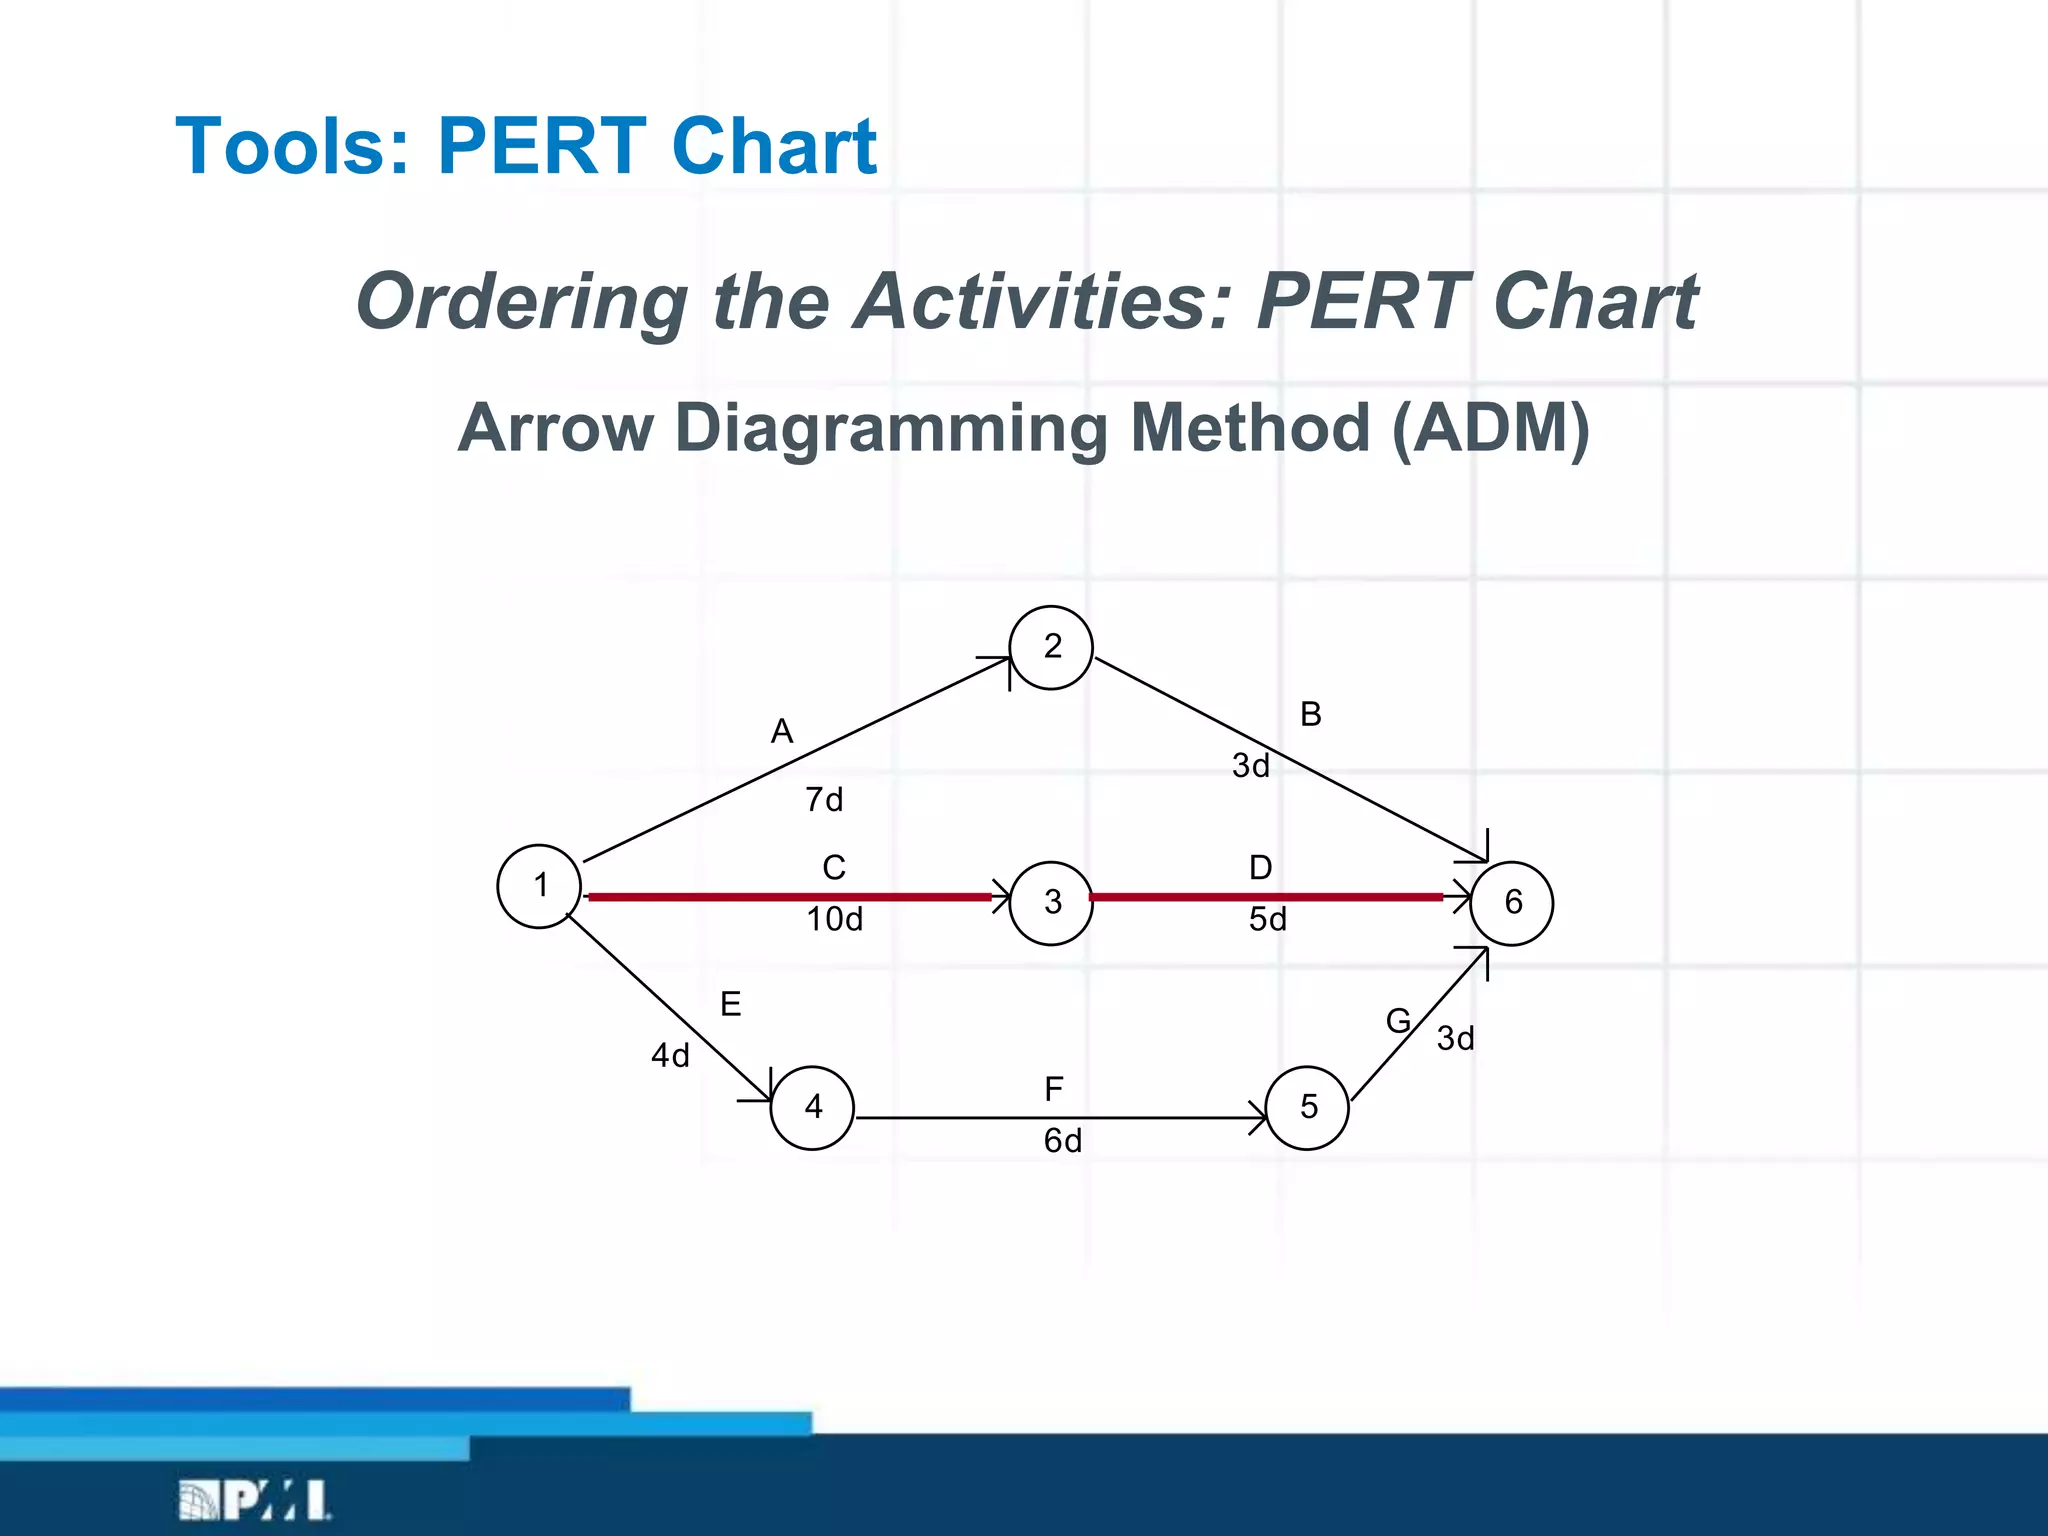
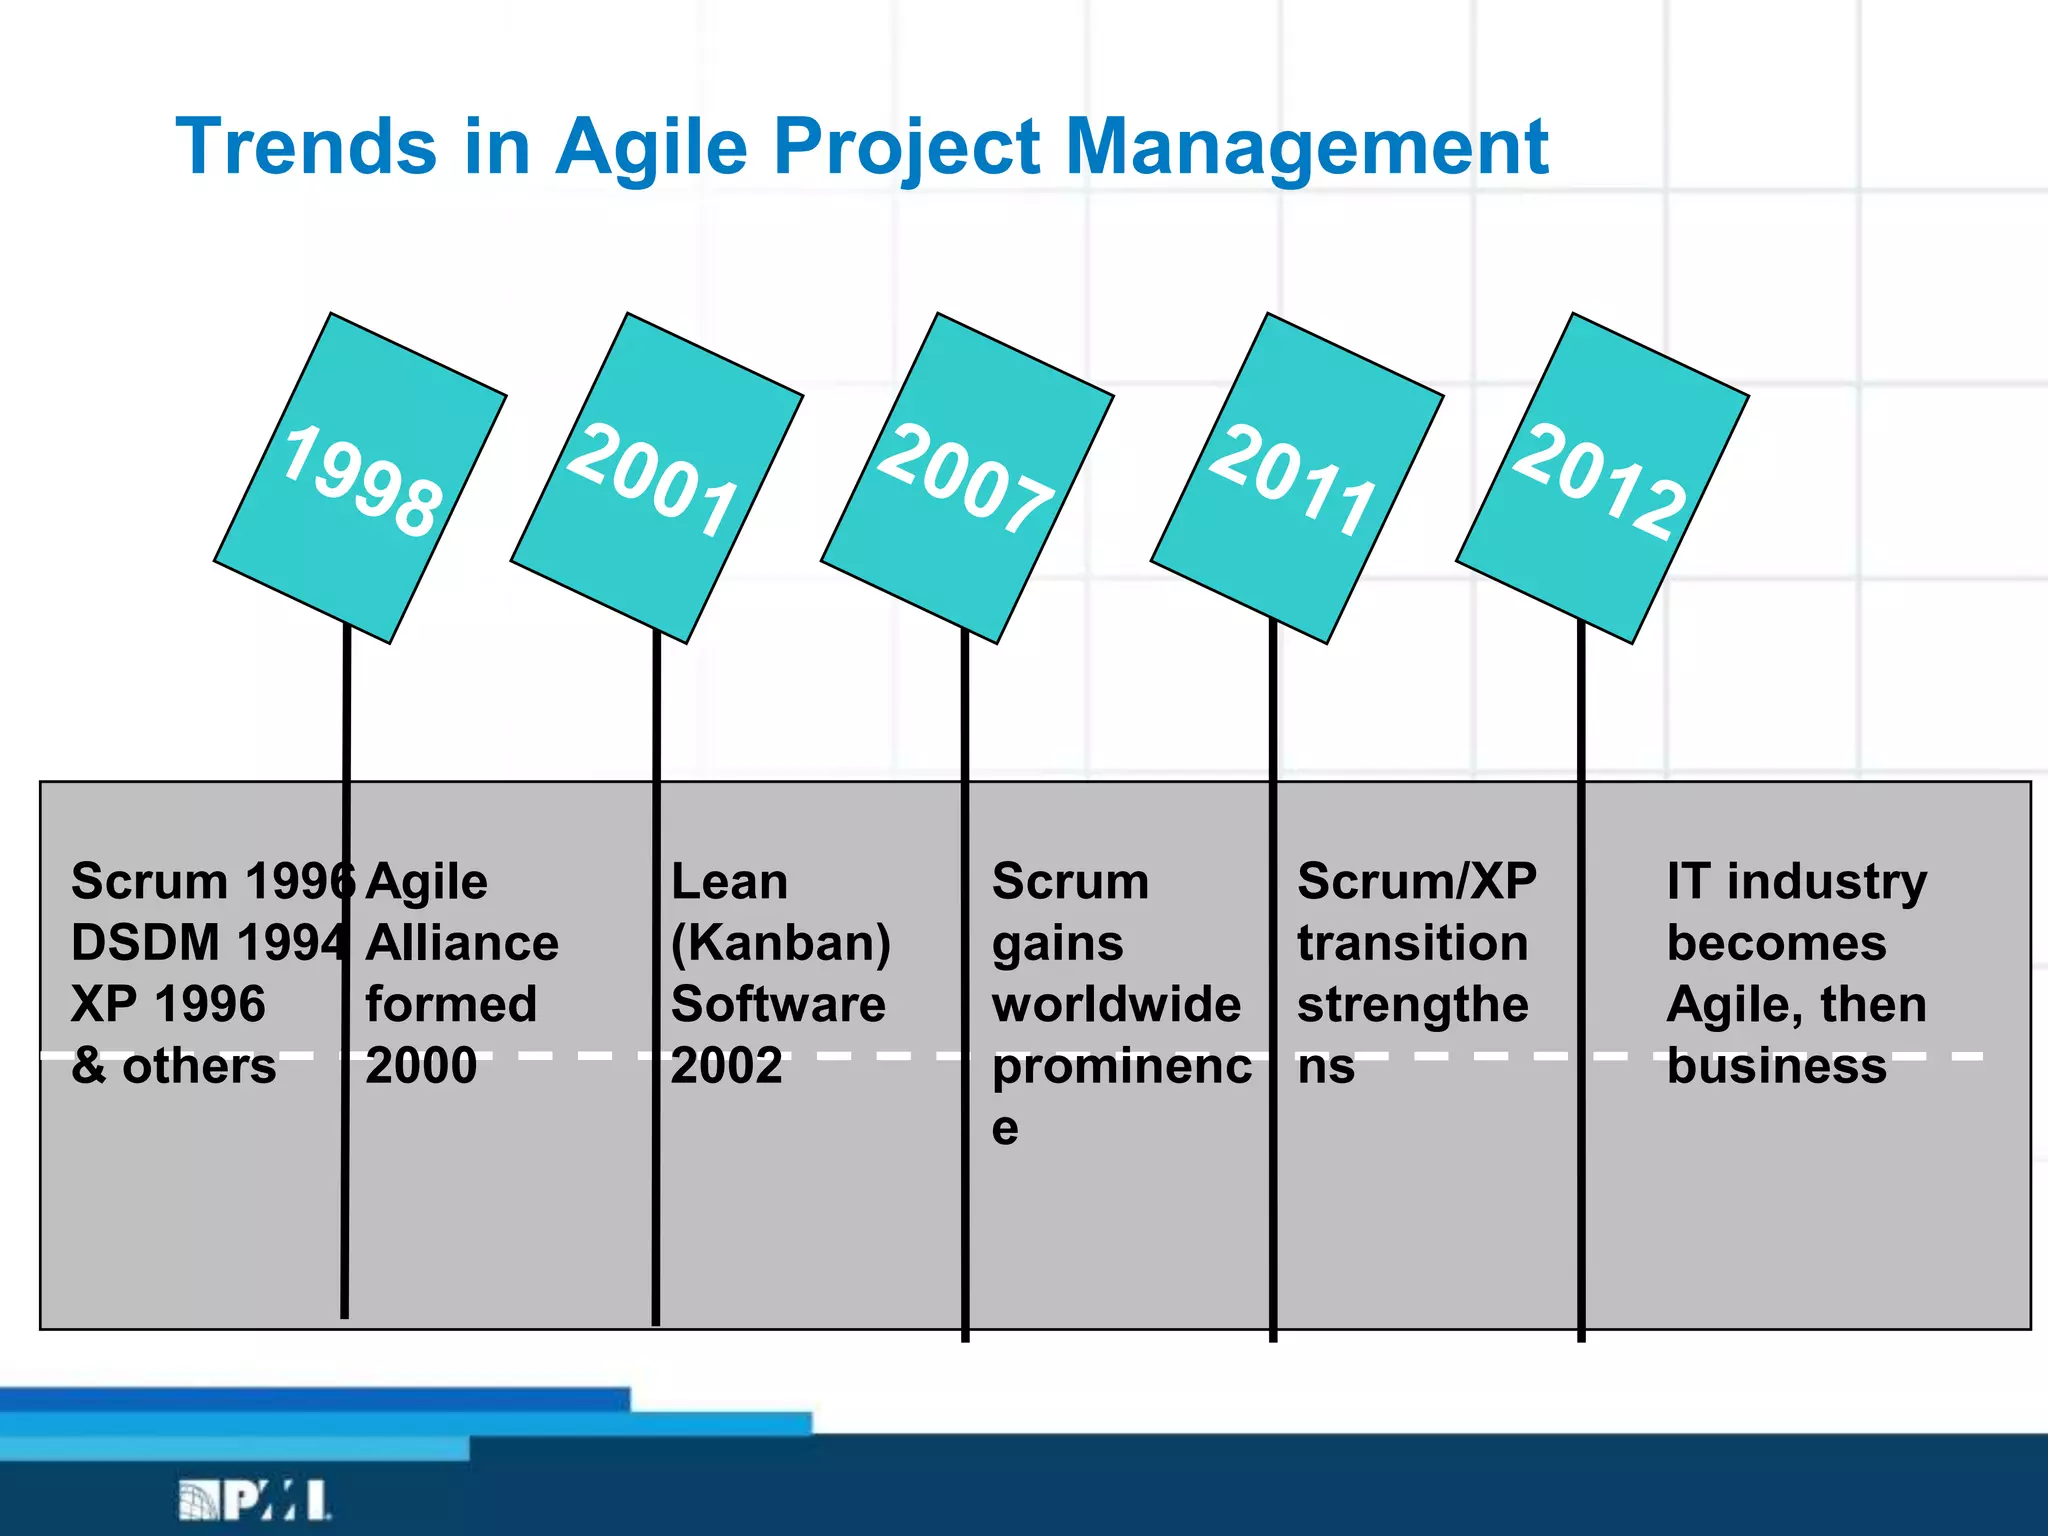
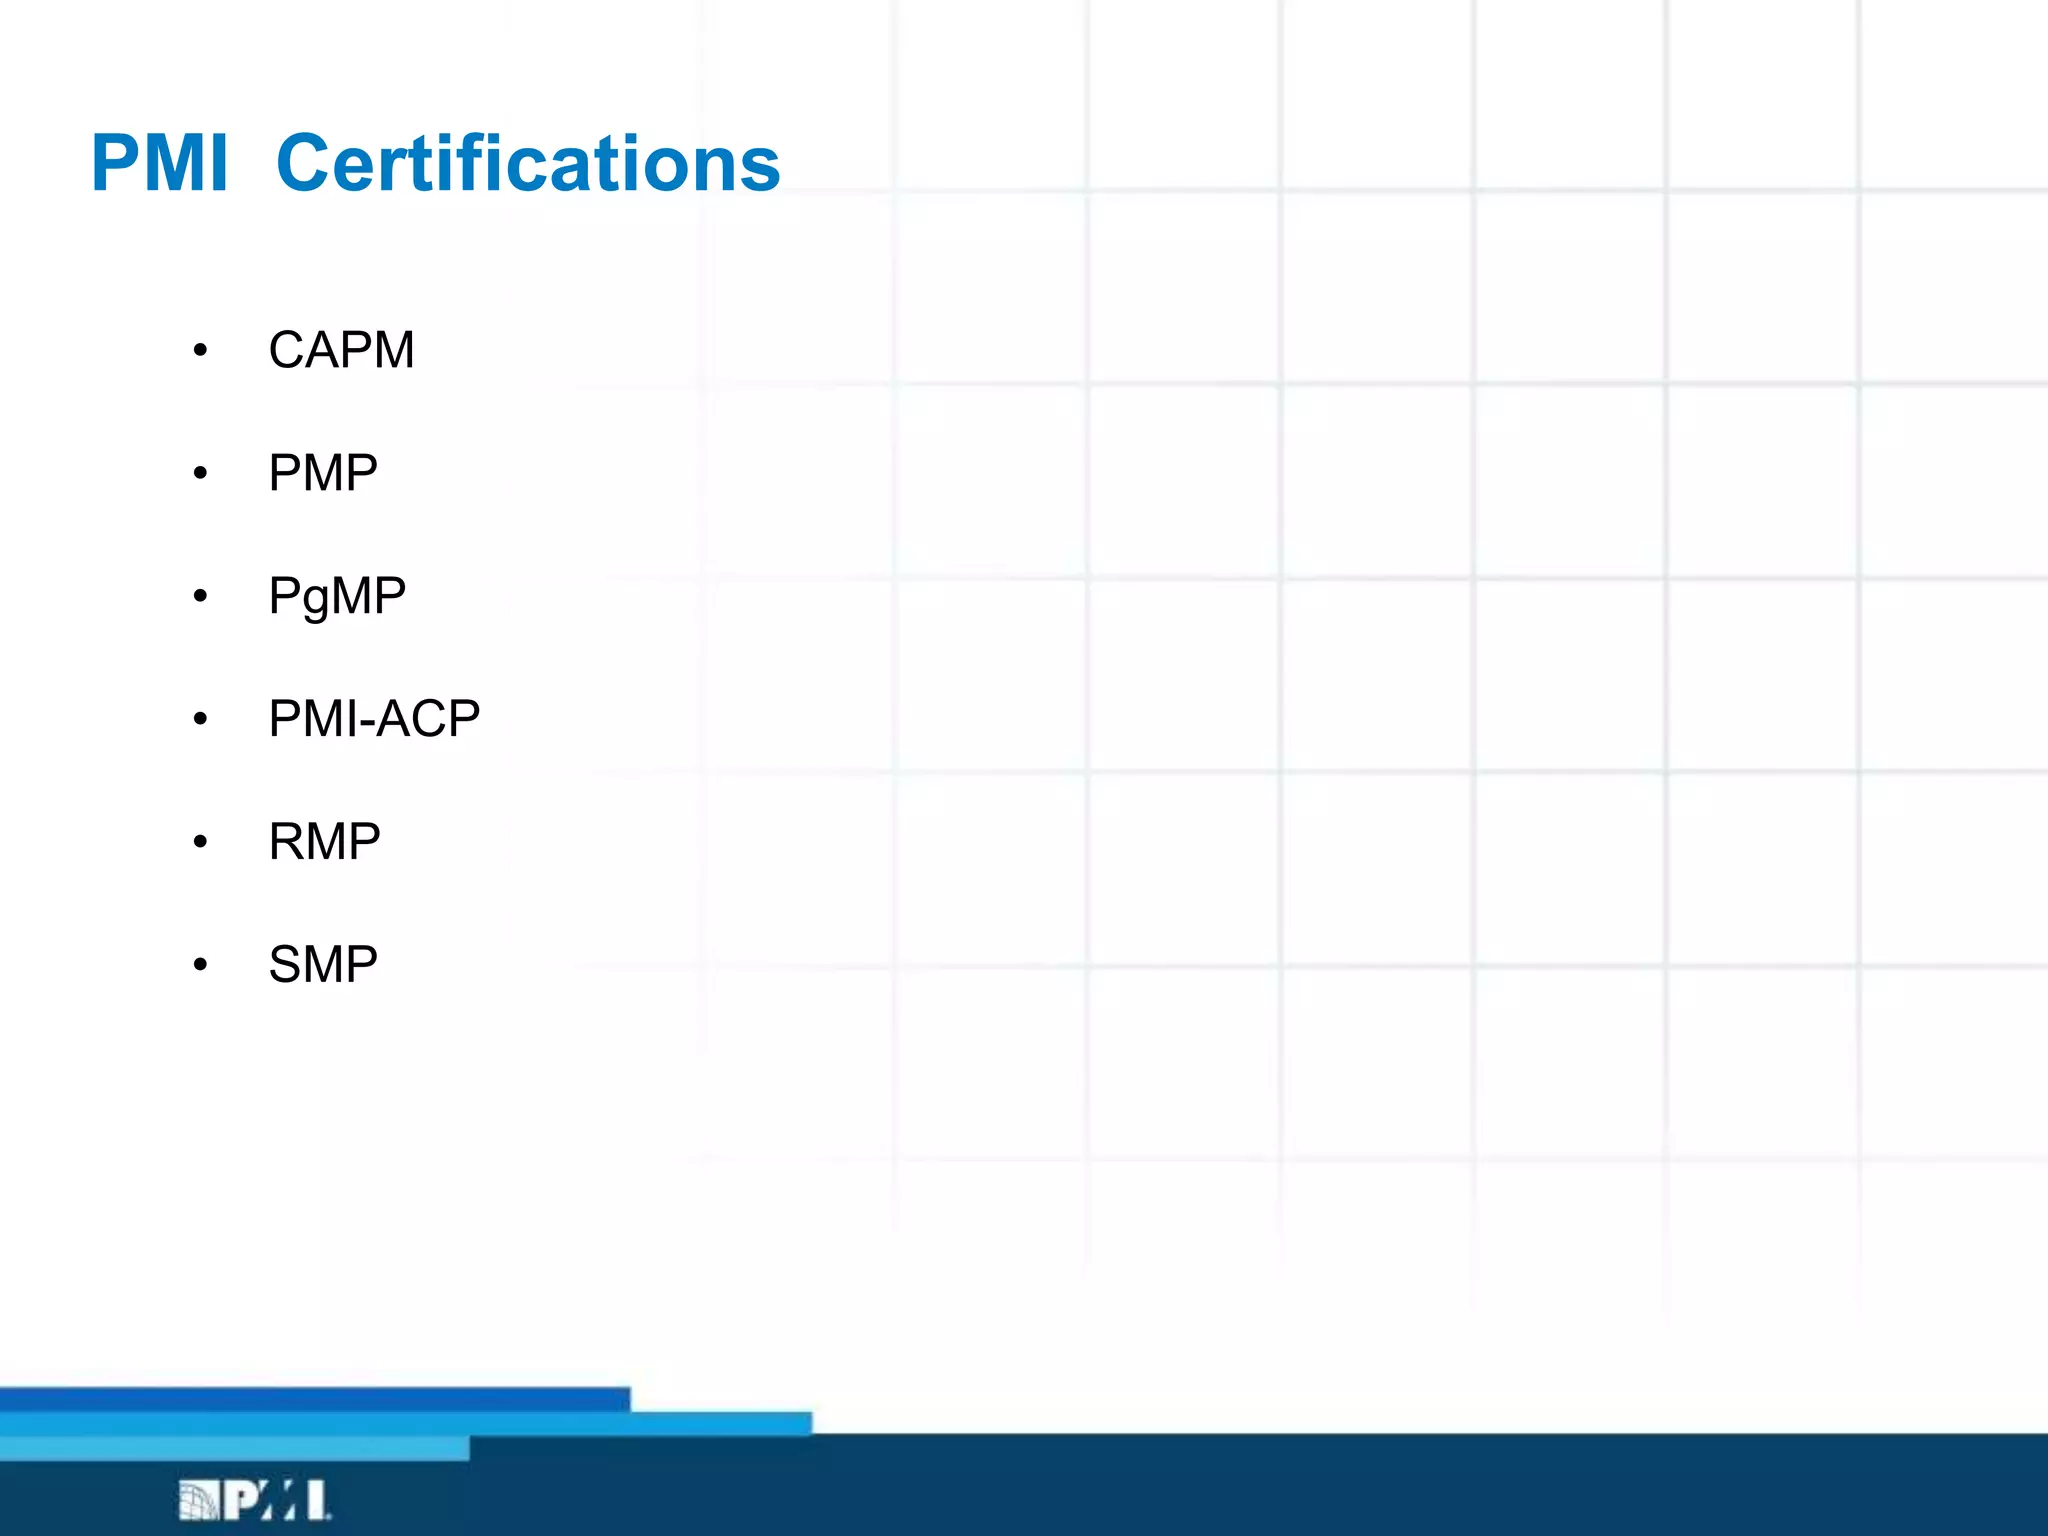
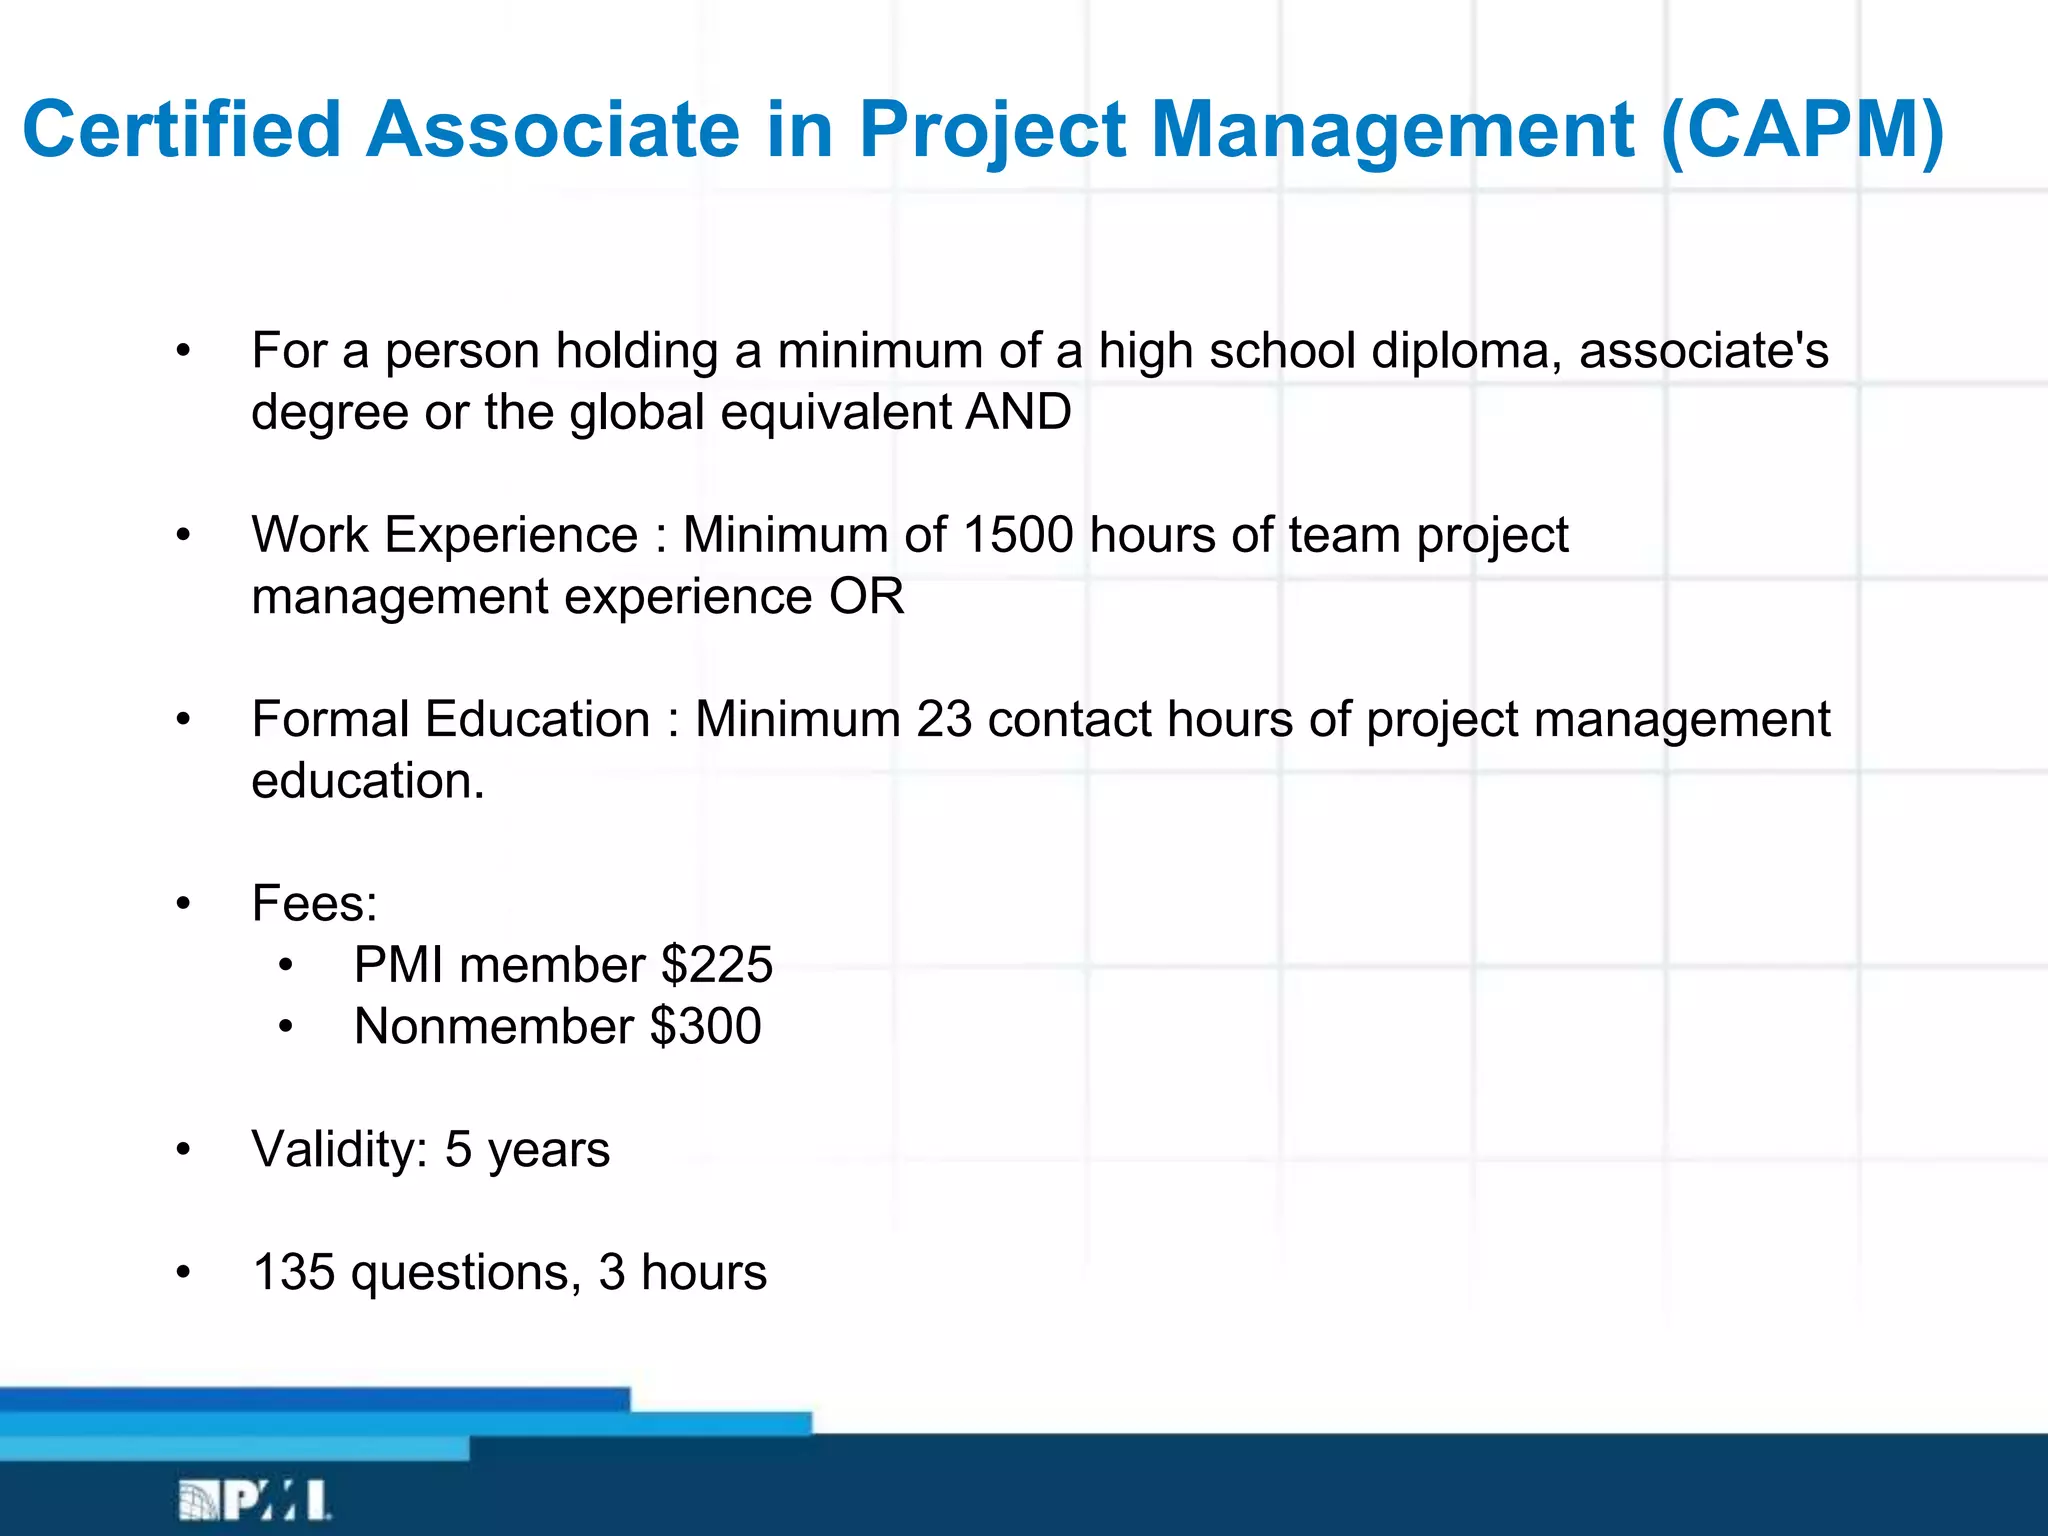

This document provides an overview of project management frameworks and concepts. It discusses the growing demand for project management skills and the project management body of knowledge. It also summarizes key project management processes including initiation, planning, execution, monitoring/controlling, and closing. Tools for planning, scheduling, and tracking projects are presented such as the work breakdown structure, Gantt charts, PERT charts, and critical path method. Trends in agile project management and certifications from the Project Management Institute are also highlighted.


![Seller Deck - Presentation [Concert L2].PPTX](https://cdn.slidesharecdn.com/ss_thumbnails/sellerdeck-presentationconcertl2-251219171156-24982daf-thumbnail.jpg?width=640&height=640&fit=bounds)


