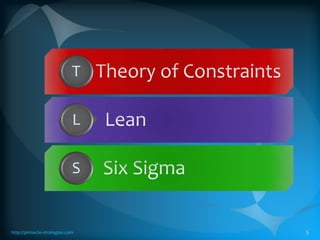
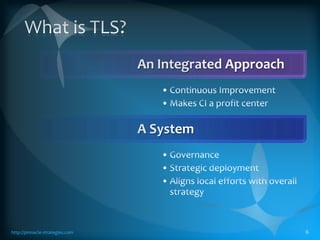
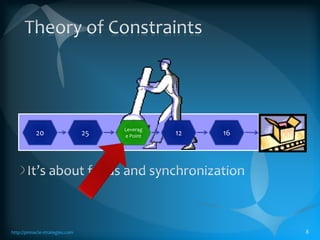
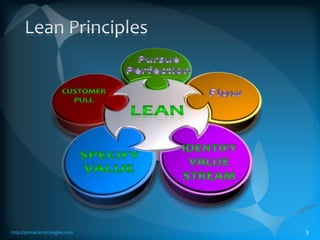
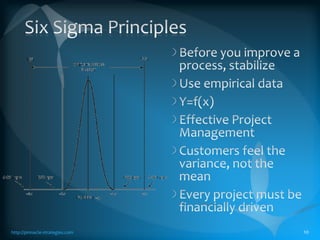
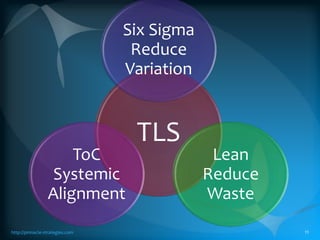
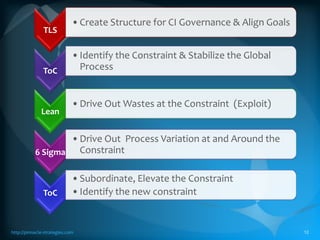
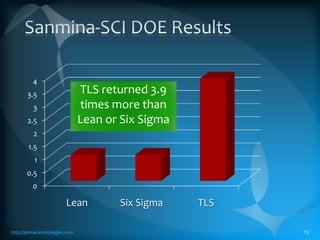
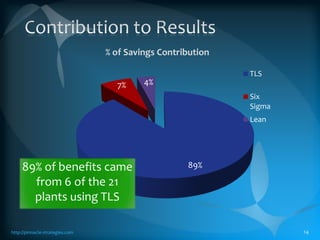
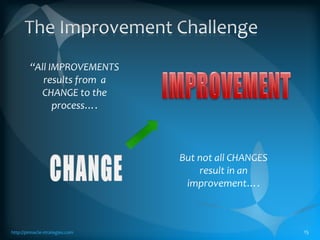
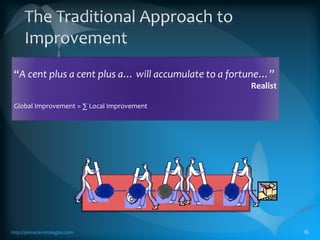
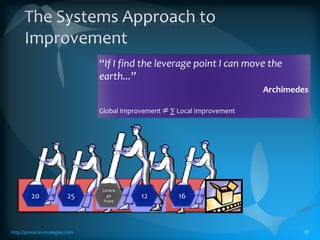
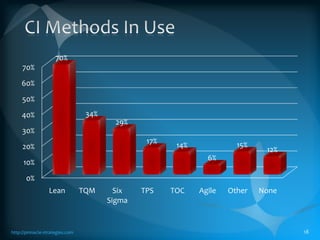
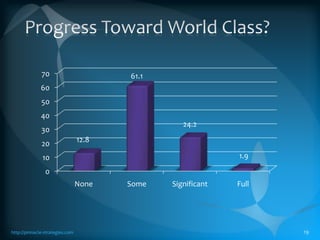
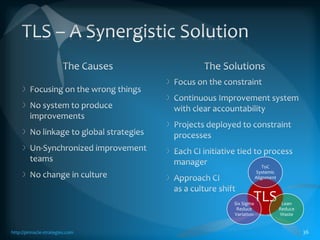
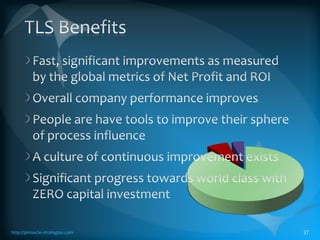
TLS – Integrating Tools for Big ResultsMark Woeppel, Pinnacle Strategieshttp://pinnacle-strategies.comhttp://pinnacle-strategies.com1
http://pinnacle-strategies.com2
http://pinnacle-strategies.com3“Brilliant process management is our strategy. We get brilliant results from average people managing brilliant processes. We observe that our competitors often get average (or worse) results from brilliant people managing broken processes.”
http://pinnacle-strategies.com4
http://pinnacle-strategies.com5
What is TLS?http://pinnacle-strategies.com6
TLS supports different situations with specific tools for that situation.http://pinnacle-strategies.com- 7 -
Theory of Constraintshttp://pinnacle-strategies.com82025101216Leverage PointIt’s about focus and synchronization
Lean Principleshttp://pinnacle-strategies.com9Pursue PerfectionFlowCustomer PullLEANIdentify Value StreamSpecify Value
Six Sigma PrinciplesBefore you improve a process, stabilizeUse empirical data Y=f(x)Effective Project ManagementCustomers feel the variance, not the meanEvery project must be financially drivenhttp://pinnacle-strategies.com10
http://pinnacle-strategies.com11
http://pinnacle-strategies.com12
Sanmina-SCI DOE Resultshttp://pinnacle-strategies.com13TLS returned 3.9 times more than Lean or Six Sigma
Contribution to Resultshttp://pinnacle-strategies.com1489% of benefits came from 6 of the 21 plants using TLS
The Improvement Challengehttp://pinnacle-strategies.com15“All IMPROVEMENTS results from  a CHANGE to the process….IMPROVEMENTBut not all CHANGES result in an improvement….CHANGE
The Traditional Approach to Improvementhttp://pinnacle-strategies.com16“A cent plus a cent plus a… will accumulate to a fortune…”RealistGlobal Improvement = ∑ Local Improvement
The Systems Approach to Improvement http://pinnacle-strategies.com17“If I find the leverage point I can move the earth...”ArchimedesGlobal Improvement  ∑ Local Improvement2025101216Leverage Point
CI Methods In Usehttp://pinnacle-strategies.com18
Progress Toward World Class?http://pinnacle-strategies.com19
The goal is to create improvement20BCI Teams get resultsDCI Projects focus on biggest time sinksACreate systematic improvement sThe Troops
Improve the things that are important to the business.21ACreate systematic improvement sCI Teams are focused on business needsCI Projects do not focus on biggest time sinksCD’The Leadership
We have a problem!22BCI Teams get resultsDCI Projects focus on biggest time sinksACreate systematic improvement sCI Teams are focused on business needsCI Projects do not focus on biggest time sinksCD’The TroopsThe Leadership
The Existing Solution & Its Effectshttp://pinnacle-strategies.com23Many projects do not achieve resultsDifficult implementationsOverall company performance does not improveDCI Projects focus on biggest time sinksManagement does not support CI  effortsCI Projects do not focus on biggest time sinksD’Management is frustratedFocus on the large time sinks unless there is a major problemResistance to changeThe problems still existPeople are cynical about CI
What’s wrong with the conventional approach to CI?http://pinnacle-strategies.com24BCI Teams get resultsDCI Projects focus on biggest time sinksACreate systematic improvement sCI Teams are focused on business needsCI Projects do not focus on biggest time sinksCD’Time spent at every resource is a major waste
Only the projects focused on the leverage point have any return.http://pinnacle-strategies.com252025101216Leverage Point
The Biggest Obstacle to CI  Program Success?http://pinnacle-strategies.com26
Malcolm Baldrige Research ResultsIs there a causal link between the Baldrige Criteria and actual performance of firms? Leadership is the most important driver of system performanceInformation and Analysis is the second most importantProcess Management is twice as important when predicting customer satisfaction as when predicting financial resultshttp://pinnacle-strategies.com27
The Reasons for Unsatisfactory Results?Projects not geared towards the bottom line (phantom cost savings)Lack of focusEmphasis on tools, not resultsLack of leadership of CI ProcessNo structure to reinforce improvements or manage improvement processAccountability for sustained improvements is not clearNo alignment  with global goals or strategyTeams are “self-directed”, not ledTLS Process Addresses the Core Problemshttp://pinnacle-strategies.com28
Tools – Create Alignmenthttp://pinnacle-strategies.com- 29 -Commissioning /  GovernanceConstraint AnalysisMeasurements AnalysisVisual Display
Tools – Stabilize The Delivery Process- 31 -LevelLoading / BalancingSDBR – PullSystemBufferManagement
Drive Waste Out of the Processhttp://pinnacle-strategies.com- 32 -Desired ResultTexas Style QFDProcess MappingOutput Process Input (OPI)Cause and Effect AnalysisProcessKPIVKPOV
Drive Variation Out of the Processhttp://pinnacle-strategies.com- 33 -?KPOVKPIVProcess Variables either as Noise or ConstantVisual Work InstructionsDesired ResultRun / SPC chartsVariable Characterization
The Path Forwardhttp://pinnacle-strategies.com34
The Path Forwardhttp://pinnacle-strategies.com35
TLS – A Synergistic Solution The CausesFocusing on the wrong thingsNo system to produce improvementsNo linkage to global strategiesUn-Synchronized improvement teamsNo change in cultureThe SolutionsFocus on the constraintContinuous Improvement system with clear accountabilityProjects deployed to constraint processesEach CI initiative tied to process managerApproach CI as a culture shifthttp://pinnacle-strategies.com36
TLS BenefitsFast, significant improvements as measured by the global metrics of Net Profit and ROIOverall company performance improvesPeople are have tools to improve their sphere of process influenceA culture of continuous improvement existsSignificant progress towards world class with ZERO capital investmenthttp://pinnacle-strategies.com37
Process Improvement closinghttp://pinnacle-strategies.com38

TLS - Integrating Tools for Big Results

  • 1.
    TLS – IntegratingTools for Big ResultsMark Woeppel, Pinnacle Strategieshttp://pinnacle-strategies.comhttp://pinnacle-strategies.com1
  • 2.
  • 3.
    http://pinnacle-strategies.com3“Brilliant process managementis our strategy. We get brilliant results from average people managing brilliant processes. We observe that our competitors often get average (or worse) results from brilliant people managing broken processes.”
  • 4.
  • 5.
  • 6.
  • 7.
    TLS supports differentsituations with specific tools for that situation.http://pinnacle-strategies.com- 7 -
  • 8.
  • 9.
  • 10.
    Six Sigma PrinciplesBeforeyou improve a process, stabilizeUse empirical data Y=f(x)Effective Project ManagementCustomers feel the variance, not the meanEvery project must be financially drivenhttp://pinnacle-strategies.com10
  • 11.
  • 12.
  • 13.
    Sanmina-SCI DOE Resultshttp://pinnacle-strategies.com13TLSreturned 3.9 times more than Lean or Six Sigma
  • 14.
    Contribution to Resultshttp://pinnacle-strategies.com1489%of benefits came from 6 of the 21 plants using TLS
  • 15.
    The Improvement Challengehttp://pinnacle-strategies.com15“AllIMPROVEMENTS results from a CHANGE to the process….IMPROVEMENTBut not all CHANGES result in an improvement….CHANGE
  • 16.
    The Traditional Approachto Improvementhttp://pinnacle-strategies.com16“A cent plus a cent plus a… will accumulate to a fortune…”RealistGlobal Improvement = ∑ Local Improvement
  • 17.
    The Systems Approachto Improvement http://pinnacle-strategies.com17“If I find the leverage point I can move the earth...”ArchimedesGlobal Improvement  ∑ Local Improvement2025101216Leverage Point
  • 18.
    CI Methods InUsehttp://pinnacle-strategies.com18
  • 19.
    Progress Toward WorldClass?http://pinnacle-strategies.com19
  • 20.
    The goal isto create improvement20BCI Teams get resultsDCI Projects focus on biggest time sinksACreate systematic improvement sThe Troops
  • 21.
    Improve the thingsthat are important to the business.21ACreate systematic improvement sCI Teams are focused on business needsCI Projects do not focus on biggest time sinksCD’The Leadership
  • 22.
    We have aproblem!22BCI Teams get resultsDCI Projects focus on biggest time sinksACreate systematic improvement sCI Teams are focused on business needsCI Projects do not focus on biggest time sinksCD’The TroopsThe Leadership
  • 23.
    The Existing Solution& Its Effectshttp://pinnacle-strategies.com23Many projects do not achieve resultsDifficult implementationsOverall company performance does not improveDCI Projects focus on biggest time sinksManagement does not support CI effortsCI Projects do not focus on biggest time sinksD’Management is frustratedFocus on the large time sinks unless there is a major problemResistance to changeThe problems still existPeople are cynical about CI
  • 24.
    What’s wrong withthe conventional approach to CI?http://pinnacle-strategies.com24BCI Teams get resultsDCI Projects focus on biggest time sinksACreate systematic improvement sCI Teams are focused on business needsCI Projects do not focus on biggest time sinksCD’Time spent at every resource is a major waste
  • 25.
    Only the projectsfocused on the leverage point have any return.http://pinnacle-strategies.com252025101216Leverage Point
  • 26.
    The Biggest Obstacleto CI Program Success?http://pinnacle-strategies.com26
  • 27.
    Malcolm Baldrige ResearchResultsIs there a causal link between the Baldrige Criteria and actual performance of firms? Leadership is the most important driver of system performanceInformation and Analysis is the second most importantProcess Management is twice as important when predicting customer satisfaction as when predicting financial resultshttp://pinnacle-strategies.com27
  • 28.
    The Reasons forUnsatisfactory Results?Projects not geared towards the bottom line (phantom cost savings)Lack of focusEmphasis on tools, not resultsLack of leadership of CI ProcessNo structure to reinforce improvements or manage improvement processAccountability for sustained improvements is not clearNo alignment with global goals or strategyTeams are “self-directed”, not ledTLS Process Addresses the Core Problemshttp://pinnacle-strategies.com28
  • 29.
    Tools – CreateAlignmenthttp://pinnacle-strategies.com- 29 -Commissioning / GovernanceConstraint AnalysisMeasurements AnalysisVisual Display
  • 31.
    Tools – StabilizeThe Delivery Process- 31 -LevelLoading / BalancingSDBR – PullSystemBufferManagement
  • 32.
    Drive Waste Outof the Processhttp://pinnacle-strategies.com- 32 -Desired ResultTexas Style QFDProcess MappingOutput Process Input (OPI)Cause and Effect AnalysisProcessKPIVKPOV
  • 33.
    Drive Variation Outof the Processhttp://pinnacle-strategies.com- 33 -?KPOVKPIVProcess Variables either as Noise or ConstantVisual Work InstructionsDesired ResultRun / SPC chartsVariable Characterization
  • 34.
  • 35.
  • 36.
    TLS – ASynergistic Solution The CausesFocusing on the wrong thingsNo system to produce improvementsNo linkage to global strategiesUn-Synchronized improvement teamsNo change in cultureThe SolutionsFocus on the constraintContinuous Improvement system with clear accountabilityProjects deployed to constraint processesEach CI initiative tied to process managerApproach CI as a culture shifthttp://pinnacle-strategies.com36
  • 37.
    TLS BenefitsFast, significantimprovements as measured by the global metrics of Net Profit and ROIOverall company performance improvesPeople are have tools to improve their sphere of process influenceA culture of continuous improvement existsSignificant progress towards world class with ZERO capital investmenthttp://pinnacle-strategies.com37
  • 38.

Editor's Notes

  • #3 Diffused arches(Intermediate)To reproduce the shape effects on this slide, do the following:On the Home tab, in theSlides group, click Layout, and then click Blank.On the Home tab, in the Drawing group, click Shapes, and then under Lines click Curve (tenth option from the left). On the slide, click three points to draw a simple curved line, double-clicking the final point to finish. Select the curved line. On the Home tab, in the Drawing group, click the arrow next to Shape Fill, point to Gradient, and then click More Gradients. In the Format Shape dialog box, click Fill in the left pane, select Gradient fill in the Fill pane, and then do the following:In the Type list, select Linear.Click the button next to Direction, and then click Linear Down (first row, second option from the left).Under Gradient stops, click Add or Remove until two stops appear in the drop-down list.Also under Gradient stops, customize the gradient stops that you added as follows:Select Stop 1 from the list, and then do the following:In the Stop position box, enter 0%.Click the button next to Color, and then underTheme Colorsclick White, Background 1 (first row, first option from the left). In the Transparency box, enter 50%.Select Stop 2 from the list, and then do the following: In the Stop position box, enter 100%.Click the button next to Color, and then underTheme Colorsclick White, Background 1 (first row, first option from the left). In the Transparency box, enter 100%.On the Home tab, in the Drawing group, click Shape Effects, point to Soft Edges, and then click 5 point. On the Home tab, in the Drawing group, click the arrow next to Shape Outline, and then click No Outline. To reproduce the background effects on this slide, do the following:Right-click the slide background area, and then click Format Background. In the Format Background dialog box, click Fill in the left pane, select Gradient fill in the right pane, and then do the following:In the Type list, select Radial.Click the button next to Direction, and then click From Center (third option from the left). Under Gradient stops, click Add or Remove until two stops appear in the drop-down list.Also under Gradient stops, customize the gradient stops that you added as follows:Select Stop 1 from the list, and then do the following:In the Stop position box, enter 0%.Click the button next to Color, and then under Theme Colors click White, Background 1 (first row, first option from the left).Select Stop 2 from the list, and then do the following: In the Stop position box, enter 100%.Click the button next to Color, and then under Theme Colors click White, Background 1, Darker 50% (sixth row, first option from the left).To reproduce the duplicate curved lines on the slide, do the following:On the Home tab, in the Clipboard group, click the arrow under Paste, and then click Duplicate. Repeat the process for a total of three curved lines. On the slide, drag the curved lines to position them as needed. Right-click one of the duplicate curved lines, click Edit Points, and then drag the points on the curve to make a new shape. Repeat the process with the other duplicate curved line.
  • #5 Every outcome is the result of a process. Want to change the outcomes? You must change the process.
  • #6 What is TLS?
  • #10 Specify Value from view of the customerImprove the process that creates ValueIdentify the value streamEliminate waste from that streamMake the process Flow smoothlyAllow the customers to pull valuePursue perfection
  • #14 Methodology was assigned due to the local preference, experience with a particular methodology and expertiseData gathered (Time-years): 2.5 Participating plants: 21 11 Six Sigma 4 Lean6 TLSTeam leaders trained: 211Projects completed by all methods: 101− Each site chose their projects and coached with local experts− Plant size, population, financial standing were mixed
  • #16 What is your “hit-rate” EXPECTATION for making “Change = Improvement”?What is your CURRENT REALITY for making “Change=Improvement”?Is there a GAP between YOUR Expectation and Current Reality?Could it be that there is a simple LAW that governs whether a CHANGE=IMPROVEMENT for the System as a whole?
  • #17 What is the chance of change = improvement in the traditional approach?
  • #18 What should our expectation be of change = improvement in the systems approach?
  • #19 Industry Week Survey 2007
  • #27 As cited by LEI in 2007 Survey of lean implementers. Note that unrealized financial value ranks very low in obstacles, indicating the practitioners themselves do not understand the source of the resistance. Moreover, this demonstrates a disconnect between the practitioners and management; emphasizing tool adoption over results achievement.
  • #28 An Empirical Investigation of the Malcolm Baldrige National Quality Award Causal ModelDarryl D. Wilson David A. Collier Sam Walton College of Business AdministrationThe objective of this research is to test the theory and causal performance linkages implied by the Malcolm Baldrige National Quality Award (MBNQA). The survey instrument used a comprehensive set of 101 questions that were directly tied to specific criteria in the 1995 MBNQA Criteria. Results reported here represent the first published article that tests the MBNQA performance relationships and causal model using comprehensive measurement and structural models.
  • #32 Create Alignment with the GoalIdentify the constraintAlign the measurement systemProject deployment around the constraintPrevent local optimization conflictsIdentify movement of the constraintStabilize the global process with strategic buffers & SDBR