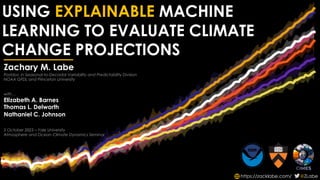
Using explainable machine learning to evaluate climate change projections
•
0 likes•55 views

5 October 2023… Atmosphere and Ocean Climate Dynamics Seminar (Presentation): Using explainable machine learning to evaluate climate change projections, Yale University, New Haven, CT. Remote Presentation. References... Labe, Z.M., E.A. Barnes, and J.W. Hurrell (2023). Identifying the regional emergence of climate patterns in the ARISE-SAI-1.5 simulations. Environmental Research Letters, DOI:10.1088/1748-9326/acc81a, https://iopscience.iop.org/article/10.1088/1748-9326/acc81a

Recommended
Recommended
More Related Content
Similar to Using explainable machine learning to evaluate climate change projections
Similar to Using explainable machine learning to evaluate climate change projections (20)
More from Zachary Labe
More from Zachary Labe (20)
Recently uploaded
Recently uploaded (20)
Using explainable machine learning to evaluate climate change projections
- 1. USING EXPLAINABLE MACHINE LEARNING TO EVALUATE CLIMATE CHANGE PROJECTIONS https://zacklabe.com/ @ZLabe Zachary M. Labe Postdoc in Seasonal-to-Decadal Variability and Predictability Division NOAA GFDL and Princeton University with… Elizabeth A. Barnes Thomas L. Delworth Nathaniel C. Johnson 5 October 2023 – Yale University Atmosphere and Ocean Climate Dynamics Seminar
- 2. 1) Where do we go from here?
- 3. 1) Where do we go from here? 2) How do we disentangle internal climate variability? Feb/Mar 2016
- 4. 3) How do we account for regional patterns of change?
- 5. Explainable machine learning can distinguish between regional patterns of time-evolving climate change SIGNIFICANCE
- 6. Machine Learning is not new! “A Bayesian Neural Network for Severe-Hail Prediction (2000)” “Classification of Convective Areas Using Decision Trees (2009)” “A Neural Network for Damaging Wind Prediction (1998)” “Generative Additive Models versus Linear Regression in Generating Probabilistic MOS Forecasts of Aviation Weather Parameters (1995)” ”A Neural Network for Tornado Prediction Based on Doppler Radar-Derived Attributes (1996)” ”The Diagnosis of Upper-Level Humidity (1968)”
- 7. “An adaptive data processing system for weather forecasting” It’s a neural network! [Hu and Root (1964), APME]
- 8. Artificial Intelligence Machine Learning Deep Learning Computer/Data Science
- 9. Computer/Data Science Supervised Learning Unsupervised Learning Labeled data Classification Regression Unlabeled data Clustering Dimension reduction Artificial Intelligence Machine Learning Deep Learning DATA-HUNGRY!
- 10. Do it better e.g., parameterizations in climate models are not perfect, use ML to make them more accurate Do it faster e.g., code in climate models is very slow (but we know the right answer) - use ML methods to speed things up Do something new • e.g., go looking for non-linear relationships you didn’t know were there WHY ELSE SHOULD WE CONSIDER MACHINE LEARNING?
- 11. Do it better e.g., parameterizations in climate models are not perfect, use ML to make them more accurate Do it faster e.g., code in climate models is very slow (but we know the right answer) - use ML methods to speed things up Do something new • e.g., go looking for non-linear relationships you didn’t know were there Very relevant for research: may be slower and worse, but can still learn something WHY ELSE SHOULD WE CONSIDER MACHINE LEARNING?
- 12. Machine learning for meteorology IDENTIFYING SEVERE THUNDERSTORMS Molina et al. 2021 Martin et al. 2022 CLASSIFYING PHASE OF MADDEN-JULLIAN OSCILLATION DETECTING CONVECTION FROM SATELLITES Lee et al. 2021 LOCATING COLD FRONTS Dagon et al. 2022
- 13. Machine learning for oceanography CLASSIFYING ARCTIC OCEAN ACIDIFICATION Krasting et al. 2022 LARGE-SCALE OCEAN CIRCULATION Clare et al. 2022 ESTIMATING OCEAN SURFACE CURRENTS Sinha and Abernathey, 2021
- 14. Machine learning for climate PHYSICAL DRIVERS OF ENSO DYNAMICS Shin et al. 2022 IDENTIFYING DECADAL STATE DEPENDENCE Gordon and Barnes, 2022 INTERNAL/EXTERNAL CLIMATE FORCING Po-Chedley et al. 2022
- 18. Artificial Intelligence Machine Learning Deep Learning Artificial Neural Networks Computer/Data Science
- 19. X1 X2 INPUTS Artificial Neural Networks [ANN]
- 20. Linear regression! Artificial Neural Networks [ANN] X1 X2 W1 W2 ∑ = X1W1+ X2W2 + b INPUTS NODE
- 21. Artificial Neural Networks [ANN] X1 X2 W1 W2 ∑ INPUTS NODE Linear regression with non-linear mapping by an “activation function” Training of the network is merely determining the weights “w” and bias/offset “b" = factivation(X1W1+ X2W2 + b)
- 22. Artificial Neural Networks [ANN] X1 X2 W1 W2 ∑ INPUTS NODE = factivation(X1W1+ X2W2 + b) ReLU Sigmoid Linear
- 23. X1 X2 ∑ inputs HIDDEN LAYERS X3 ∑ ∑ ∑ OUTPUT = predictions Artificial Neural Networks [ANN] : : :: INPUTS
- 24. Complexity and nonlinearities of the ANN allow it to learn many different pathways of predictable behavior Once trained, you have an array of weights and biases which can be used for prediction on new data INPUT [DATA] PREDICTION Artificial Neural Networks [ANN]
- 25. What is the annual mean temperature of Earth?
- 26. THE REAL WORLD (Observations) What is the annual mean temperature of Earth? Data from Berkeley Earth Surface Temperature 1930 2022
- 27. What is the annual mean temperature of Earth? THE REAL WORLD (Observations) Let’s run a climate model One ensemble member 2022 1930 2050 Data from SPEAR_M ED
- 28. What is the annual mean temperature of Earth? THE REAL WORLD (Observations) Let’s run a climate model again! Two ensemble members Data from SPEAR_M ED
- 29. What is the annual mean temperature of Earth? THE REAL WORLD (Observations) Let’s run a climate model again & again! Three ensemble members Data from SPEAR_M ED
- 30. What is the annual mean temperature of Earth? THE REAL WORLD (Observations) CLIMATE MODEL LARGE ENSEMBLE 30 ensemble members in GFDL SPEAR
- 31. What is the annual mean temperature of Earth? THE REAL WORLD (Observations) CLIMATE MODEL LARGE ENSEMBLE NOAA GFDL – SPEAR_MED Fully-Coupled (AM4/LM4/MOM6/SIS2) Historical + SSP5-8.5 0.5° land/atmosphere, 1.0° ocean also: LO, HI, HI_25 resolutions https://www.gfdl.noaa.gov/spear/ 30 ensemble members in GFDL SPEAR
- 32. What is the annual mean temperature of Earth? Mean of ensembles = forced response (climate change) THE REAL WORLD (Observations) CLIMATE MODEL LARGE ENSEMBLE 30 ensemble members In GFDL SPEAR
- 33. What is the annual mean temperature of Earth? Mean of ensembles = forced response (climate change) THE REAL WORLD (Observations) CLIMATE MODEL LARGE ENSEMBLE 30 ensemble members In GFDL SPEAR Range of ensembles = internal variability (noise) Mean of ensembles = forced response (climate change)
- 34. But let’s remove climate change… Climate Change Signal (ensemble mean) Observations Ensemble Members
- 35. Ensemble Members Mean of anomalies After removing the forced response… = anomalies/noise!
- 36. Ensemble members in GFDL SPEAR Maps of a given time period for each ensemble Inputs for machine learning
- 37. Ensemble members in GFDL SPEAR Training Data: 24 ensemble members Maps of a given time period for each ensemble
- 38. Training Data: 24 ensemble members Validation Data: 4 ensemble members
- 39. Training Data: 24 ensemble members Validation Data: 4 ensemble members Testing Data: 2 ensemble members
- 40. Historical Forcing – GFDL SPEAR Future Scenarios – GFDL SPEAR Can a neural network learn unique patterns of climate change related to each future emission scenario? 1930 2010 2020 2100
- 41. Train a neural network to predict 5 classes (climate scenarios)
- 42. Yearly Maps of T2M Yearly Maps of T2M Neural Network Classify Climate Scenario Artificial Neural Network Output = 5 Classes Yearly Maps of T2M Neural Network Binary Output Binary Output Step #1 Read in gridded maps of a climate variable from SPEAR simulations
- 43. Yearly Maps of T2M Yearly Maps of T2M Neural Network Classify Climate Scenario Artificial Neural Network Output = 5 Classes Yearly Maps of T2M Neural Network Binary Output Binary Output Step #2 Feed data into an artificial neural network with three hidden layers
- 44. Yearly Maps of T2M Yearly Maps of T2M Neural Network Classify Climate Scenario Artificial Neural Network Output = 5 Classes Yearly Maps of T2M Neural Network Binary Output Binary Output Step #3 Classify which climate scenario (n=5) is associated with each map
- 45. Yearly Maps of T2M Yearly Maps of T2M Neural Network Classify Climate Scenario Artificial Neural Network Output = 5 Classes Yearly Maps of T2M Neural Network Binary Output Binary Output Step #4 Why? à XAI
- 46. WHY LAYER-WISE RELEVANCE PROPAGATION (LRP) Volcano Timber Wolf Image Classification LRP LRP heatmaps show regions of “relevance” that contribute to the neural network’s decision-making process for a sample belonging to a particular output category Neural Network WHY Backpropagation – LRP https://heatmapping.org/
- 47. WHY LAYER-WISE RELEVANCE PROPAGATION (LRP) Volcano Timber Wolf Image Classification LRP LRP heatmaps show regions of “relevance” that contribute to the neural network’s decision-making process for a sample belonging to a particular output category Neural Network WHY Backpropagation – LRP https://heatmapping.org/
- 48. Image Classification LRP https://heatmapping.org/ NOT PERFECT Crock Pot Neural Network Backpropagation – LRP WHY LAYER-WISE RELEVANCE PROPAGATION (LRP)
- 49. EXPLAINABLE AI (XAI) THERE ARE MANY METHODS A bird! XAI [Adapted from Adebayo et al., 2020]
- 50. THERE ARE MANY METHODS EXPLAINABLE AI (XAI) [Adapted from Adebayo et al., 2020]
- 51. Visualizing something we already know… ENSO
- 52. Neural Network [0] La Niña [1] El Niño Input a map of sea surface temperatures [Toms et al. 2020, JAMES]
- 53. Visualizing something we already know… Input maps of sea surface temperatures (SST) to identify El Niño or La Niña Use ‘LRP’ to see how the neural network is making its decision [Toms et al. 2020, JAMES] Layer-wise Relevance Propagation Composite SST Observations LRP [Relevance] SST Anomaly [°C] 0.00 0.75 0.0 1.5 -1.5 Warmer Colder High Low
- 54. Returning to our application…
- 55. Predictions for SPEAR_MED Testing Data Accuracy=92% Nearer to predicted class Further from predicted class
- 56. Predictions for SPEAR_MED Testing Data Accuracy=92% Nearer to predicted class Further from predicted class
- 57. Global Mean Surface Temperature Can we identify changes in future climate impacts after rapid mitigation?
- 58. 30 ensembles for GFDL SPEAR_MED 9 ensembles for GFDL SPEAR_MED Input maps from out-of-sample ensembles into classification network 2020 2030 2100
- 59. 2031 2040 Rapid Mitigation Rapid Mitigation 30 ensembles for GFDL SPEAR_MED 9 ensembles for GFDL SPEAR_MED
- 60. Predictions for the ensemble mean from SSP5-3.4OS SSP5-8.5 SSP2-4.5 2015 2055 2065 2095
- 61. Predictions for the ensemble mean from SSP5-3.4OS SSP5-8.5 SSP2-4.5 2055-2060 rapid mitigation begins 2015 2095
- 62. Are these predictions robust across ensemble members? (n=30) SSP5-3.4OS Transition from SSP5-8.5 to SSP2-4.5 2015 2060 2100
- 63. What if we start mitigation 10 years earlier? Transition from SSP5-8.5 to SSP2-4.5 Transition from SSP5-8.5 to SSP2-4.5 Transition from SSP2-4.5 to SSP1-1.9 2015 2060 2100 2015 2060 2100
- 64. What climate patterns are associated with these transitions? Transition from SSP5-8.5 to SSP2-4.5 Transition from SSP5-8.5 to SSP2-4.5 Transition from SSP2-4.5 to SSP1-1.9 Rapid mitigation Rapid mitigation
- 65. Difficult to distinguish the patterns associated with each scenario Composites of relevance maps for the mitigation predictions SSP5-3.4OS example for 2015 to 2100 Nearer to predicted scenario Further from predicted scenario
- 66. Yearly Maps of T2M Yearly Maps of T2M Neural Network Classify Climate Scenario Artificial Neural Network Output = 5 Classes Yearly Maps of T2M Neural Network Binary Output Binary Output Steps #5-6
- 67. XAI composites of years associated with the transition from SSP5-8.5 to SSP2-4.5 (a) approx. 2055-2060 (b) approx. 2040-2045
- 68. North Atlantic is an important indictor region for climate signals related to identifying from SSP5-8.5 to SSP2-4.5 Future Climate Change Rapid Mitigation
- 69. Framework can be applied to different geographic regions and climate variables Parallel approach for detecting climate intervention scenarios Labe, Z.M., E.A. Barnes, and J.W. Hurrell (2023). Identifying the regional emergence of climate patterns in the ARISE-SAI-1.5 simulations. EarthArXiv, DOI: 10.31223/X5394Z
- 70. Framework can be applied to different geographic regions and climate variables Parallel approach for detecting climate intervention scenarios Labe, Z.M., E.A. Barnes, and J.W. Hurrell (2023). Identifying the regional emergence of climate patterns in the ARISE-SAI-1.5 simulations. Environmental Research Letters, DOI:10.1088/1748- 9326/acc81a
- 73. Could we detect whether we were under the influence of stratospheric aerosol injection (SAI) using regional climate patterns?
- 74. Assessing Responses and Impacts of Solar climate intervention on the Earth system with Stratospheric Aerosol Injection ARISE-SAI-1.5 (10 ensemble members each) CESM2(WACCM6) for historical + SSP2-4.5 CESM2(WACCM6) for historical + SAI-1.5
- 77. LET’S TRY ANOMALIES YEAR 2045
- 80. PROJECTIONS OF TEMPERATURE [Labe et al. 2023, ERL]
- 81. PROJECTIONS OF PRECIPITATION [Labe et al. 2023, ERL]
- 82. CAN WE DETECT A SAI WORLD? LOGISTIC REGRESSION [Labe et al. 2023, ERL]
- 83. CLIMATOLOGICAL MAPS OF ARISE-SAI-1.5 IN 2050-2069 MEAN STATE [Labe et al. 2023, ERL]
- 84. DECADAL TRENDS TEMPERATURE [Labe et al. 2023, ERL]
- 85. DECADAL TRENDS TEMPERATURE [Labe et al. 2023, ERL]
- 86. DECADAL TRENDS PRECIPITATION [Labe et al. 2023, ERL]
- 87. DECADAL TRENDS PRECIPITATION [Labe et al. 2023, ERL]
- 88. N Y HIDDEN LAYERS INPUT LAYER INPUT LAYER SAI WORLD? or or map of near-surface temperature map of near-surface temperature map of total precipitation map of total precipitation Years Since SAI Injection OUTPUT LOGISTIC REGRESSION ARTIFICAL NEURAL NETWORK softmax [Labe et al. 2023, ERL]
- 89. N Y HIDDEN LAYERS INPUT LAYER INPUT LAYER SAI WORLD? or or map of near-surface temperature map of near-surface temperature map of total precipitation map of total precipitation Years Since SAI Injection OUTPUT LOGISTIC REGRESSION ARTIFICAL NEURAL NETWORK softmax [Labe et al. 2023, ERL]
- 90. CAN WE DETECT A SAI WORLD? [Labe et al. 2023, ERL]
- 91. [Labe et al. 2023, ERL]
- 92. [Labe et al. 2023, ERL]
- 93. Central Africa [Labe et al. 2023, ERL]
- 94. HOW DID THE ML MODEL KNOW? [Labe et al. 2023, ERL]
- 95. …Using regional climate patterns! [Labe et al. 2023, ERL]
- 96. CAN WE DETECT A SAI WORLD? [Labe et al. 2023, ERL]
- 97. N Y HIDDEN LAYERS INPUT LAYER INPUT LAYER SAI WORLD? or or map of near-surface temperature map of near-surface temperature map of total precipitation map of total precipitation Years Since SAI Injection OUTPUT LOGISTIC REGRESSION ARTIFICAL NEURAL NETWORK softmax [Labe et al. 2023, ERL]
- 98. TEMPERATURE [Labe et al. 2023, ERL]
- 99. INPUT [DATA] PREDICTION Machine Learning Explainable (or interpretable) AI Learn new climate science!
- 100. TAKEAWAYS 1. XAI can identify regional patterns of climate change and variability in large ensembles. 2. Method can identify differences in time-evolving forced climate signals between other climate model large ensembles. 3. Framework can be adapted for monitoring and predicting patterns of climate change in observations. Zack Labe zachary.labe@noaa.gov 5 October 2023 Atmosphere and Ocean Climate Dynamics Seminar – Yale University