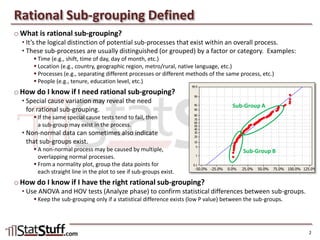
SlideShare a Scribd company logo
1 of 3
Section & Lesson #:
Pre-Requisite Lessons:
Complex Tools + Clear Teaching = Powerful Results
Rational Sub-Grouping
Six Sigma-Measure – Lesson 18
A review of how we sub-divide data for analysis using rational sub-
grouping.
Six Sigma-Measure #17 – Variation Over Time (Short/Long Term
Data)
Copyright © 2011-2019 by Matthew J. Hansen. All Rights Reserved. No part of this publication may be reproduced, stored in a retrieval system, or transmitted by any means
(electronic, mechanical, photographic, photocopying, recording or otherwise) without prior permission in writing by the author and/or publisher.
o What is rational sub-grouping?
• It’s the logical distinction of potential sub-processes that exist within an overall process.
• These sub-processes are usually distinguished (or grouped) by a factor or category. Examples:
 Time (e.g., shift, time of day, day of month, etc.)
 Location (e.g., country, geographic region, metro/rural, native language, etc.)
 Processes (e.g., separating different processes or different methods of the same process, etc.)
 People (e.g., tenure, education level, etc.)
o How do I know if I need rational sub-grouping?
• Special cause variation may reveal the need
for rational sub-grouping.
 If the same special cause tests tend to fail, then
a sub-group may exist in the process.
• Non-normal data can sometimes also indicate
that sub-groups exist.
 A non-normal process may be caused by multiple,
overlapping normal processes.
 From a normality plot, group the data points for
each straight line in the plot to see if sub-groups exist.
o How do I know if I have the right rational sub-grouping?
• Use ANOVA and HOV tests (Analyze phase) to confirm statistical differences between sub-groups.
 Keep the sub-grouping only if a statistical difference exists (low P value) between the sub-groups.
Rational Sub-grouping Defined
2
125.0%100.0%75.0%50.0%25.0%0.0%-25.0%-50.0%
99.9
99
95
90
80
70
60
50
40
30
20
10
5
1
0.1
MetricB
Percent
M
S
N
A
P
Probability Plot of MetricB
Normal
Sub-Group A
Sub-Group B
Practical Application
o Identify at least 3 metrics used by your organization that are continuous values.
• For each metric, identify at least 3 types of sub-groups currently used for reporting.
• What are at least 2 other types of sub-groups that are possible, but improbable?
 How can you confirm if it’s a rational sub-group that should be separately measured?
Copyright © 2011-2019 by Matthew J. Hansen. All Rights Reserved. No part of this publication may be
reproduced, stored in a retrieval system, or transmitted by any means (electronic, mechanical, photographic,
photocopying, recording or otherwise) without prior permission in writing by the author and/or publisher.
3

More Related Content

What's hot

Process Capability: Step 5 (Non-Normal Distributions)
Process Capability: Step 5 (Non-Normal Distributions)Process Capability: Step 5 (Non-Normal Distributions)
Process Capability: Step 5 (Non-Normal Distributions)Matt Hansen
 
MSA – Planning & Conducting the MSA
MSA – Planning & Conducting the MSAMSA – Planning & Conducting the MSA
MSA – Planning & Conducting the MSAMatt Hansen
 
Process Capability: Step 4 (Normal Distributions)
Process Capability: Step 4 (Normal Distributions)Process Capability: Step 4 (Normal Distributions)
Process Capability: Step 4 (Normal Distributions)Matt Hansen
 
MSA – Overview
MSA – OverviewMSA – Overview
MSA – OverviewMatt Hansen
 
Comparing Distributions and Using the Graphical Summary
Comparing Distributions and Using the Graphical SummaryComparing Distributions and Using the Graphical Summary
Comparing Distributions and Using the Graphical SummaryMatt Hansen
 
Process Capability: Steps 1 to 3
Process Capability: Steps 1 to 3Process Capability: Steps 1 to 3
Process Capability: Steps 1 to 3Matt Hansen
 
Defining Performance Objectives
Defining Performance ObjectivesDefining Performance Objectives
Defining Performance ObjectivesMatt Hansen
 
Control Charts: Recalculating Control Limits
Control Charts: Recalculating Control LimitsControl Charts: Recalculating Control Limits
Control Charts: Recalculating Control LimitsMatt Hansen
 
Identify Root Causes – Combining the C&E Diagram and 5 Whys
Identify Root Causes – Combining the C&E Diagram and 5 WhysIdentify Root Causes – Combining the C&E Diagram and 5 Whys
Identify Root Causes – Combining the C&E Diagram and 5 WhysMatt Hansen
 
Control Charts: P Chart
Control Charts: P ChartControl Charts: P Chart
Control Charts: P ChartMatt Hansen
 
Identify Root Causes – C&E Diagram
Identify Root Causes – C&E DiagramIdentify Root Causes – C&E Diagram
Identify Root Causes – C&E DiagramMatt Hansen
 
Control Charts: U Chart
Control Charts: U ChartControl Charts: U Chart
Control Charts: U ChartMatt Hansen
 
Control Charts: I-MR Chart
Control Charts: I-MR ChartControl Charts: I-MR Chart
Control Charts: I-MR ChartMatt Hansen
 
Statistical Process Control (SPC)
Statistical Process Control (SPC)Statistical Process Control (SPC)
Statistical Process Control (SPC)Matt Hansen
 
Descriptive Statistics
Descriptive StatisticsDescriptive Statistics
Descriptive StatisticsMatt Hansen
 
Defining the VOC and Defects
Defining the VOC and DefectsDefining the VOC and Defects
Defining the VOC and DefectsMatt Hansen
 
Analyze Phase Roadmap (Level 3)
Analyze Phase Roadmap (Level 3)Analyze Phase Roadmap (Level 3)
Analyze Phase Roadmap (Level 3)Matt Hansen
 
Identify Root Causes – C&E Matrix
Identify Root Causes – C&E MatrixIdentify Root Causes – C&E Matrix
Identify Root Causes – C&E MatrixMatt Hansen
 
Control Charts: Finding the Right Control Chart
Control Charts: Finding the Right Control ChartControl Charts: Finding the Right Control Chart
Control Charts: Finding the Right Control ChartMatt Hansen
 
Different Sources of Data with Matt Hansen at StatStuff
Different Sources of Data with Matt Hansen at StatStuffDifferent Sources of Data with Matt Hansen at StatStuff
Different Sources of Data with Matt Hansen at StatStuffMatt Hansen
 

What's hot (20)

Process Capability: Step 5 (Non-Normal Distributions)
Process Capability: Step 5 (Non-Normal Distributions)Process Capability: Step 5 (Non-Normal Distributions)
Process Capability: Step 5 (Non-Normal Distributions)
 
MSA – Planning & Conducting the MSA
MSA – Planning & Conducting the MSAMSA – Planning & Conducting the MSA
MSA – Planning & Conducting the MSA
 
Process Capability: Step 4 (Normal Distributions)
Process Capability: Step 4 (Normal Distributions)Process Capability: Step 4 (Normal Distributions)
Process Capability: Step 4 (Normal Distributions)
 
MSA – Overview
MSA – OverviewMSA – Overview
MSA – Overview
 
Comparing Distributions and Using the Graphical Summary
Comparing Distributions and Using the Graphical SummaryComparing Distributions and Using the Graphical Summary
Comparing Distributions and Using the Graphical Summary
 
Process Capability: Steps 1 to 3
Process Capability: Steps 1 to 3Process Capability: Steps 1 to 3
Process Capability: Steps 1 to 3
 
Defining Performance Objectives
Defining Performance ObjectivesDefining Performance Objectives
Defining Performance Objectives
 
Control Charts: Recalculating Control Limits
Control Charts: Recalculating Control LimitsControl Charts: Recalculating Control Limits
Control Charts: Recalculating Control Limits
 
Identify Root Causes – Combining the C&E Diagram and 5 Whys
Identify Root Causes – Combining the C&E Diagram and 5 WhysIdentify Root Causes – Combining the C&E Diagram and 5 Whys
Identify Root Causes – Combining the C&E Diagram and 5 Whys
 
Control Charts: P Chart
Control Charts: P ChartControl Charts: P Chart
Control Charts: P Chart
 
Identify Root Causes – C&E Diagram
Identify Root Causes – C&E DiagramIdentify Root Causes – C&E Diagram
Identify Root Causes – C&E Diagram
 
Control Charts: U Chart
Control Charts: U ChartControl Charts: U Chart
Control Charts: U Chart
 
Control Charts: I-MR Chart
Control Charts: I-MR ChartControl Charts: I-MR Chart
Control Charts: I-MR Chart
 
Statistical Process Control (SPC)
Statistical Process Control (SPC)Statistical Process Control (SPC)
Statistical Process Control (SPC)
 
Descriptive Statistics
Descriptive StatisticsDescriptive Statistics
Descriptive Statistics
 
Defining the VOC and Defects
Defining the VOC and DefectsDefining the VOC and Defects
Defining the VOC and Defects
 
Analyze Phase Roadmap (Level 3)
Analyze Phase Roadmap (Level 3)Analyze Phase Roadmap (Level 3)
Analyze Phase Roadmap (Level 3)
 
Identify Root Causes – C&E Matrix
Identify Root Causes – C&E MatrixIdentify Root Causes – C&E Matrix
Identify Root Causes – C&E Matrix
 
Control Charts: Finding the Right Control Chart
Control Charts: Finding the Right Control ChartControl Charts: Finding the Right Control Chart
Control Charts: Finding the Right Control Chart
 
Different Sources of Data with Matt Hansen at StatStuff
Different Sources of Data with Matt Hansen at StatStuffDifferent Sources of Data with Matt Hansen at StatStuff
Different Sources of Data with Matt Hansen at StatStuff
 

Similar to Rational Sub-Grouping

Did Something Change? - Using Statistical Techniques to Interpret Service and...
Did Something Change? - Using Statistical Techniques to Interpret Service and...Did Something Change? - Using Statistical Techniques to Interpret Service and...
Did Something Change? - Using Statistical Techniques to Interpret Service and...Joao Galdino Mello de Souza
 
Distributions: Non-Normal with Matt Hansen at StatStuff
Distributions: Non-Normal with Matt Hansen at StatStuffDistributions: Non-Normal with Matt Hansen at StatStuff
Distributions: Non-Normal with Matt Hansen at StatStuffMatt Hansen
 
Overview of Statistical Terms and Concepts with Matt Hansen at StatStuff
Overview of Statistical Terms and Concepts with Matt Hansen at StatStuffOverview of Statistical Terms and Concepts with Matt Hansen at StatStuff
Overview of Statistical Terms and Concepts with Matt Hansen at StatStuffMatt Hansen
 
Testing for Multicollinearity
Testing for MulticollinearityTesting for Multicollinearity
Testing for MulticollinearityMatt Hansen
 
Lecture 3 Statistical ProcessControl (SPC).docx
Lecture 3 Statistical ProcessControl (SPC).docxLecture 3 Statistical ProcessControl (SPC).docx
Lecture 3 Statistical ProcessControl (SPC).docxsmile790243
 
7 qc tools
7 qc tools7 qc tools
7 qc toolskmsonam
 
Distributions: Overview with Matt Hansen at StatStuff
Distributions: Overview with Matt Hansen at StatStuffDistributions: Overview with Matt Hansen at StatStuff
Distributions: Overview with Matt Hansen at StatStuffMatt Hansen
 
Six sigma tools an overview
Six sigma tools  an overviewSix sigma tools  an overview
Six sigma tools an overviewKomal Kamble
 
Exam Short Preparation on Data Analytics
Exam Short Preparation on Data AnalyticsExam Short Preparation on Data Analytics
Exam Short Preparation on Data AnalyticsHarsh Parekh
 
Training in quality management
Training in quality managementTraining in quality management
Training in quality managementselinasimpson3001
 
Descriptive Statistics
Descriptive StatisticsDescriptive Statistics
Descriptive StatisticsCIToolkit
 
Quality Journey -Introduction to 7QC Tools2.0.pdf
Quality Journey -Introduction to 7QC Tools2.0.pdfQuality Journey -Introduction to 7QC Tools2.0.pdf
Quality Journey -Introduction to 7QC Tools2.0.pdfNileshJajoo2
 
Process Improvement Tools Daniel Pirzada
Process Improvement Tools Daniel PirzadaProcess Improvement Tools Daniel Pirzada
Process Improvement Tools Daniel PirzadaAbdullahTariq648768
 

Similar to Rational Sub-Grouping (20)

Did Something Change? - Using Statistical Techniques to Interpret Service and...
Did Something Change? - Using Statistical Techniques to Interpret Service and...Did Something Change? - Using Statistical Techniques to Interpret Service and...
Did Something Change? - Using Statistical Techniques to Interpret Service and...
 
Chapter 18
Chapter 18Chapter 18
Chapter 18
 
Descriptive Analytics: Data Reduction
 Descriptive Analytics: Data Reduction Descriptive Analytics: Data Reduction
Descriptive Analytics: Data Reduction
 
3.2 ANALYZE PHASE.pptx
3.2 ANALYZE PHASE.pptx3.2 ANALYZE PHASE.pptx
3.2 ANALYZE PHASE.pptx
 
CHAPTER 7.pptx
CHAPTER 7.pptxCHAPTER 7.pptx
CHAPTER 7.pptx
 
7 qc tools
7 qc tools7 qc tools
7 qc tools
 
SPC,SQC & QC TOOLS
SPC,SQC & QC TOOLSSPC,SQC & QC TOOLS
SPC,SQC & QC TOOLS
 
Distributions: Non-Normal with Matt Hansen at StatStuff
Distributions: Non-Normal with Matt Hansen at StatStuffDistributions: Non-Normal with Matt Hansen at StatStuff
Distributions: Non-Normal with Matt Hansen at StatStuff
 
Overview of Statistical Terms and Concepts with Matt Hansen at StatStuff
Overview of Statistical Terms and Concepts with Matt Hansen at StatStuffOverview of Statistical Terms and Concepts with Matt Hansen at StatStuff
Overview of Statistical Terms and Concepts with Matt Hansen at StatStuff
 
Testing for Multicollinearity
Testing for MulticollinearityTesting for Multicollinearity
Testing for Multicollinearity
 
Lecture 3 Statistical ProcessControl (SPC).docx
Lecture 3 Statistical ProcessControl (SPC).docxLecture 3 Statistical ProcessControl (SPC).docx
Lecture 3 Statistical ProcessControl (SPC).docx
 
7 qc tools
7 qc tools7 qc tools
7 qc tools
 
Distributions: Overview with Matt Hansen at StatStuff
Distributions: Overview with Matt Hansen at StatStuffDistributions: Overview with Matt Hansen at StatStuff
Distributions: Overview with Matt Hansen at StatStuff
 
Quality management courses
Quality management coursesQuality management courses
Quality management courses
 
Six sigma tools an overview
Six sigma tools  an overviewSix sigma tools  an overview
Six sigma tools an overview
 
Exam Short Preparation on Data Analytics
Exam Short Preparation on Data AnalyticsExam Short Preparation on Data Analytics
Exam Short Preparation on Data Analytics
 
Training in quality management
Training in quality managementTraining in quality management
Training in quality management
 
Descriptive Statistics
Descriptive StatisticsDescriptive Statistics
Descriptive Statistics
 
Quality Journey -Introduction to 7QC Tools2.0.pdf
Quality Journey -Introduction to 7QC Tools2.0.pdfQuality Journey -Introduction to 7QC Tools2.0.pdf
Quality Journey -Introduction to 7QC Tools2.0.pdf
 
Process Improvement Tools Daniel Pirzada
Process Improvement Tools Daniel PirzadaProcess Improvement Tools Daniel Pirzada
Process Improvement Tools Daniel Pirzada
 

More from Matt Hansen

Getting Feedback with a Plus/Delta Tool
Getting Feedback with a Plus/Delta ToolGetting Feedback with a Plus/Delta Tool
Getting Feedback with a Plus/Delta ToolMatt Hansen
 
Closing a Project
Closing a ProjectClosing a Project
Closing a ProjectMatt Hansen
 
Documenting a New Process with SOPs
Documenting a New Process with SOPsDocumenting a New Process with SOPs
Documenting a New Process with SOPsMatt Hansen
 
Building a Control Plan
Building a Control PlanBuilding a Control Plan
Building a Control PlanMatt Hansen
 
Control Charts: Xbar-S Chart
Control Charts: Xbar-S ChartControl Charts: Xbar-S Chart
Control Charts: Xbar-S ChartMatt Hansen
 
Building a Scorecard
Building a ScorecardBuilding a Scorecard
Building a ScorecardMatt Hansen
 
Control Phase Roadmap (Level 3)
Control Phase Roadmap (Level 3)Control Phase Roadmap (Level 3)
Control Phase Roadmap (Level 3)Matt Hansen
 
Piloting Solutions: Build the Pilot Plan
Piloting Solutions: Build the Pilot PlanPiloting Solutions: Build the Pilot Plan
Piloting Solutions: Build the Pilot PlanMatt Hansen
 
Piloting Solutions: The Process
Piloting Solutions: The ProcessPiloting Solutions: The Process
Piloting Solutions: The ProcessMatt Hansen
 
Risk Assessment with a FMEA Tool
Risk Assessment with a FMEA ToolRisk Assessment with a FMEA Tool
Risk Assessment with a FMEA ToolMatt Hansen
 
Prioritize Solutions with an Impact Matrix
Prioritize Solutions with an Impact MatrixPrioritize Solutions with an Impact Matrix
Prioritize Solutions with an Impact MatrixMatt Hansen
 
Brainstorm Solutions with an Affinity Diagram
Brainstorm Solutions with an Affinity DiagramBrainstorm Solutions with an Affinity Diagram
Brainstorm Solutions with an Affinity DiagramMatt Hansen
 
Brainstorm & Prioritize Solutions with a Workout
Brainstorm & Prioritize Solutions with a WorkoutBrainstorm & Prioritize Solutions with a Workout
Brainstorm & Prioritize Solutions with a WorkoutMatt Hansen
 
Compiling Analysis Results
Compiling Analysis ResultsCompiling Analysis Results
Compiling Analysis ResultsMatt Hansen
 
Improve Phase Roadmap (Level 3)
Improve Phase Roadmap (Level 3)Improve Phase Roadmap (Level 3)
Improve Phase Roadmap (Level 3)Matt Hansen
 
Hypothesis Testing: Relationships (Compare 2+ Factors)
Hypothesis Testing: Relationships (Compare 2+ Factors)Hypothesis Testing: Relationships (Compare 2+ Factors)
Hypothesis Testing: Relationships (Compare 2+ Factors)Matt Hansen
 
Hypothesis Testing: Relationships (Compare 1:1)
Hypothesis Testing: Relationships (Compare 1:1)Hypothesis Testing: Relationships (Compare 1:1)
Hypothesis Testing: Relationships (Compare 1:1)Matt Hansen
 
Hypothesis Testing: Relationships (Overview)
Hypothesis Testing: Relationships (Overview)Hypothesis Testing: Relationships (Overview)
Hypothesis Testing: Relationships (Overview)Matt Hansen
 
Hypothesis Testing: Spread (Compare 2+ Factors)
Hypothesis Testing: Spread (Compare 2+ Factors)Hypothesis Testing: Spread (Compare 2+ Factors)
Hypothesis Testing: Spread (Compare 2+ Factors)Matt Hansen
 
Hypothesis Testing: Spread (Compare 1:1)
Hypothesis Testing: Spread (Compare 1:1)Hypothesis Testing: Spread (Compare 1:1)
Hypothesis Testing: Spread (Compare 1:1)Matt Hansen
 

More from Matt Hansen (20)

Getting Feedback with a Plus/Delta Tool
Getting Feedback with a Plus/Delta ToolGetting Feedback with a Plus/Delta Tool
Getting Feedback with a Plus/Delta Tool
 
Closing a Project
Closing a ProjectClosing a Project
Closing a Project
 
Documenting a New Process with SOPs
Documenting a New Process with SOPsDocumenting a New Process with SOPs
Documenting a New Process with SOPs
 
Building a Control Plan
Building a Control PlanBuilding a Control Plan
Building a Control Plan
 
Control Charts: Xbar-S Chart
Control Charts: Xbar-S ChartControl Charts: Xbar-S Chart
Control Charts: Xbar-S Chart
 
Building a Scorecard
Building a ScorecardBuilding a Scorecard
Building a Scorecard
 
Control Phase Roadmap (Level 3)
Control Phase Roadmap (Level 3)Control Phase Roadmap (Level 3)
Control Phase Roadmap (Level 3)
 
Piloting Solutions: Build the Pilot Plan
Piloting Solutions: Build the Pilot PlanPiloting Solutions: Build the Pilot Plan
Piloting Solutions: Build the Pilot Plan
 
Piloting Solutions: The Process
Piloting Solutions: The ProcessPiloting Solutions: The Process
Piloting Solutions: The Process
 
Risk Assessment with a FMEA Tool
Risk Assessment with a FMEA ToolRisk Assessment with a FMEA Tool
Risk Assessment with a FMEA Tool
 
Prioritize Solutions with an Impact Matrix
Prioritize Solutions with an Impact MatrixPrioritize Solutions with an Impact Matrix
Prioritize Solutions with an Impact Matrix
 
Brainstorm Solutions with an Affinity Diagram
Brainstorm Solutions with an Affinity DiagramBrainstorm Solutions with an Affinity Diagram
Brainstorm Solutions with an Affinity Diagram
 
Brainstorm & Prioritize Solutions with a Workout
Brainstorm & Prioritize Solutions with a WorkoutBrainstorm & Prioritize Solutions with a Workout
Brainstorm & Prioritize Solutions with a Workout
 
Compiling Analysis Results
Compiling Analysis ResultsCompiling Analysis Results
Compiling Analysis Results
 
Improve Phase Roadmap (Level 3)
Improve Phase Roadmap (Level 3)Improve Phase Roadmap (Level 3)
Improve Phase Roadmap (Level 3)
 
Hypothesis Testing: Relationships (Compare 2+ Factors)
Hypothesis Testing: Relationships (Compare 2+ Factors)Hypothesis Testing: Relationships (Compare 2+ Factors)
Hypothesis Testing: Relationships (Compare 2+ Factors)
 
Hypothesis Testing: Relationships (Compare 1:1)
Hypothesis Testing: Relationships (Compare 1:1)Hypothesis Testing: Relationships (Compare 1:1)
Hypothesis Testing: Relationships (Compare 1:1)
 
Hypothesis Testing: Relationships (Overview)
Hypothesis Testing: Relationships (Overview)Hypothesis Testing: Relationships (Overview)
Hypothesis Testing: Relationships (Overview)
 
Hypothesis Testing: Spread (Compare 2+ Factors)
Hypothesis Testing: Spread (Compare 2+ Factors)Hypothesis Testing: Spread (Compare 2+ Factors)
Hypothesis Testing: Spread (Compare 2+ Factors)
 
Hypothesis Testing: Spread (Compare 1:1)
Hypothesis Testing: Spread (Compare 1:1)Hypothesis Testing: Spread (Compare 1:1)
Hypothesis Testing: Spread (Compare 1:1)
 

Recently uploaded

Enhancing and Restoring Safety & Quality Cultures - Dave Litwiller - May 2024...
Enhancing and Restoring Safety & Quality Cultures - Dave Litwiller - May 2024...Enhancing and Restoring Safety & Quality Cultures - Dave Litwiller - May 2024...
Enhancing and Restoring Safety & Quality Cultures - Dave Litwiller - May 2024...Dave Litwiller
 
Call Girls In Radisson Blu Hotel New Delhi Paschim Vihar ❤️8860477959 Escorts...
Call Girls In Radisson Blu Hotel New Delhi Paschim Vihar ❤️8860477959 Escorts...Call Girls In Radisson Blu Hotel New Delhi Paschim Vihar ❤️8860477959 Escorts...
Call Girls In Radisson Blu Hotel New Delhi Paschim Vihar ❤️8860477959 Escorts...lizamodels9
 
VIP Kolkata Call Girl Howrah 👉 8250192130 Available With Room
VIP Kolkata Call Girl Howrah 👉 8250192130  Available With RoomVIP Kolkata Call Girl Howrah 👉 8250192130  Available With Room
VIP Kolkata Call Girl Howrah 👉 8250192130 Available With Roomdivyansh0kumar0
 
Call Girls In Connaught Place Delhi ❤️88604**77959_Russian 100% Genuine Escor...
Call Girls In Connaught Place Delhi ❤️88604**77959_Russian 100% Genuine Escor...Call Girls In Connaught Place Delhi ❤️88604**77959_Russian 100% Genuine Escor...
Call Girls In Connaught Place Delhi ❤️88604**77959_Russian 100% Genuine Escor...lizamodels9
 
VIP Call Girls Pune Kirti 8617697112 Independent Escort Service Pune
VIP Call Girls Pune Kirti 8617697112 Independent Escort Service PuneVIP Call Girls Pune Kirti 8617697112 Independent Escort Service Pune
VIP Call Girls Pune Kirti 8617697112 Independent Escort Service PuneCall girls in Ahmedabad High profile
 
Pharma Works Profile of Karan Communications
Pharma Works Profile of Karan CommunicationsPharma Works Profile of Karan Communications
Pharma Works Profile of Karan Communicationskarancommunications
 
Progress Report - Oracle Database Analyst Summit
Progress  Report - Oracle Database Analyst SummitProgress  Report - Oracle Database Analyst Summit
Progress Report - Oracle Database Analyst SummitHolger Mueller
 
Non Text Magic Studio Magic Design for Presentations L&P.pptx
Non Text Magic Studio Magic Design for Presentations L&P.pptxNon Text Magic Studio Magic Design for Presentations L&P.pptx
Non Text Magic Studio Magic Design for Presentations L&P.pptxAbhayThakur200703
 
M.C Lodges -- Guest House in Jhang.
M.C Lodges --  Guest House in Jhang.M.C Lodges --  Guest House in Jhang.
M.C Lodges -- Guest House in Jhang.Aaiza Hassan
 
0183760ssssssssssssssssssssssssssss00101011 (27).pdf
0183760ssssssssssssssssssssssssssss00101011 (27).pdf0183760ssssssssssssssssssssssssssss00101011 (27).pdf
0183760ssssssssssssssssssssssssssss00101011 (27).pdfRenandantas16
 
Call Girls in Mehrauli Delhi 💯Call Us 🔝8264348440🔝
Call Girls in Mehrauli Delhi 💯Call Us 🔝8264348440🔝Call Girls in Mehrauli Delhi 💯Call Us 🔝8264348440🔝
Call Girls in Mehrauli Delhi 💯Call Us 🔝8264348440🔝soniya singh
 
GD Birla and his contribution in management
GD Birla and his contribution in managementGD Birla and his contribution in management
GD Birla and his contribution in managementchhavia330
 
Vip Dewas Call Girls #9907093804 Contact Number Escorts Service Dewas
Vip Dewas Call Girls #9907093804 Contact Number Escorts Service DewasVip Dewas Call Girls #9907093804 Contact Number Escorts Service Dewas
Vip Dewas Call Girls #9907093804 Contact Number Escorts Service Dewasmakika9823
 
BEST Call Girls In Old Faridabad ✨ 9773824855 ✨ Escorts Service In Delhi Ncr,
BEST Call Girls In Old Faridabad ✨ 9773824855 ✨ Escorts Service In Delhi Ncr,BEST Call Girls In Old Faridabad ✨ 9773824855 ✨ Escorts Service In Delhi Ncr,
BEST Call Girls In Old Faridabad ✨ 9773824855 ✨ Escorts Service In Delhi Ncr,noida100girls
 
A DAY IN THE LIFE OF A SALESMAN / WOMAN
A DAY IN THE LIFE OF A  SALESMAN / WOMANA DAY IN THE LIFE OF A  SALESMAN / WOMAN
A DAY IN THE LIFE OF A SALESMAN / WOMANIlamathiKannappan
 
Regression analysis: Simple Linear Regression Multiple Linear Regression
Regression analysis:  Simple Linear Regression Multiple Linear RegressionRegression analysis:  Simple Linear Regression Multiple Linear Regression
Regression analysis: Simple Linear Regression Multiple Linear RegressionRavindra Nath Shukla
 
Cash Payment 9602870969 Escort Service in Udaipur Call Girls
Cash Payment 9602870969 Escort Service in Udaipur Call GirlsCash Payment 9602870969 Escort Service in Udaipur Call Girls
Cash Payment 9602870969 Escort Service in Udaipur Call GirlsApsara Of India
 
/:Call Girls In Jaypee Siddharth - 5 Star Hotel New Delhi ➥9990211544 Top Esc...
/:Call Girls In Jaypee Siddharth - 5 Star Hotel New Delhi ➥9990211544 Top Esc.../:Call Girls In Jaypee Siddharth - 5 Star Hotel New Delhi ➥9990211544 Top Esc...
/:Call Girls In Jaypee Siddharth - 5 Star Hotel New Delhi ➥9990211544 Top Esc...lizamodels9
 
Call Girls In Panjim North Goa 9971646499 Genuine Service
Call Girls In Panjim North Goa 9971646499 Genuine ServiceCall Girls In Panjim North Goa 9971646499 Genuine Service
Call Girls In Panjim North Goa 9971646499 Genuine Serviceritikaroy0888
 
Vip Female Escorts Noida 9711199171 Greater Noida Escorts Service
Vip Female Escorts Noida 9711199171 Greater Noida Escorts ServiceVip Female Escorts Noida 9711199171 Greater Noida Escorts Service
Vip Female Escorts Noida 9711199171 Greater Noida Escorts Serviceankitnayak356677
 

Recently uploaded (20)

Enhancing and Restoring Safety & Quality Cultures - Dave Litwiller - May 2024...
Enhancing and Restoring Safety & Quality Cultures - Dave Litwiller - May 2024...Enhancing and Restoring Safety & Quality Cultures - Dave Litwiller - May 2024...
Enhancing and Restoring Safety & Quality Cultures - Dave Litwiller - May 2024...
 
Call Girls In Radisson Blu Hotel New Delhi Paschim Vihar ❤️8860477959 Escorts...
Call Girls In Radisson Blu Hotel New Delhi Paschim Vihar ❤️8860477959 Escorts...Call Girls In Radisson Blu Hotel New Delhi Paschim Vihar ❤️8860477959 Escorts...
Call Girls In Radisson Blu Hotel New Delhi Paschim Vihar ❤️8860477959 Escorts...
 
VIP Kolkata Call Girl Howrah 👉 8250192130 Available With Room
VIP Kolkata Call Girl Howrah 👉 8250192130  Available With RoomVIP Kolkata Call Girl Howrah 👉 8250192130  Available With Room
VIP Kolkata Call Girl Howrah 👉 8250192130 Available With Room
 
Call Girls In Connaught Place Delhi ❤️88604**77959_Russian 100% Genuine Escor...
Call Girls In Connaught Place Delhi ❤️88604**77959_Russian 100% Genuine Escor...Call Girls In Connaught Place Delhi ❤️88604**77959_Russian 100% Genuine Escor...
Call Girls In Connaught Place Delhi ❤️88604**77959_Russian 100% Genuine Escor...
 
VIP Call Girls Pune Kirti 8617697112 Independent Escort Service Pune
VIP Call Girls Pune Kirti 8617697112 Independent Escort Service PuneVIP Call Girls Pune Kirti 8617697112 Independent Escort Service Pune
VIP Call Girls Pune Kirti 8617697112 Independent Escort Service Pune
 
Pharma Works Profile of Karan Communications
Pharma Works Profile of Karan CommunicationsPharma Works Profile of Karan Communications
Pharma Works Profile of Karan Communications
 
Progress Report - Oracle Database Analyst Summit
Progress  Report - Oracle Database Analyst SummitProgress  Report - Oracle Database Analyst Summit
Progress Report - Oracle Database Analyst Summit
 
Non Text Magic Studio Magic Design for Presentations L&P.pptx
Non Text Magic Studio Magic Design for Presentations L&P.pptxNon Text Magic Studio Magic Design for Presentations L&P.pptx
Non Text Magic Studio Magic Design for Presentations L&P.pptx
 
M.C Lodges -- Guest House in Jhang.
M.C Lodges --  Guest House in Jhang.M.C Lodges --  Guest House in Jhang.
M.C Lodges -- Guest House in Jhang.
 
0183760ssssssssssssssssssssssssssss00101011 (27).pdf
0183760ssssssssssssssssssssssssssss00101011 (27).pdf0183760ssssssssssssssssssssssssssss00101011 (27).pdf
0183760ssssssssssssssssssssssssssss00101011 (27).pdf
 
Call Girls in Mehrauli Delhi 💯Call Us 🔝8264348440🔝
Call Girls in Mehrauli Delhi 💯Call Us 🔝8264348440🔝Call Girls in Mehrauli Delhi 💯Call Us 🔝8264348440🔝
Call Girls in Mehrauli Delhi 💯Call Us 🔝8264348440🔝
 
GD Birla and his contribution in management
GD Birla and his contribution in managementGD Birla and his contribution in management
GD Birla and his contribution in management
 
Vip Dewas Call Girls #9907093804 Contact Number Escorts Service Dewas
Vip Dewas Call Girls #9907093804 Contact Number Escorts Service DewasVip Dewas Call Girls #9907093804 Contact Number Escorts Service Dewas
Vip Dewas Call Girls #9907093804 Contact Number Escorts Service Dewas
 
BEST Call Girls In Old Faridabad ✨ 9773824855 ✨ Escorts Service In Delhi Ncr,
BEST Call Girls In Old Faridabad ✨ 9773824855 ✨ Escorts Service In Delhi Ncr,BEST Call Girls In Old Faridabad ✨ 9773824855 ✨ Escorts Service In Delhi Ncr,
BEST Call Girls In Old Faridabad ✨ 9773824855 ✨ Escorts Service In Delhi Ncr,
 
A DAY IN THE LIFE OF A SALESMAN / WOMAN
A DAY IN THE LIFE OF A  SALESMAN / WOMANA DAY IN THE LIFE OF A  SALESMAN / WOMAN
A DAY IN THE LIFE OF A SALESMAN / WOMAN
 
Regression analysis: Simple Linear Regression Multiple Linear Regression
Regression analysis:  Simple Linear Regression Multiple Linear RegressionRegression analysis:  Simple Linear Regression Multiple Linear Regression
Regression analysis: Simple Linear Regression Multiple Linear Regression
 
Cash Payment 9602870969 Escort Service in Udaipur Call Girls
Cash Payment 9602870969 Escort Service in Udaipur Call GirlsCash Payment 9602870969 Escort Service in Udaipur Call Girls
Cash Payment 9602870969 Escort Service in Udaipur Call Girls
 
/:Call Girls In Jaypee Siddharth - 5 Star Hotel New Delhi ➥9990211544 Top Esc...
/:Call Girls In Jaypee Siddharth - 5 Star Hotel New Delhi ➥9990211544 Top Esc.../:Call Girls In Jaypee Siddharth - 5 Star Hotel New Delhi ➥9990211544 Top Esc...
/:Call Girls In Jaypee Siddharth - 5 Star Hotel New Delhi ➥9990211544 Top Esc...
 
Call Girls In Panjim North Goa 9971646499 Genuine Service
Call Girls In Panjim North Goa 9971646499 Genuine ServiceCall Girls In Panjim North Goa 9971646499 Genuine Service
Call Girls In Panjim North Goa 9971646499 Genuine Service
 
Vip Female Escorts Noida 9711199171 Greater Noida Escorts Service
Vip Female Escorts Noida 9711199171 Greater Noida Escorts ServiceVip Female Escorts Noida 9711199171 Greater Noida Escorts Service
Vip Female Escorts Noida 9711199171 Greater Noida Escorts Service
 

Rational Sub-Grouping

  • 1. Section & Lesson #: Pre-Requisite Lessons: Complex Tools + Clear Teaching = Powerful Results Rational Sub-Grouping Six Sigma-Measure – Lesson 18 A review of how we sub-divide data for analysis using rational sub- grouping. Six Sigma-Measure #17 – Variation Over Time (Short/Long Term Data) Copyright © 2011-2019 by Matthew J. Hansen. All Rights Reserved. No part of this publication may be reproduced, stored in a retrieval system, or transmitted by any means (electronic, mechanical, photographic, photocopying, recording or otherwise) without prior permission in writing by the author and/or publisher.
  • 2. o What is rational sub-grouping? • It’s the logical distinction of potential sub-processes that exist within an overall process. • These sub-processes are usually distinguished (or grouped) by a factor or category. Examples:  Time (e.g., shift, time of day, day of month, etc.)  Location (e.g., country, geographic region, metro/rural, native language, etc.)  Processes (e.g., separating different processes or different methods of the same process, etc.)  People (e.g., tenure, education level, etc.) o How do I know if I need rational sub-grouping? • Special cause variation may reveal the need for rational sub-grouping.  If the same special cause tests tend to fail, then a sub-group may exist in the process. • Non-normal data can sometimes also indicate that sub-groups exist.  A non-normal process may be caused by multiple, overlapping normal processes.  From a normality plot, group the data points for each straight line in the plot to see if sub-groups exist. o How do I know if I have the right rational sub-grouping? • Use ANOVA and HOV tests (Analyze phase) to confirm statistical differences between sub-groups.  Keep the sub-grouping only if a statistical difference exists (low P value) between the sub-groups. Rational Sub-grouping Defined 2 125.0%100.0%75.0%50.0%25.0%0.0%-25.0%-50.0% 99.9 99 95 90 80 70 60 50 40 30 20 10 5 1 0.1 MetricB Percent M S N A P Probability Plot of MetricB Normal Sub-Group A Sub-Group B
  • 3. Practical Application o Identify at least 3 metrics used by your organization that are continuous values. • For each metric, identify at least 3 types of sub-groups currently used for reporting. • What are at least 2 other types of sub-groups that are possible, but improbable?  How can you confirm if it’s a rational sub-group that should be separately measured? Copyright © 2011-2019 by Matthew J. Hansen. All Rights Reserved. No part of this publication may be reproduced, stored in a retrieval system, or transmitted by any means (electronic, mechanical, photographic, photocopying, recording or otherwise) without prior permission in writing by the author and/or publisher. 3