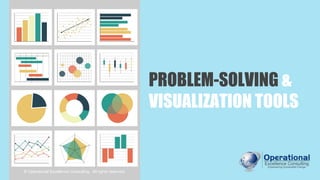
Problem Solving & Visualization Tools

[To download this presentation, visit: https://www.oeconsulting.com.sg/training-presentations] INTRODUCTION: Unlock the potential of your problem-solving endeavors with our comprehensive "Problem-Solving & Visualization Tools" presentation. This collection of 24 tools, ranging from foundational to advanced Quality Control (QC) instruments, caters to diverse industries and is designed to elevate your problem-solving skills and enhance communication. KEY FEATURES: 1. Diverse Applicability: Applicable across all industries, these tools are versatile and adaptable to your unique problem-solving challenges. 2. Structured Format: The presentation employs a clear and concise format, providing structured information in 'Purpose,' 'When To Use,' 'Examples,' 'Procedures,' and 'Practical Tips' sections for each tool. 3. Complementary to Project Frameworks: Seamlessly integrate these tools into popular problem-solving frameworks such as PDCA, DMAIC, 8D, and more, adding depth and breadth to your projects. CONTENTS: Explore a rich array of tools, each carefully curated to empower your problem-solving journey: 1. Brainstorming 2. Gantt Chart 3. Stratification 4. Check Sheet 5. Bar Chart 6. Waterfall Chart 7. Line Graphs 8. Pie Chart 9. Radar Chart 10. Pareto Chart 11. 5 Whys 12. Cause and Effect Diagram 13. Histogram 14. Scatter Diagram 15. Affinity Diagram 16. Control Chart 17. Relations Diagram 18. Tree Diagram 19. Matrix Diagram 20. Matrix Data Analysis Chart 21. Arrow Diagram 22. Process Decision Program Chart (PDPC) 23. 5W2H 24. Is / Is Not

Recommended
More Related Content
What's hot
What's hot (20)
Similar to Problem Solving & Visualization Tools
Similar to Problem Solving & Visualization Tools (20)
More from Operational Excellence Consulting
More from Operational Excellence Consulting (20)
Recently uploaded
Recently uploaded (20)
Problem Solving & Visualization Tools
- 1. PROBLEM-SOLVING & VISUALIZATION TOOLS © Operational Excellence Consulting. All rights reserved.
- 2. © Operational Excellence Consulting CONTENTS 2 1. Brainstorming 13. Histogram 2. Gantt Chart 14. Scatter Diagram 3. Stratification 15. Affinity Diagram 4. Check Sheet 16. Control Chart 5. Bar Chart 17. Relations Diagram 6. Waterfall Chart 18. Tree Diagram 7. Line Graphs 19. Matrix Diagram 8. Pie Chart 20. Matrix Data Analysis Chart 9. Radar Chart 21. Arrow Diagram 10. Pareto Chart 22. Process Decision Program Chart (PDPC) 11. 5 Whys 23. 5W2H 12. Cause and Effect Diagram 24. Is / Is Not NOTE: This is a PARTIAL PREVIEW. To download the complete presentation, please visit: https://www.oeconsulting.com.sg
- 3. © Operational Excellence Consulting “ DR. KAORU ISHUKAWA 3 As much as 95% of quality related problems in the factory can be solved with seven fundamental quantitative tools.”
- 4. © Operational Excellence Consulting © Operational Excellence Consulting. All rights reserved. BRAINSTORMING Purpose: ● Stimulating creative idea generation When to use: ● When seeking fresh insights ● To compile a comprehensive list of options ● When facing complex, multi-faceted problems involving many individuals ● To foster team cohesion and creative synergy 4
- 5. © Operational Excellence Consulting BRAINSTORMING RULES 5 Defer judgement Encourage wild ideas Build on the ideas of others Stay focused on the topic Be visual One conversation at a time Go for quantity
- 6. © Operational Excellence Consulting EXAMPLE: GANTT CHART FOR A PROBLEM SOLVING PROJECT 6 ILLUSTRATIVE 7 Aug 14 Aug 21 Aug 28 Aug 4 Sep 11 Sep 18 Sep 25 Sep 1 Oct 8 Oct 15 Oct 22 Oct 29 Oct Select the Theme Plan the Schedule Grasp the Present Situation Establish the Target Analyze the Cause & Identify CA Implement Corrective Action Evaluate the Result Standardize & Follow Up Planned Actual
- 7. © Operational Excellence Consulting STRATIFICATION CONSIDERATIONS 7 Factor Examples of categories People Work methods, familiarity, age, gender Machinery Equipment, old vs. new, type, fixtures Materials and parts Processes, material quality, class, maker Operating conditions Temperature, humidity, speed, methods Time Month, weekday, hour, before vs. after repair Product Quality, old vs. new, lot Measurement, inspection Test device, gauge, sampler, inspector Factors for Stratification
- 8. © Operational Excellence Consulting EXAMPLE 1: SOCIAL STRATIFICATION 8 High Income Middle Income Low Income ILLUSTRATIVE
- 9. © Operational Excellence Consulting EXAMPLE: DEFECT TRACKING 9 Defective Item Mon 9/3 Tue 10/3 Wed 11/3 Thu 12/3 Fri 13/3 Total Mold Cracked 5 3 6 3 4 21 Fibers 2 0 5 1 0 8 Grit 4 2 3 5 0 14 Pinholes 1 5 0 2 1 9 Cracks 0 1 1 0 0 2 Other 1 3 0 0 3 7 Total 13 14 15 11 8 61 Defect Tracking Check Sheet (9/3 to 13/3) ILLUSTRATIVE Check Sheet
- 10. © Operational Excellence Consulting EXAMPLE 1: COMPARISON OF ANNUAL SALES PERFORMANCE 10 ILLUSTRATIVE 0 50 100 150 200 250 FY 2021 FY 2022 FY2023 Sales Performance Target Actual Bar Graph
- 11. © Operational Excellence Consulting EXAMPLE: ANALYSIS OF MANUFACTURING COST COMPONENTS 11 ILLUSTRATIVE Components of Total Manufacturing Cost ($) 400K 100K 200K Labor Materials Factory Overhead 120K 50K Utilities & Maintenance Depreciation 870K Total Waterfall Diagram
- 12. © Operational Excellence Consulting LINE GRAPH: PURPOSES 12 Correlation Analysis Show relationships between variables. Data Continuity Illustrate continuous data points. Trend Identification Display trends and patterns over time.
- 13. © Operational Excellence Consulting EXAMPLE 2: IMPLEMENTING & MONITORING CORRECTIVE ACTIONS 13 0 1 2 3 4 5 6 7 8 9 10 02-Nov 03-Nov 04-Nov 05-Nov 06-Nov 07-Nov 08-Nov 09-Nov 10-Nov 11-Nov 12-Nov 13-Nov Finish grinder Rough grinder Target Coolant replaced! Target level Spindle bearing tightened! Defect % Dates of action items and results confirmation ILLUSTRATIVE Source: Adapted from Sobek & Smalley Line Graph
- 14. © Operational Excellence Consulting EXAMPLE 2: COMPARISON OF MARKET SHARE 14 60% 14% 7% 5% 3% 3% 8% Browser Market Share Worldwide Chrome Safari UC Browser Firefox Opera IE Others Source: StatCounter, July 2018 ILLUSTRATIVE Pie Chart
- 15. © Operational Excellence Consulting EXAMPLE: COMPARING 5S PERFORMANCE 15 0 5 10 15 20 25 30 35 Sort Set In Order Shine Standardize Sustain Area A Area B ILLUSTRATIVE Radar Chart
- 16. © Operational Excellence Consulting RADAR CHART: PROCEDURES 16 1. Avoid Overlapping Axes: Ensure clarity by preventing axis overlap. 2. Normalize Data: Normalize values if scales differ significantly. 3. Limit Categories: A moderate number of categories for readability. 4. Use Consistent Colors: Maintain a consistent color scheme. 5. Highlight Key Areas: Emphasize critical data points for focus. 6. Provide Explanations: Include annotations to explain unusual patterns.
- 17. © Operational Excellence Consulting “ For many phenomena, 80% of consequences stem from 20% of the causes.” JOSEPH M. JURAN 17
- 18. © Operational Excellence Consulting PARETO’S PRINCIPLE (80/20 RULE) Examples: ● 80% of your net income comes from 20% of your customers ● 80% of your sales are generated by 20% of your products ● 80% of your emotions are created by 20% of your thoughts ● 80% of your work results from 20% of your effort 18 Effort Result 20% 20% 80% 80% Important Not Important
- 19. © Operational Excellence Consulting EXAMPLE 1: PIZZA DEFECTS 19 Wrong Toppings Pizza Cold Pizza Late Wrong Crust Tastes Bad Forgot Breadstic ks Driver Had No Change Smashed in Box Wrong Price Driver Rude All other Quantity 29 25 22 13 10 7 4 3 2 1 2 Cum % 25% 46% 64% 75% 84% 90% 93% 96% 97% 98% 100% % of Total 25% 21% 19% 11% 8% 6% 3% 3% 2% 1% 2% 0% 20% 40% 60% 80% 100% 120% - 5 10 15 20 25 30 35 Cumulative Percent Occurrences Pareto Chart of Pizza Defects ILLUSTRATIVE
- 20. © Operational Excellence Consulting EXAMPLE 2: COMPARING ‘BEFORE’ AND ‘AFTER’ RESULTS 20 ILLUSTRATIVE Before: Jan-Jun 2021 Errors Made on Faxed Orders After: Jul-Dec 2021 10 20 30 40 50 60 70 80 90 100 110 120 0 Missing Information Wrong Product Information Unreadable Wrong Billing Information PO and Order Form don’t Match Other Count Error Type Pareto Chart
- 21. © Operational Excellence Consulting 21 5 WHYS: WHEN TO USE Post-Incident Analysis After incidents or failures for in-depth analysis. Process Improvement Projects In continuous improvement projects to enhance processes systematically. Immediate Problem Resolution When addressing immediate issues to prevent recurrence.
- 22. © Operational Excellence Consulting EXAMPLE 1: 5 WHYS ANALYSIS 22 Symptom: The machine stopped! Causes: 2. The shaft wore down and seized up 3. Metal cutting chips penetrated the area 4. Chips passed through the lubrication system 5. There was no strainer on the inlet pipe from the tank 1. The circuit overload tripped 1st Why 2nd Why 3rd Why 4th Why 5th Why ILLUSTRATIVE
- 23. © Operational Excellence Consulting “ When we fail to grasp the systemic source of problems, we are left to ‘push on’ symptoms rather than eliminate underlying causes.” PETER SENGE 23 The Fifth Discipline
- 24. © Operational Excellence Consulting CAUSE & EFFECT DIAGRAM (MANUFACTURING) 24 EFFECT CAUSES S u b - c a u s e Cause Machines Measurements Materials Methods Environment Manpower Problem Statement
- 25. © Operational Excellence Consulting HIGH SCRAP OF BARCODE LABELS MAN MACHINE MATERIAL METHOD Handling Wrinkled Torn Improper training Machine Breakdown Ineffective adhesive Illegible Smear Printwheel Dirty Worn Ribbon Design of label Damage Poor printing Improper storage Wrong orientation Process changes Improper storage Size of label Process changes EXAMPLE 1: CAUSE AND EFFECT DIAGRAM FOR “HIGH SCRAP OF BARCODE LABELS” ILLUSTRATIVE
- 26. © Operational Excellence Consulting EXAMPLE: HISTOGRAM OF TURNAROUND TIMES ILLUSTRATIVE Histogram of Pharmacy Drug Dispensing Turnaround Times 50 40 60 30 10 0 20 0 - 10 11 - 20 21 - 30 31 - 40 41 - 50 51 - 60 61 - 70 71 - 80 81 - 90 91 - 100 Frequency Turnaround Time (mins) 26
- 27. © Operational Excellence Consulting ● Clearly label and define the axes to convey meaningful relationships ● Include descriptive titles for clarity on the purpose of the scatter plot ● Use distinct symbols or colors for multiple data sets to avoid confusion SCATTER DIAGRAM: PRACTICAL TIPS ● Add trendlines to highlight patterns or relationships in the data ● Ensure the scaling of axes accurately represents the data range ● Provide explanations for any outliers or unusual data points on the scatter plot 27
- 28. © Operational Excellence Consulting EXAMPLE: AFFINITY DIAGRAM OF LATE ORDERS 28 Orders Consistently Late Last Quarter Communications Issues Sales & Marketing Fail to alert when price changes may affect volume Inconsistent adherence to due dates Fail to check production schedule before promising product Manufacturing Fail to keep production schedule updated Fail to keep inventory updated Fail to communicate unscheduled equipment down-time Equipment Issues Equipment Breakdown Inconsistent adherence to maintenance dates Equipment operated outside of specifications Old equipment, due to be replaced, not operating at peak capacity External Factors Major Supplier Filed for Bankruptcy Just-in-time inventory system failed Lack of inventory affects 60 orders New supplier overloaded with new clients ILLUSTRATIVE
- 29. © Operational Excellence Consulting CONTROL CHART SELECTION 29 TYPE OF DATA Attribute Data Count Classification Defects Defectives Equal subgroup size Different (or same) subgroup size Equal subgroup size Different (or same) subgroup size c-Chart u-Chart np-Chart p-Chart Subgroup size of 1 Subgroup size 2-9 Subgroup size >9 ImR Xbar & R Xbar & S Variable Data Poisson distribution Binomial distribution Normal distribution/ Central Limit Theorem
- 30. © Operational Excellence Consulting p-, np-, c-, AND u-CHARTS CREATION 30 1. Sampling Plan: Determine the appropriate sampling plan. 2. Data Collection: Collect sample data at specified intervals. 3. Metric Calculation: Calculate relevant metric (n, np, c, or u). Calculate appropriate centerline. 4. Plotting: Plot the data. 5. Control Limits: After 20+ measurements, calculate control limits. Take action if the chart is out of control.
- 31. © Operational Excellence Consulting 31 RELATIONS DIAGRAM: WHEN TO USE Process Optimization In process improvement projects to map out interactions. Systems Thinking When adopting a systems thinking approach to problem- solving. Interdisciplinary Collaboration When multiple disciplines or teams collaborate on a project.
- 32. © Operational Excellence Consulting EXAMPLE: RELATIONSHIPS AMONG CAUSES OF LOW CUSTOMER SATISFACTION 32 ILLUSTRATIVE HR Management 3/0 Lack of Training 1/1 Bad Hiring 1/1 Low Staffing 2/1 Unskilled Employees 4/2 Bad Design 2/1 Wrong Answers 1/1 Poor Support 1/4 Long Hold Times 1/1 Faulty Market Surveys 1/1 Poor Materials 1/1 Low Quality Product 1/3 Ineffective Marketing 1/1 High Pricing 2/1 Low Customer Satisfaction 0/3
- 33. © Operational Excellence Consulting EXAMPLE 1: RISK BREAKDOWN STRUCTURE 33 Project Risks Technical Requirements Technology Complexity External Subcontractors Regulatory Market Customer Weather Organizational Project Dependencies Resources Funding Prioritization Project Management Estimating Planning Controlling Communication ILLUSTRATIVE Vertical Tree Diagram
- 34. © Operational Excellence Consulting EXAMPLE 2: PERFORMING 5 WHYS ANALYSIS 34 Late Pack Change Technical Problem MRP Parameter Wrong Short Lead Time Order Printing Problem Wrong Specification Production Problem Storage / Handling Problem Late Order from Supplier Schedule Error Documentation Error Damaged Packs QC Hold Late Delivery from Supplier LATE DELIVERY TO CUSTOMER Production Problem WHY? WHY? WHY? WHY? WHY? WHY? WHY? WHY? KEEP ON ASKING WHY? ILLUSTRATIVE Horizontal Tree Diagram
- 35. © Operational Excellence Consulting EXAMPLE 1: L-SHAPED MATRIX DIAGRAM 35 Cost Handling Features Compact Size Quality of Shots Nikon F4 ¢ ¤ Δ ¤ Nikon F90 Δ ¢ ¤ ¤ Nikon FM2 Δ Δ ¤ ¢ Nikon F50 ¤ Δ Δ ¢ Nikon F-601 ¢ ¤ Δ ¤ Evaluation of Cameras Criteria Camera Model Key: ¤ Strong Relationship ¢ Average Relationship Δ Weak Relationship ILLUSTRATIVE
- 36. © Operational Excellence Consulting EXAMPLE 1: CRITICAL PATH METHOD 36 ILLUSTRATIVE 10 30 20 50 40 A B C E D F T=3 wk T=1 wk T=3 wk T=4 wk T=2 wk T=3 wk Arrow Diagram
- 37. © Operational Excellence Consulting EXAMPLE: PDPC FOR VACATION PLANNING 37 Can’t agree All sites already full Can’t get time off work As vacation approaches, get too busy to leave Will choose same date as everyone else - crowds All hotels already full Won’t be able to find quality hotel in site area Choose vacation site Choose vacation date Choose hotel Make arrangements for absence Make basic choices PLANNING A VACATION Research Develop budget Start discussing sites early Choose off-peak date and inform work in advance Go to site with many hotels to choose from ILLUSTRATIVE
- 38. © Operational Excellence Consulting 5W2H: QUESTIONS TO EXPLORE 38 Description What? § Describe the problem adequately. § What is the defect and gap from “target”? § What part or object is involved? § Does the severity of the problem vary? Why? § Define why this is a problem for the Customer or organization. § Translates “how big” into total business impact. When? § Identify the time when the problem started and past history (trends). § Do all production shifts experience the same frequencies? § What time of the year does the problem occur? § When did the nonconformance occur? § What was operating time? § What shift? § What season? Description Where? § If the defect occurs on a part, where is the defect located? Use a location check sheet. § Where was the defect found (geographically)? § What is the geographic distribution of complaints? Who? § Identify who is associated with the problem. § Which customer(s) are complaining? § Which internal group(s) are complaining? How? § In what mode of operation was the problem discovered? § What procedures were being used? § What environmental conditions were present? How Much? § Quantify the extent and severity of the problem (quantity, percent, cost, DPMO, etc.)
- 39. © Operational Excellence Consulting “ Quality is not an act, it is a habit.” ARISTOTLE 39
- 40. © Operational Excellence Consulting Operational Excellence Consulting is a management training and consulting firm that assists organizations in improving business performance and effectiveness. Based in Singapore, the firm’s mission is to create business value for organizations through innovative design and operational excellence management training and consulting solutions. For more information, please visit www.oeconsulting.com.sg ABOUT OPERATIONAL EXCELLENCE CONSULTING