Downloaded 101 times
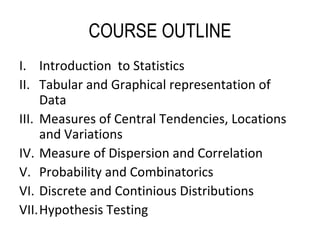

This document provides an outline for a course on probability and statistics. It begins with an introduction to statistics, including definitions and general uses. It then discusses topics that will be covered, such as measures of central tendency, probability, discrete and continuous distributions, and hypothesis testing. References for textbooks are also provided. The document differentiates between descriptive and inferential statistics. It defines key statistical concepts such as population, sample, variable, and the different variable types. It also covers the different scales of measurement for variables. An assignment is included asking students to list statisticians' contributions, give a real-life application example, and define independent and dependent variables.