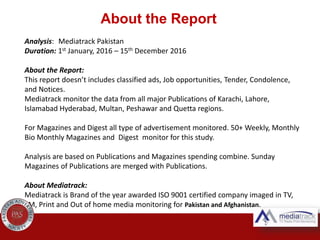
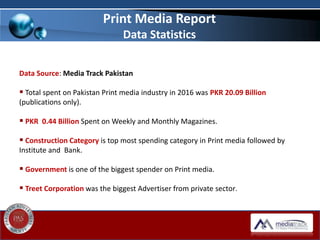
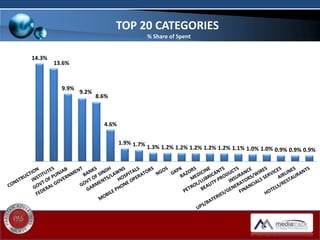
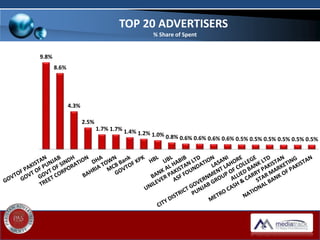
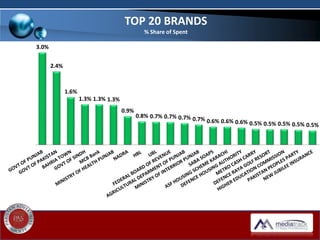
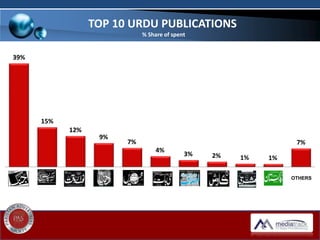
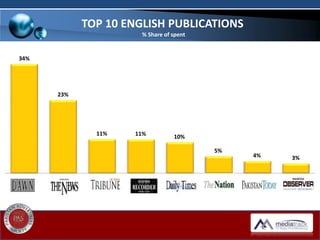
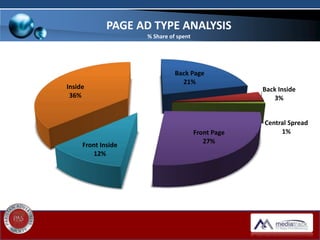
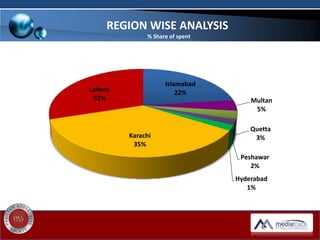
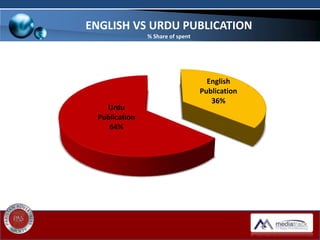
Annual PRINT INDUSTRY REPORT gives the overall picture of advertising on Newspapers and Magazines for the period Jan-Dec’16. It covers top advertisers, categories and brands, newspapers, magazines and their % share in total advertising.
Data Source: Media Track Pakistan
Period: Jan 2014 – Dec 2014
- Total spent on Pakistan Print media industry in 2014 was PKR 11.10 Billion (publications only).
- PKR 0.40 Billion Spent on Weekly and Monthly Magazines.
- Education sector is top most spending category in Print media followed by Construction and Bank.
- Government is one of the biggest spender on Print media.
- MCB was the biggest Advertiser from private sector.
PRINT INDUSTRY REPORT gives the overall picture of advertising on Newspapers and Magazines for the period October 2015. It covers top advertisers, categories and brands, newspapers, magazines and their % share in total advertising.
PRINT INDUSTRY REPORT gives the overall picture of advertising on Newspapers and Magazines for the period September 2015. It covers top advertisers, categories and brands, newspapers, magazines and their % share in total advertising.
PRINT INDUSTRY REPORT gives the overall picture of advertising on Newspapers and Magazines for the period July 2016. It covers top advertisers, categories and brands, newspapers, magazines and their % share in total advertising.
Data Source: MediaTrack Pakistan
PRINT INDUSTRY REPORT gives the overall picture of advertising on Newspapers and Magazines for the period Jan-June 2016. It covers top advertisers, categories and brands, newspapers, magazines and their % share in total advertising.
This document summarizes print media analysis data from January 2017 in Pakistan. It monitors advertisement data from major publications in various regions of Pakistan, focusing on branded advertisements in English, Urdu and regional publications. It provides data on the percentage market share of major newspapers, magazines, banks, mobile operators and smartphone brands that advertised in January 2017. The data helps analyze trends in print media advertising across various industries in Pakistan.
PRINT INDUSTRY REPORT gives the overall picture of advertising on Newspapers and Magazines for the period March17. It covers top advertisers, categories and brands, newspapers, magazines and their % share in total advertising.
Data Source: Media Track
PRINT INDUSTRY REPORT gives the overall picture of advertising on Newspapers and Magazines for the period May 2017. It covers top advertisers, categories and brands, newspapers, magazines and their % share in total advertising.
Data Source: Media Track
Print Industry Report gives the overall picture of advertising on Newspapers and Magazines for the period Dec 16. It covers top advertisers, categories and brands, newspapers, magazines and their % share in total advertising.
This monthly report from Mediatrack Pakistan summarizes print media advertising spending in June 2016. It analyzes data from major publications in Karachi, Lahore, Islamabad, Hyderabad, and Multan, excluding classifieds. The top categories for ad spending were personal care products, food and beverages, telecom, automobiles, and education. The top advertisers and brands each had a 13% and 6% share of spending, respectively. Major Urdu and English publications are identified along with their percentage of total ad spending. Regional analysis shows the largest shares went to Karachi, Lahore, and Islamabad. Contact information is provided for queries.
PRINT INDUSTRY REPORT gives the overall picture of advertising on Newspapers and Magazines for the period August’15. It covers top advertisers, categories and brands, newspapers, magazines and their % share in total advertising.
PRINT INDUSTRY REPORT gives the overall picture of advertising in Newspapers and Magazines for the period Jan-June 2017. It covers top advertisers, categories and brands, newspapers, magazines and their % share in total advertising.
Data Source: Media Track
A snapshot of the Radio Industry – August 2015. Find out who’s leading the industry with radio campaigns? Who’s getting the best return from radio?
RADIO INDUSTRY REPORT gives the overall picture of advertising on RADIO during the month of Augut 2015. It covers top advertisers, categories, brands and FM Channels and their % share in total advertising in terms of minutes. The report also focuses on share of FM channels, share of each genre and ad-spend split over the time slots.
Data Source: MediaMiles
PRINT INDUSTRY REPORT gives the overall picture of advertising on Newspapers and Magazines for the period August 2016. It covers top advertisers, categories and brands, newspapers, magazines and their % share in total advertising.
Data Source: MediaTrack Pakistan
PRINT INDUSTRY REPORT gives the overall picture of advertising on Newspapers and Magazines for the period January 2016. It covers top advertisers, categories and brands, newspapers, magazines and their % share in total advertising.
PRINT INDUSTRY REPORT gives the overall picture of advertising on Newspapers and Magazines for the period August 2017. It covers top advertisers, categories and brands, newspapers, magazines and their % share in total advertising.
Data Source: Media Track
TV MONTHLY INDUSTRY REPORT gives the overall picture of advertising on TV for the period of August 2016. It covers top advertisers, categories and brands and their % share in total advertising in terms of minutes. The report also focuses on share of TV channels, share of each genre and ad-spend split over the time slots. The report also compares % advertising in minutes done by various advertisers on YOY basis.
Data Source: MediaBank
PRINT INDUSTRY REPORT gives the overall picture of advertising on Newspapers and Magazines for the period July 2017. It covers top advertisers, categories and brands, newspapers, magazines and their % share in total advertising.
Data Source: Media Track
PRINT INDUSTRY REPORT gives the overall picture of advertising on Newspapers and Magazines for the period April 2017. It covers top advertisers, categories and brands, newspapers, magazines and their % share in total advertising.
Data Source: Media Track
The analysis are based on Publications and Magazines. These analysis discribed the top Category, Player, Brand of the Month. Categories Share of Spend and many more...
The document summarizes advertising data collected by Mediatrack from print media in various regions of Pakistan. It provides data on the share of advertising spend across various categories like government organizations, mobile operators, banks, automakers, consumer goods companies, and others. For each category, it shows the top advertisers and their percentage of total advertising spend. The data covers advertising in both English and Urdu newspapers as well as magazines from major cities in Pakistan.
TV MONTHLY INDUSTRY REPORT gives the overall picture of advertising on TV for the period of May-June 2016. It covers top advertisers, categories and brands and their % share in total advertising in terms of minutes. The report also focuses on share of TV channels, share of each genre and ad-spend split over the time slots. The report also compares % advertising in minutes done by various advertisers on YOY basis.
This report summarizes radio advertising trends across three major cities in Pakistan from January to December 2011. Key findings include:
- Total radio advertising minutes increased 4% from 2010, with July seeing a significant rise.
- Karachi's share of minutes dropped from 64% to 47% while Islamabad increased from 6% to 24%.
- Top categories were telecom, beverages and financial institutions. Pepsi entered the top 10 players and brands lists.
- Advertising was fairly consistent across days but morning/evening drive-times were most popular slots.
TV, Print and FM media slum in Pakistan. The business is shifting to Digital & Social Media. Interesting analysis on shifting traditional media to social media.
A snapshot of the Radio Industry – June 2015. Find out who’s leading the industry with radio campaigns? Who’s getting the best return from radio?
RADIO INDUSTRY REPORT gives the overall picture of advertising on RADIO during the month of June 2015. It covers top advertisers, categories, brands and FM Channels and their % share in total advertising in terms of minutes. The report also focuses on share of FM channels, share of each genre and ad-spend split over the time slots.
Data Source: MediaMiles
This document analyzes radio advertising data from September 2017. It finds that telecom advertising had the largest share of total minutes. The Coca-Cola Export Corporation and Pepsi-Cola International were the top two advertisers. Coke Studio and Pepsi were the top two brands advertised. The analysis also breaks down advertising by city, time slot, and individual radio stations to identify patterns in brand clutter and average daily advertisements. Karachi had the largest share of total advertising and most advertisements per day. Morning and evening time slots attracted the most advertisers across all cities.
The document provides a monthly TV analysis report for July 2016. It summarizes key metrics on airtime, total advertising minutes, and share of minutes by top categories, players, brands, channels, genres, and time bands. The main findings are that airtime decreased 14.25% year-over-year but increased 21% versus June 2016, with news and entertainment being the top genres and after noon and prime time being the highest time bands.
TV CABLE INDUSTRY REPORT gives the overall picture of advertising on cable Tv during the period Jan’15 to Sep’15. It covers top advertisers, categories and brands and their % share in total advertising in terms of minutes along with comparison with 2014. The report also focuses on share of Cable TV channels and share of each city.
TV INDUSTRY REPORT gives the overall picture of advertising on TV during the period Jan’16 to Dec’16. It covers top advertisers, categories and brands and their % share in total advertising in terms of minutes along with comparison with 2015. The report also focuses on share of TV channels, share of each genre and ad-spend split over the time slots.
DATA SOURCE: MEDIA BANK PAKISTAN
BASE: Spot TVC’s
IMPORTANT: All the ranking are on the basis of minutes, which does not reflect the ranking on the basis of ad spend.
The Outdoor media Ad Ex report offers you an in-depth and accurate estimate of annual spending by different advertisers in your category as well the overall market. The report is based on Top 5 cities namely Karachi, Lahore, Rawalpindi/Islamabad, Faisalabad & Multan. The value estimates do not include creative non-permanent branding like round-abouts etc. Pole Sign values are also shared separately.
The Outdoor media Ad Ex report offers you an in-depth and accurate estimate of annual spending by different advertisers in your category as well the overall market. The report is based on Top 10 cities namely Karachi, Lahore, Rawalpindi/Islamabad, Faisalabad, Multan, Hyderabad, Sukkur, Sialkot, Gujranwala and Peshawar. The value estimates do not include creative non-permanent branding like round-abouts etc. Pole Sign values are also shared separately.
Data Source: Winning Solution
A JOINT RESEARCH STUDY OF PAS AND MEDIABANK PAKISTAN
TV MONTHLY INDUSTRY REPORT gives the overall picture of advertising on TV during the month of November 2016. It covers top advertisers, categories and brands and their % share in total advertising in terms of minutes. The report also focuses on share of TV channels, share of each genre and ad-spend split over the time slots. The report also compares % advertising in minutes done by various advertisers on YOY basis.
JOINT RESEARCH STUDY OF PAS AND MEDIABANK PAKISTAN
TV MONTHLY INDUSTRY REPORT gives the overall picture of advertising on TV during the month of January 2017. It covers top advertisers, categories and brands and their % share in total advertising in terms of minutes. The report also focuses on share of TV channels, share of each genre and ad-spend split over the time slots. The report also compares % advertising in minutes done by various advertisers on YOY basis.
TV INDUSTRY REPORT gives the overall picture of advertising on TV during the period Jan’14 to Dec’15. It covers top advertisers, categories and brands and their % share in total advertising in terms of minutes along with comparison with 2014. The report also focuses on share of TV channels, share of each genre and ad-spend split over the time slots.
DATA SOURCE: MEDIA BANK PAKISTAN
BASE: Spot TVC’s
IMPORTANT: All the ranking are on the basis of minutes, which does not reflect the ranking on the basis of ad spend.
Data Source: MediaTrack Pakistan
– Mediatrack monitor the top 15 TV Channels that covers more than 95% of total TV spend.
– In Afghanistan Government, Juices/Energy Drinks and Telco are amongst top 3 categories.
– Tolo TV, Shamshad and 1 TV are top 3 TV channels in afghanistan for the month of January.
– Pakistani players have 4% share of spend in total afghan market.
– Many Pakistani brands are operating in Afghanistan or its media releases from Pakistan like Unilever, Coke, Nestle, Huawei, Samsung, etc.
– 6:00 PM to 10:00 PM is most popular and high rated time-slots.
- Mediatrack monitors advertisements across major publications in various Pakistani regions, excluding classifieds. It scans 50+ weekly/monthly magazines.
- The top advertising sectors by spend are banks, institutes, and the Government of Punjab. The top cities for ad spend are Karachi, Lahore, and Islamabad.
- Sunday has the highest ad spending of all days of the week, with spending steadily increasing throughout the week and dipping on weekends.
PRINT INDUSTRY REPORT gives the overall picture of advertising on Newspapers for the period May’14. It covers top advertisers, categories and brands and their % share in total advertising.
A snapshot of the Radio Industry – May, 2014. Find out who’s leading the industry with radio campaigns? Who’s getting the best return from radio?
RADIO INDUSTRY REPORT gives the overall picture of advertising on RADIO during the month of May, 2014. It covers top advertisers, categories, brands and FM Channels and their % share in total advertising in terms of minutes. The report also focuses on share of FM channels, share of each genre and ad-spend split over the time slots.
Analysis: Media Miles – Radio Tracking
Note: Ad volume is based on minutes and ad occurrences. The figures should be taken only as indicative not as absolute figures.
The short film proposal outlines a story about a husband with drinking and depression problems, and a wife who is unhappy in their relationship. It will show how the wife manages to leave the relationship. The target audience is 25-45 year olds who may relate to being in a similar marriage situation. The film will be shot in the filmmaker's house to suit the private nature of the story. A small crew of classmates will help with production roles like camera, lighting, and sound. The filmmaker's parents will play the lead roles. No budget is available so the production will rely on borrowed equipment from the school.
This survey collected responses from customers who shop at HyperCITY. Most respondents were between 30-40 years old and were housewives. The majority shop once a month or occasionally. HyperCITY was the most popular store to shop for ladies wear. Biba was the most liked brand. Tunics/tops and kurtas between Rs. 499-599 were most popular purchases. Cotton churidars were considered most comfortable. Customers cited collection, price, quality and offers as reasons for shopping at HyperCITY. Suggestions for improvement included having more staff available, resolving size issues, and expanding product selection and ranges.
Your wife will have many considerations when looking for a new flat to buy. She will want the kitchen to be spacious with enough room for storage. The living room layout must allow their existing furniture to fit nicely and have adequate light and ventilation. Other important factors are a separate washing area, a spacious master bedroom and wardrobes, a designated pooja room, safe socket placement, good water quality, and quality wood furnishings. She will also check who the future neighbors might be.
Marketing research companies collect information on media habits through diary panels and people meters. They use samples of 600 households, with 45% in Karachi, 35% in Lahore, and 20% in Rawalpindi and Islamabad. TAM people meters were used to measure the popularity of GEO SUPER during the IPL by tracking viewership among its target 16-25 age group, finding it gained popularity as Pakistan's first sports channel to broadcast live IPL matches.
PRINT INDUSTRY REPORT gives the overall picture of advertising on Newspapers for the period April’14. It covers top advertisers, categories and brands and their % share in total advertising.
PRINT INDUSTRY REPORT gives the overall picture of advertising on Newspapers and Magazines for the period October 2016. It covers top advertisers, categories and brands, newspapers, magazines and their % share in total advertising.
Data Source: MediaTrack Pakistan
Economics is concerned with how scarce resources are allocated to maximize consumer satisfaction, producer profit, and social welfare. Microeconomics deals with individual economic units like households and firms. It addresses the central problems of what and how to produce goods and services, as well as who receives the outputs. Production possibility curves illustrate the tradeoffs between different goods that can be produced based on available resources and technology. They take a concave shape because resources become less productive when reallocated between goods.
PRINT INDUSTRY REPORT gives the overall picture of advertising on Newspapers for the period June’14. It covers top advertisers, categories and brands, newspapers, magazines and their % share in total advertising.
Print media analysis September 2015 from Pakistan Region Mediatrack Pakistan
PRINT INDUSTRY REPORT gives the overall picture of advertising on Newspapers and Magazines for the period September 2015. It covers top advertisers, categories and brands, newspapers, magazines and their % share in total advertising
PRINT INDUSTRY REPORT gives the overall picture of advertising on Newspapers and Magazines for the period July’15. It covers top advertisers, categories and brands, newspapers, magazines and their % share in total advertising.
The document provides a monthly print media analysis report for March. It includes statistics on ad spending in major newspapers and magazines across various cities in Pakistan. The top categories, advertisers, and brands are outlined by percentage of ad spend. Newspaper analysis looks at spending breakdown by page and city. Magazine analysis examines top categories, advertisers, and brands. The report concludes with contact information for queries.
PRINT INDUSTRY REPORT gives the overall picture of advertising on Newspapers and Magazines for the period June’15. It covers top advertisers, categories and brands, newspapers, magazines and their % share in total advertising.
This monthly print media report summarizes data from September 2014. It provides statistics on advertising spending broken down by category, advertiser, brand, publication type, language, and region. The top categories were cellular companies at 33%, banks and financial institutions at 10%, and cooking oil and ghee at 7%. The report also analyzes ad types, page positions, and shares of spending among major cellular companies, banks, and cooking oil brands. Most spending was on commercial ads in Urdu publications from Karachi and Lahore.
This document summarizes the findings of a summer internship project to develop strategies to increase visibility of Business Standard newspaper in key market areas of Lucknow, India. Key findings include low awareness of Business Standard compared to competitors, a preference among readers for sections on stocks/mutual funds. Recommendations focus on improving distribution, advertisements, supplements, and promotional activities targeting students and corporate clients.
PRINT INDUSTRY REPORT gives the overall picture of advertising on Newspapers and Magazines for the period Feb17. It covers top advertisers, categories and brands, newspapers, magazines and their % share in total advertising
Data Source: Mediatrack
Mediatrack Pakistan prepared iinteresting and informative Print media analysis for the Month of January from Pakistan market. for more information khi@mediatrackpk.com
Mediatrack monitor the print media data from Karachi, Lahore, Islamabad Hyderabad ,Multan, Peshawar & Quetta regions.
Mediatrack monitor all type of Ads including Classified, Notices, Job opportunity and Tender etc along with branded Ads.
But in this report focused only branded category Ads from English, Urdu & Regional Publications.
For Magazines and Digest all type of advertisement monitored. Weekly / Monthly / Bimonthly Magazines and Digest monitor for this study.
The document analyzes the performance of Vietnam's manufacturing sector from 2006-2016 using various metrics and benchmarking against other countries. It finds that while Vietnam has improved its competitiveness ranking significantly, it still lags behind countries like South Korea. Manufacturing value-added as a percentage of GDP remains the lowest among comparators. However, manufactured exports have accelerated and Vietnam's share of manufactured exports in total exports is higher than other ASEAN members. Going forward, Vietnam needs to focus on increasing the domestic value-added content of exports as foreign value-added content is rising.
The data in this report and previous reports is collected directly from advertising and media agencies through a anonymous process to ensure confidentiality to client’s information. The information they submit is based on their internal records of advertising spending.
The Outdoor media Ad Ex report offers you an in-depth and accurate estimate of spending in the Outdoor media by different advertiser in your category as well the overall market. The outdoor media ad-ex is calculated for the top 5 cities by visiting all the permanent assets as well as pole signs twice a month every month. Value estimates are collected from different major OMAs and average market rates are calculated accordingly.
Market Research Reports, Inc. has announced the addition of “Global Tea Market 2016 - 2020” research report to their offering. See more at - http://mrr.cm/J5C
2014 China New Media Content Marketing and ROI Measurement - News Release: Cy...Advangent
This document summarizes a report on content marketing and ROI measurement in China in 2014. It discusses the cycles, frequencies, types and methods of news releases by Chinese enterprises. Regarding cycles, most companies release news continuously. On frequencies, over half of automotive and tech companies released over 50 and 100 news items respectively in the past year. As for types, releases on promotional events decreased while cooperation news increased. Finally, the document outlines key performance indicators (KPIs) companies use to measure news releases, such as reprints, search engine optimization, and social media visibility.
2016 VC Executive Compensation Trend ReportLewis Lin 🦊
The document summarizes key findings from a 2016 executive compensation survey of over 1,500 private companies. It finds that the number of participating companies and executive jobs increased by 19% and 18% respectively from 2015. The San Francisco Bay Area remained the largest represented region. Most companies were in the technology sector, especially enterprise software, and had raised post-Series A funding. Median CEO compensation was lower for founders than non-founders, while founders held substantially more equity.
The document provides a print media analysis for March 2014 based on data from major publications and magazines in Pakistan. It summarizes spending amounts and market shares for the top 20 brands, sub-categories, main categories, and publications. Key findings include that Telenor had 67% of spending in the mobile phone operators category, and Tapal tea had 5% spending share compared to other major tea brands being silent. The analysis also identifies unexpected active advertisers across various industries such as airlines, paint companies, pharmaceutical firms, and garment brands.
Pakistan print media industry analysis for Jan to Jun 2017Mediatrack Pakistan
Mediatrack one of the leading media monitoring and media audit firm in Pakistan. We monitor the print media data from Karachi, Lahore, Islamabad Hyderabad ,Multan, Peshawar & Quetta regions.
Mediatrack monitor all type of Ads including Classified, Notices, Job opportunity and Tender etc along with branded Ads from
English, Urdu & Regional Publications.
For Magazines and Digest all type of advertisement monitored. Weekly / Monthly / Bimonthly Magazines and Digest monitor for this study.
The document compares the 2016 brand valuation league tables from Interbrand, Millward Brown, and Brand Finance, finding little consistency between the three, with only 37 brands appearing on all three lists and valuations of the same brand differing by an average of 2.4x. While brand valuation methodologies are conceptually robust, significant subjectivity exists in how each calculates brand values. The inconsistency undermines using brand valuation to prove the business value of marketing.
Winning Solutions is one of the leading market research organizations in Pakistan with operations across different cities and a spread of outdoor media tracking in over 60 cities. The Outdoor Media Ad-Ex report is based on a site census done by Winning Solutions in Top 5 cities of Pakistan in 2014 which is updated twice a month with Ad-Ex data collection. We cover over 5000 permanent structures and over 4500 pole signs twice a month every month. The market rates are updated and reviewed every month and aligned with average market rates for each road, section, location as well as site.
Analysis by: Winning Solutions
A snapshot of the Radio Industry – July 2017. Find out who’s leading the industry with radio campaigns? Who’s getting the best return from the radio?
RADIO INDUSTRY REPORT gives the overall picture of advertising on RADIO during the month of July 2017. It covers top advertisers, categories, brands and FM Channels and their % share in total advertising in terms of minutes. The report also focuses on the share of FM channels, share of each genre and ad-spend split over the time slots.
Data Source: MediaMiles
A snapshot of the Radio Industry – June 2017. Find out who’s leading the industry with radio campaigns? Who’s getting the best return from the radio?
RADIO INDUSTRY REPORT gives the overall picture of advertising on RADIO during the month of June 2017. It covers top advertisers, categories, brands and FM Channels and their % share in total advertising in terms of minutes. The report also focuses on the share of FM channels, share of each genre and ad-spend split over the time slots.
Data Source: MediaMiles
A snapshot of the Radio Industry – May 2017. Find out who’s leading the industry with radio campaigns? Who’s getting the best return from the radio?
RADIO INDUSTRY REPORT gives the overall picture of advertising on RADIO during the month of May 2017. It covers top advertisers, categories, brands and FM Channels and their % share in total advertising in terms of minutes. The report also focuses on the share of FM channels, share of each genre and ad-spend split over the time slots.
Data Source: MediaMiles
JOINT RESEARCH STUDY OF PAS AND Media Monitors PAKISTAN
TV MONTHLY INDUSTRY REPORT gives the overall picture of advertising on TV during the month of April 2017. It covers top advertisers, categories and brands and their % share in total advertising in terms of minutes. The report also focuses on share of TV channels, share of each genre and ad-spend split over the time slots.
This document provides a monthly TV analysis report for March 2017. It summarizes the top advertising categories, players, brands, channels and time bands. The key findings are:
- Beverages were the top advertising category with 28% of ad minutes. The top players were brands 1, 2 and 3 with 28%, 13% and 13% of minutes respectively.
- Advertising minutes in March 2017 increased 20.29% compared to March 2016 and 2.76% compared to February 2017.
- News programming received the highest share of advertising at 45% while entertainment was second highest at 40%. Prime time bands from 7-10pm received the most advertising.
This document is a mobile statpack from eMarketer that provides statistics and forecasts about mobile device usage, mobile commerce, and mobile marketing in the United States. It contains information on topics such as the reach of mobile devices, the growth of mobile shoppers and buyers, the influence of mobile on commerce, and metrics related to mobile commerce performance. The statpack is broken into three sections on mobile device reach, mobile shoppers and buyers, and mobile commerce influence and performance, and provides charts, statistics, and forecasts on each topic.
JOINT RESEARCH STUDY OF PAS AND MEDIABANK PAKISTAN
TV MONTHLY INDUSTRY REPORT gives the overall picture of advertising on TV during the month of February 2017. It covers top advertisers, categories and brands and their % share in total advertising in terms of minutes. The report also focuses on share of TV channels, share of each genre and ad-spend split over the time slots. The report also compares % advertising in minutes done by various advertisers on YOY basis.
A JOINT RESEARCH STUDY OF PAS AND MEDIABANK PAKISTAN
TV MONTHLY INDUSTRY REPORT gives the overall picture of advertising on TV during the month of October 2016. It covers top advertisers, categories and brands and their % share in total advertising in terms of minutes. The report also focuses on share of TV channels, share of each genre and ad-spend split over the time slots. The report also compares % advertising in minutes done by various advertisers on YOY basis.
The document provides a monthly TV analysis report for October 2016, including data on total advertising minutes, comparisons to previous months and years, top advertising categories, advertisers, brands, channels by genre and time bands. Advertising airtime decreased both year-over-year and month-over-month in October 2016, with news and entertainment making up the largest genres by share of advertising minutes.
Beyond the Basics of A/B Tests: Highly Innovative Experimentation Tactics You...Aggregage
This webinar will explore cutting-edge, less familiar but powerful experimentation methodologies which address well-known limitations of standard A/B Testing. Designed for data and product leaders, this session aims to inspire the embrace of innovative approaches and provide insights into the frontiers of experimentation!
The Ipsos - AI - Monitor 2024 Report.pdfSocial Samosa
According to Ipsos AI Monitor's 2024 report, 65% Indians said that products and services using AI have profoundly changed their daily life in the past 3-5 years.
The Building Blocks of QuestDB, a Time Series Databasejavier ramirez
Talk Delivered at Valencia Codes Meetup 2024-06.
Traditionally, databases have treated timestamps just as another data type. However, when performing real-time analytics, timestamps should be first class citizens and we need rich time semantics to get the most out of our data. We also need to deal with ever growing datasets while keeping performant, which is as fun as it sounds.
It is no wonder time-series databases are now more popular than ever before. Join me in this session to learn about the internal architecture and building blocks of QuestDB, an open source time-series database designed for speed. We will also review a history of some of the changes we have gone over the past two years to deal with late and unordered data, non-blocking writes, read-replicas, or faster batch ingestion.
Predictably Improve Your B2B Tech Company's Performance by Leveraging DataKiwi Creative
Harness the power of AI-backed reports, benchmarking and data analysis to predict trends and detect anomalies in your marketing efforts.
Peter Caputa, CEO at Databox, reveals how you can discover the strategies and tools to increase your growth rate (and margins!).
From metrics to track to data habits to pick up, enhance your reporting for powerful insights to improve your B2B tech company's marketing.
- - -
This is the webinar recording from the June 2024 HubSpot User Group (HUG) for B2B Technology USA.
Watch the video recording at https://youtu.be/5vjwGfPN9lw
Sign up for future HUG events at https://events.hubspot.com/b2b-technology-usa/
Codeless Generative AI Pipelines
(GenAI with Milvus)
https://ml.dssconf.pl/user.html#!/lecture/DSSML24-041a/rate
Discover the potential of real-time streaming in the context of GenAI as we delve into the intricacies of Apache NiFi and its capabilities. Learn how this tool can significantly simplify the data engineering workflow for GenAI applications, allowing you to focus on the creative aspects rather than the technical complexities. I will guide you through practical examples and use cases, showing the impact of automation on prompt building. From data ingestion to transformation and delivery, witness how Apache NiFi streamlines the entire pipeline, ensuring a smooth and hassle-free experience.
Timothy Spann
https://www.youtube.com/@FLaNK-Stack
https://medium.com/@tspann
https://www.datainmotion.dev/
milvus, unstructured data, vector database, zilliz, cloud, vectors, python, deep learning, generative ai, genai, nifi, kafka, flink, streaming, iot, edge
06-04-2024 - NYC Tech Week - Discussion on Vector Databases, Unstructured Data and AI
Round table discussion of vector databases, unstructured data, ai, big data, real-time, robots and Milvus.
A lively discussion with NJ Gen AI Meetup Lead, Prasad and Procure.FYI's Co-Found
06-04-2024 - NYC Tech Week - Discussion on Vector Databases, Unstructured Data and AI
Discussion on Vector Databases, Unstructured Data and AI
https://www.meetup.com/unstructured-data-meetup-new-york/
This meetup is for people working in unstructured data. Speakers will come present about related topics such as vector databases, LLMs, and managing data at scale. The intended audience of this group includes roles like machine learning engineers, data scientists, data engineers, software engineers, and PMs.This meetup was formerly Milvus Meetup, and is sponsored by Zilliz maintainers of Milvus.
2. Analysis: Mediatrack Pakistan
Duration: 1st January, 2016 – 15th December 2016
About the Report:
This report doesn’t includes classified ads, Job opportunities, Tender, Condolence,
and Notices.
Mediatrack monitor the data from all major Publications of Karachi, Lahore,
Islamabad Hyderabad, Multan, Peshawar and Quetta regions.
For Magazines and Digest all type of advertisement monitored. 50+ Weekly, Monthly
Bio Monthly Magazines and Digest monitor for this study.
Analysis are based on Publications and Magazines spending combine. Sunday
Magazines of Publications are merged with Publications.
About Mediatrack:
Mediatrack is Brand of the year awarded ISO 9001 certified company imaged in TV,
FM, Print and Out of home media monitoring for Pakistan and Afghanistan.
About the Report
3. Data Source: Media Track Pakistan
Total spent on Pakistan Print media industry in 2016 was PKR 20.09 Billion
(publications only).
PKR 0.44 Billion Spent on Weekly and Monthly Magazines.
Construction Category is top most spending category in Print media followed by
Institute and Bank.
Government is one of the biggest spender on Print media.
Treet Corporation was the biggest Advertiser from private sector.
Print Media Report
Data Statistics
9. 34%
23%
11% 11% 10%
5%
4% 3%
DAILY DAWN THE NEWS EXPRESS TRIBUNE BUSINESS RECORDER DAILY TIMES THE NATION PAKISTAN TODAY PAKISTAN OBSERVER
TOP 10 ENGLISH PUBLICATIONS
% Share of spent
17. For query on DATA, please contact:
Mediatrack House, E-107, Gulshan-e-Jamal, Rashid Minhas Road, off
Main Sharah-e-Faisal, Karachi, Pakistan.
For other queries, please contact PAS at:
secretariat@pas.org.pk
Mr. Arshad Bhatti
khi@mediatrackpk.com
Phone: +9221-34289818-9
THE END