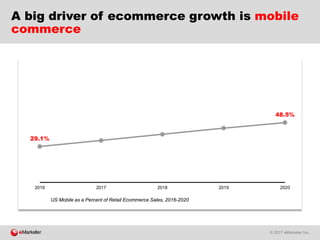
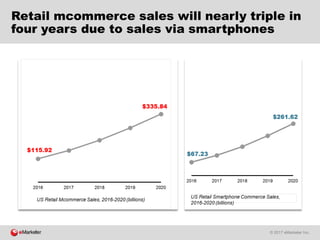
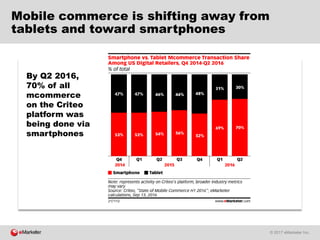
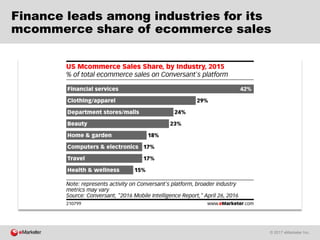
© 2017 eMarketer Inc. 1
eMarketer US
Mobile StatPack
Presented by
January 2017
One purchase isn’t enough. To win today’s
customer journey, you need to build the
kinds of strong, sustainable relationships
that drive serious ROI and support long-term
marketing success.
CHECK OUT OUR ECOMMERCE KIT FOR:
• Winning tactics from top brands
• Effective campaign strategies
• Tips on building powerful, personalized
lifecycle campaigns
TREAT EVERY
CUSTOMER
LIKE THEY’RE
THE ONLY ONE
A P P B OY. C O M / M O B I L E - S TAT SY O U R M A R K E T I N G, B E T T E R.
Personalizing push
and email boosts
purchases and other
conversions by at least
27%
*
SOURCE:APPBOYPROPRIETARYDATA
© 2017 eMarketer Inc. 3
Overview
 US mobile device reach
 Mobile shoppers and buyers
 Mcommerce influence
The eMarketer US Mobile StatPack contains charts, key stats, trends
and forecasts that you can keep at your fingertips all year long.
The StatPack is broken out into three sections:
© 2017 eMarketer Inc.
US Mobile Device Reach
© 2017 eMarketer Inc.
Mobile Devices Are Nearly Ubiquitous
81.4%
More than 80% of the US
population has a mobile phone,
according to eMarketer data.
That includes individuals of any
age, including those ages 0-11.
© 2017 eMarketer Inc.
By some measures, mobile is more common
than TV
According to GfK MRI
data, among those 18
and older, 95.1% have
mobile phones,
compared to 89.1% who
had watched TV at least
once in the past week.
© 2017 eMarketer Inc.
Mobile has surpassed desktop in access to
the internet
According to the GfK MRI
data, more people go
online via mobile phone
than via desktop/laptop.
© 2017 eMarketer Inc.
Mobile internet use is most common among
the young and the higher earners
Penetration stood at
49.2% for the least-
affluent homes,
compared with 88.1% of
those at the top end of
the income scale.
Mobile internet usage
also declined with
increasing age, GfK MRI
found.
© 2017 eMarketer Inc.
Mobile Shoppers and Buyers
© 2017 eMarketer Inc.
Mobile shoppers will be virtually
synonymous with digital shoppers by 2020
88.5%
98.4%
70%
2016 2017 2018 2019 2020
US Mobile Shoppers as a Percent of
Digital Shoppers, 2016-2020
Definition: ages 14+; mobile
shoppers are internet users who
have browsed, researched or
compared products digitally via any
device during the calendar year but
have not necessarily bought digitally
© 2017 eMarketer Inc.
Mobile shoppers are increasingly willing to
buy on their devices
121.8
136.3
147.3
155.5
162.8
168.7
2015 2016 2017 2018 2019 2020
US Mobile Buyers, 2015-2020 (millions)
77.2%
85.8%
2016 2017 2018 2019 2020
US Mobile Buyers as a Percent of
Digital Buyers, 2016-2020
Definition: ages 14+; mobile
buyers are mobile device
users who have used their
mobile device to make at
least one purchase via web
browser or mobile app
during the calendar year
© 2017 eMarketer Inc.
A big driver of ecommerce growth is mobile
commerce
29.1%
48.5%
2016 2017 2018 2019 2020
US Mobile as a Percent of Retail Ecommerce Sales, 2016-2020
© 2017 eMarketer Inc.
Retail mcommerce sales will nearly triple in
four years due to sales via smartphones
© 2017 eMarketer Inc.
Mobile commerce is shifting away from
tablets and toward smartphones
By Q2 2016,
70% of all
mcommerce
on the Criteo
platform was
being done via
smartphones
© 2017 eMarketer Inc.
Finance leads among industries for its
mcommerce share of ecommerce sales
© 2017 eMarketer Inc.
Within retail, video games, consoles and
accessories lead as mobile purchases
94%
89%
89%
76%
72%
54%
49%
41%
6%
11%
11%
24%
28%
46%
51%
59%
0% 100%
Desktop Mobile
Computers/peripherals/PDAs
Consumer electronics
US Ecommerce Sales, by Device, Q3 2016
Home  garden
Apparel  accessories
CPG
Jewelry  watches
Toys  hobbies
Video games/consoles/
accessories
Source: comScore, eCommerce and Mcommerce Measurement, Nov 2016
© 2017 eMarketer Inc.
Mcommerce Performance
© 2017 eMarketer Inc.
Mobile now influences more than a third of
total retail sales in the US
*A retail sale is “influenced” by mobile if the consumer
discovers, searches for, researches or price compares
the product during the purchase path
Source: Deloitte, Sep 2016
37%
of US retail sales in 2016
were influenced* by
mobile, which translated to
$1.4 trillion in sales
© 2017 eMarketer Inc.
The majority of online shopping traffic is
mobile, with most coming from smartphones
61.4%
47.7%
24.1%
40.3%
14.5% 12.0%
Q3 2015 Q4 2015 Q1 2016 Q2 2016 Q3 2016
Desktop/laptop
Smartphone
Tablet
US Ecommerce Traffic Share, Q3 2015-Q3 2016
Source: Monetate, Nov 2016
© 2017 eMarketer Inc.
In late 2015, mobile was the majority source
of traffic for the first time
© 2017 eMarketer Inc.
Factors that affect a smartphone's
conversion rate:
 Device type
 Screen size
 Operating system
 Load time
© 2017 eMarketer Inc.
Load time is a crucial factor in mobile
conversions
Source: SOASTA, Sep 2015
1.9%
0.6%
0.0%
1.0%
2.0%
3.0%
2.4 3.3 3.6 4.2 4.8 5.7 6.6
Mobile Conversion Rates, by Load Time Speed (in seconds)
© 2017 eMarketer Inc.
Any page elements that slow load time
reduce conversions
19
31
Converted Unconverted
Average Number of Images for Mobile Sites,
Converted vs. Unconverted (images per page)
Source: Google/SOASTA via Think with Google, July 2016
© 2017 eMarketer Inc.
The majority of retail mcommerce orders
comes via iOS users
© 2017 eMarketer Inc.
Apps outperform mobile web
App conversion
rates are
3X
higher than
mobile web
conversion rates
Mobile Web
47.0%
54.0%
40%
Q2 2015 Q2 2016
$91
$127
$98
$95
75
150
Q2 2015 Q2 2016
Mobile web
Apps
Source: Criteo, H1 2016
App Share of Global Retail Mobile
Transactions
Average Order Value, by Channel
© 2017 eMarketer Inc.
Half of US internet users on mobile visit
Amazon to research products
MONETIZING MOBILE SHOPPERS:
WHAT BRANDS NEED TO KNOW
71%
RECOMMENDATIONS HAVE THEIR PLACES, BUT SHOPPERS
REALLY WANT A DEAL
I like in-app/in-browser messages that contain...
While a product reco can nudge some users to buy, once they’re in
your app, people would rather see a deal or promotion.
ABANDONED CARTS ARE NORMAL—
AND DON’T MEAN SHOPPERS HAVE
LOST INTEREST
When shopping online, I put items
in my cart that I intend to purchase,
but I don’t check out immediately.
SOMETIMES / 32%
ALWAYS / 21%
RARELY / 11%
NEVER / 4%
OFTEN / 32%
PEOPLE LIKE CUSTOMIZED
MESSAGES, BUT NOT
ALL PERSONALIZATION IS
CREATED EQUAL
Online shoppers would rather have
outreach customized based on their
local weather instead of their name.
CUSTOMIZED BY WEATHER
CUSTOMIZED BY NAME
IF YOU WANT TO ENGAGE SHOPPERS, DON’T
BURY THEM IN MESSAGES
If you never accept push, why not?
TOO MANY MESSAGES
MESSAGES AREN’T RELEVANT
OTHER
MESSAGE RECEIVED AT INCONVENIENT TIMES
PREFER SUGGESTIONS
PREFER PROMOS69%
27%
GET YOUR RESULTS
S E E H O W Y O U R M A R K E T I N G E F F O R T S S TA C K U P W I T H A P P B O Y ’ S D I G I T S M O B I L E M A R K E T I N G B E N C H M A R K S
W E B T O O L . C H O O S E “ R E TA I L + E C O M M E R C E ” F R O M T H E I N D U S T R Y TA B T O G E T S TA R T E D .
56%
Be careful with push—using this channel
to send too many messages is the #1
reason shoppers disable it.
SOURCE:APPBOYCONSUMERSTUDYVIAPOLLFISH.COM
85%
© 2017 eMarketer Inc. 28
Methodology
Estimates are based on the analysis of survey and traffic data from research firms and
regulatory agencies; historical trends; internet and mobile adoption trends; and country-
specific demographic and socioeconomic factors. eMarketer’s forecasts and estimates are
based on an analysis of quantitative and qualitative data from research firms, government
agencies, media firms and public companies, plus interviews with top executives at
publishers, ad buyers and agencies.
Data is weighted based on methodology and soundness. Each eMarketer forecast fits within
the larger matrix of all its forecasts, with the same assumptions and general framework used
to project figures in a wide variety of areas. Regular reevaluation of available data means the
forecasts reflect the latest business developments, technology trends and economic changes.

Mobile StatPack

  • 1.
    © 2017 eMarketerInc. 1 eMarketer US Mobile StatPack Presented by January 2017
  • 2.
    One purchase isn’tenough. To win today’s customer journey, you need to build the kinds of strong, sustainable relationships that drive serious ROI and support long-term marketing success. CHECK OUT OUR ECOMMERCE KIT FOR: • Winning tactics from top brands • Effective campaign strategies • Tips on building powerful, personalized lifecycle campaigns TREAT EVERY CUSTOMER LIKE THEY’RE THE ONLY ONE A P P B OY. C O M / M O B I L E - S TAT SY O U R M A R K E T I N G, B E T T E R. Personalizing push and email boosts purchases and other conversions by at least 27% * SOURCE:APPBOYPROPRIETARYDATA
  • 3.
    © 2017 eMarketerInc. 3 Overview  US mobile device reach  Mobile shoppers and buyers  Mcommerce influence The eMarketer US Mobile StatPack contains charts, key stats, trends and forecasts that you can keep at your fingertips all year long. The StatPack is broken out into three sections:
  • 4.
    © 2017 eMarketerInc. US Mobile Device Reach
  • 5.
    © 2017 eMarketerInc. Mobile Devices Are Nearly Ubiquitous 81.4% More than 80% of the US population has a mobile phone, according to eMarketer data. That includes individuals of any age, including those ages 0-11.
  • 6.
    © 2017 eMarketerInc. By some measures, mobile is more common than TV According to GfK MRI data, among those 18 and older, 95.1% have mobile phones, compared to 89.1% who had watched TV at least once in the past week.
  • 7.
    © 2017 eMarketerInc. Mobile has surpassed desktop in access to the internet According to the GfK MRI data, more people go online via mobile phone than via desktop/laptop.
  • 8.
    © 2017 eMarketerInc. Mobile internet use is most common among the young and the higher earners Penetration stood at 49.2% for the least- affluent homes, compared with 88.1% of those at the top end of the income scale. Mobile internet usage also declined with increasing age, GfK MRI found.
  • 9.
    © 2017 eMarketerInc. Mobile Shoppers and Buyers
  • 10.
    © 2017 eMarketerInc. Mobile shoppers will be virtually synonymous with digital shoppers by 2020 88.5% 98.4% 70% 2016 2017 2018 2019 2020 US Mobile Shoppers as a Percent of Digital Shoppers, 2016-2020 Definition: ages 14+; mobile shoppers are internet users who have browsed, researched or compared products digitally via any device during the calendar year but have not necessarily bought digitally
  • 11.
    © 2017 eMarketerInc. Mobile shoppers are increasingly willing to buy on their devices 121.8 136.3 147.3 155.5 162.8 168.7 2015 2016 2017 2018 2019 2020 US Mobile Buyers, 2015-2020 (millions) 77.2% 85.8% 2016 2017 2018 2019 2020 US Mobile Buyers as a Percent of Digital Buyers, 2016-2020 Definition: ages 14+; mobile buyers are mobile device users who have used their mobile device to make at least one purchase via web browser or mobile app during the calendar year
  • 12.
    © 2017 eMarketerInc. A big driver of ecommerce growth is mobile commerce 29.1% 48.5% 2016 2017 2018 2019 2020 US Mobile as a Percent of Retail Ecommerce Sales, 2016-2020
  • 13.
    © 2017 eMarketerInc. Retail mcommerce sales will nearly triple in four years due to sales via smartphones
  • 14.
    © 2017 eMarketerInc. Mobile commerce is shifting away from tablets and toward smartphones By Q2 2016, 70% of all mcommerce on the Criteo platform was being done via smartphones
  • 15.
    © 2017 eMarketerInc. Finance leads among industries for its mcommerce share of ecommerce sales
  • 16.
    © 2017 eMarketerInc. Within retail, video games, consoles and accessories lead as mobile purchases 94% 89% 89% 76% 72% 54% 49% 41% 6% 11% 11% 24% 28% 46% 51% 59% 0% 100% Desktop Mobile Computers/peripherals/PDAs Consumer electronics US Ecommerce Sales, by Device, Q3 2016 Home garden Apparel accessories CPG Jewelry watches Toys hobbies Video games/consoles/ accessories Source: comScore, eCommerce and Mcommerce Measurement, Nov 2016
  • 17.
    © 2017 eMarketerInc. Mcommerce Performance
  • 18.
    © 2017 eMarketerInc. Mobile now influences more than a third of total retail sales in the US *A retail sale is “influenced” by mobile if the consumer discovers, searches for, researches or price compares the product during the purchase path Source: Deloitte, Sep 2016 37% of US retail sales in 2016 were influenced* by mobile, which translated to $1.4 trillion in sales
  • 19.
    © 2017 eMarketerInc. The majority of online shopping traffic is mobile, with most coming from smartphones 61.4% 47.7% 24.1% 40.3% 14.5% 12.0% Q3 2015 Q4 2015 Q1 2016 Q2 2016 Q3 2016 Desktop/laptop Smartphone Tablet US Ecommerce Traffic Share, Q3 2015-Q3 2016 Source: Monetate, Nov 2016
  • 20.
    © 2017 eMarketerInc. In late 2015, mobile was the majority source of traffic for the first time
  • 21.
    © 2017 eMarketerInc. Factors that affect a smartphone's conversion rate:  Device type  Screen size  Operating system  Load time
  • 22.
    © 2017 eMarketerInc. Load time is a crucial factor in mobile conversions Source: SOASTA, Sep 2015 1.9% 0.6% 0.0% 1.0% 2.0% 3.0% 2.4 3.3 3.6 4.2 4.8 5.7 6.6 Mobile Conversion Rates, by Load Time Speed (in seconds)
  • 23.
    © 2017 eMarketerInc. Any page elements that slow load time reduce conversions 19 31 Converted Unconverted Average Number of Images for Mobile Sites, Converted vs. Unconverted (images per page) Source: Google/SOASTA via Think with Google, July 2016
  • 24.
    © 2017 eMarketerInc. The majority of retail mcommerce orders comes via iOS users
  • 25.
    © 2017 eMarketerInc. Apps outperform mobile web App conversion rates are 3X higher than mobile web conversion rates Mobile Web 47.0% 54.0% 40% Q2 2015 Q2 2016 $91 $127 $98 $95 75 150 Q2 2015 Q2 2016 Mobile web Apps Source: Criteo, H1 2016 App Share of Global Retail Mobile Transactions Average Order Value, by Channel
  • 26.
    © 2017 eMarketerInc. Half of US internet users on mobile visit Amazon to research products
  • 27.
    MONETIZING MOBILE SHOPPERS: WHATBRANDS NEED TO KNOW 71% RECOMMENDATIONS HAVE THEIR PLACES, BUT SHOPPERS REALLY WANT A DEAL I like in-app/in-browser messages that contain... While a product reco can nudge some users to buy, once they’re in your app, people would rather see a deal or promotion. ABANDONED CARTS ARE NORMAL— AND DON’T MEAN SHOPPERS HAVE LOST INTEREST When shopping online, I put items in my cart that I intend to purchase, but I don’t check out immediately. SOMETIMES / 32% ALWAYS / 21% RARELY / 11% NEVER / 4% OFTEN / 32% PEOPLE LIKE CUSTOMIZED MESSAGES, BUT NOT ALL PERSONALIZATION IS CREATED EQUAL Online shoppers would rather have outreach customized based on their local weather instead of their name. CUSTOMIZED BY WEATHER CUSTOMIZED BY NAME IF YOU WANT TO ENGAGE SHOPPERS, DON’T BURY THEM IN MESSAGES If you never accept push, why not? TOO MANY MESSAGES MESSAGES AREN’T RELEVANT OTHER MESSAGE RECEIVED AT INCONVENIENT TIMES PREFER SUGGESTIONS PREFER PROMOS69% 27% GET YOUR RESULTS S E E H O W Y O U R M A R K E T I N G E F F O R T S S TA C K U P W I T H A P P B O Y ’ S D I G I T S M O B I L E M A R K E T I N G B E N C H M A R K S W E B T O O L . C H O O S E “ R E TA I L + E C O M M E R C E ” F R O M T H E I N D U S T R Y TA B T O G E T S TA R T E D . 56% Be careful with push—using this channel to send too many messages is the #1 reason shoppers disable it. SOURCE:APPBOYCONSUMERSTUDYVIAPOLLFISH.COM 85%
  • 28.
    © 2017 eMarketerInc. 28 Methodology Estimates are based on the analysis of survey and traffic data from research firms and regulatory agencies; historical trends; internet and mobile adoption trends; and country- specific demographic and socioeconomic factors. eMarketer’s forecasts and estimates are based on an analysis of quantitative and qualitative data from research firms, government agencies, media firms and public companies, plus interviews with top executives at publishers, ad buyers and agencies. Data is weighted based on methodology and soundness. Each eMarketer forecast fits within the larger matrix of all its forecasts, with the same assumptions and general framework used to project figures in a wide variety of areas. Regular reevaluation of available data means the forecasts reflect the latest business developments, technology trends and economic changes.