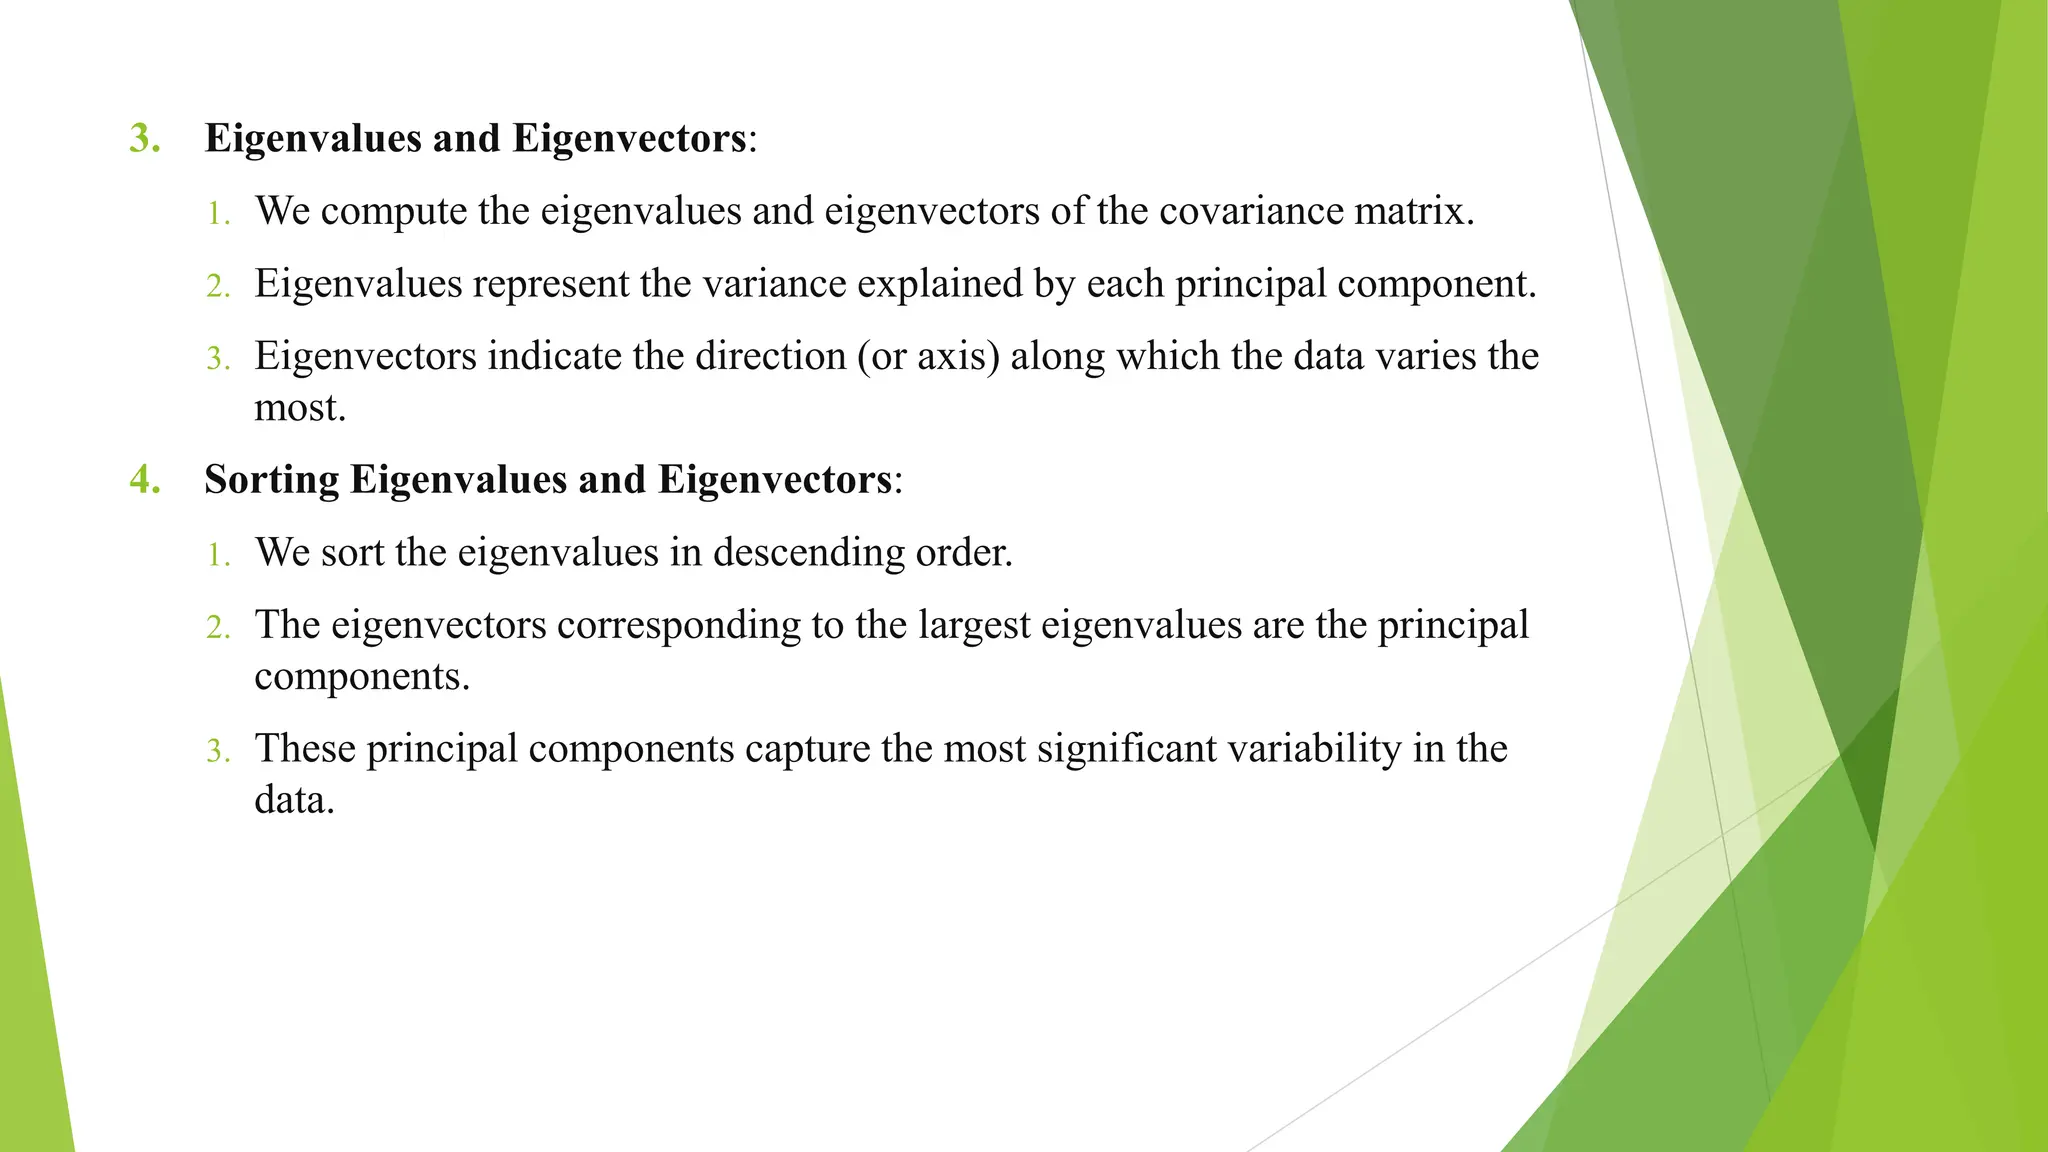
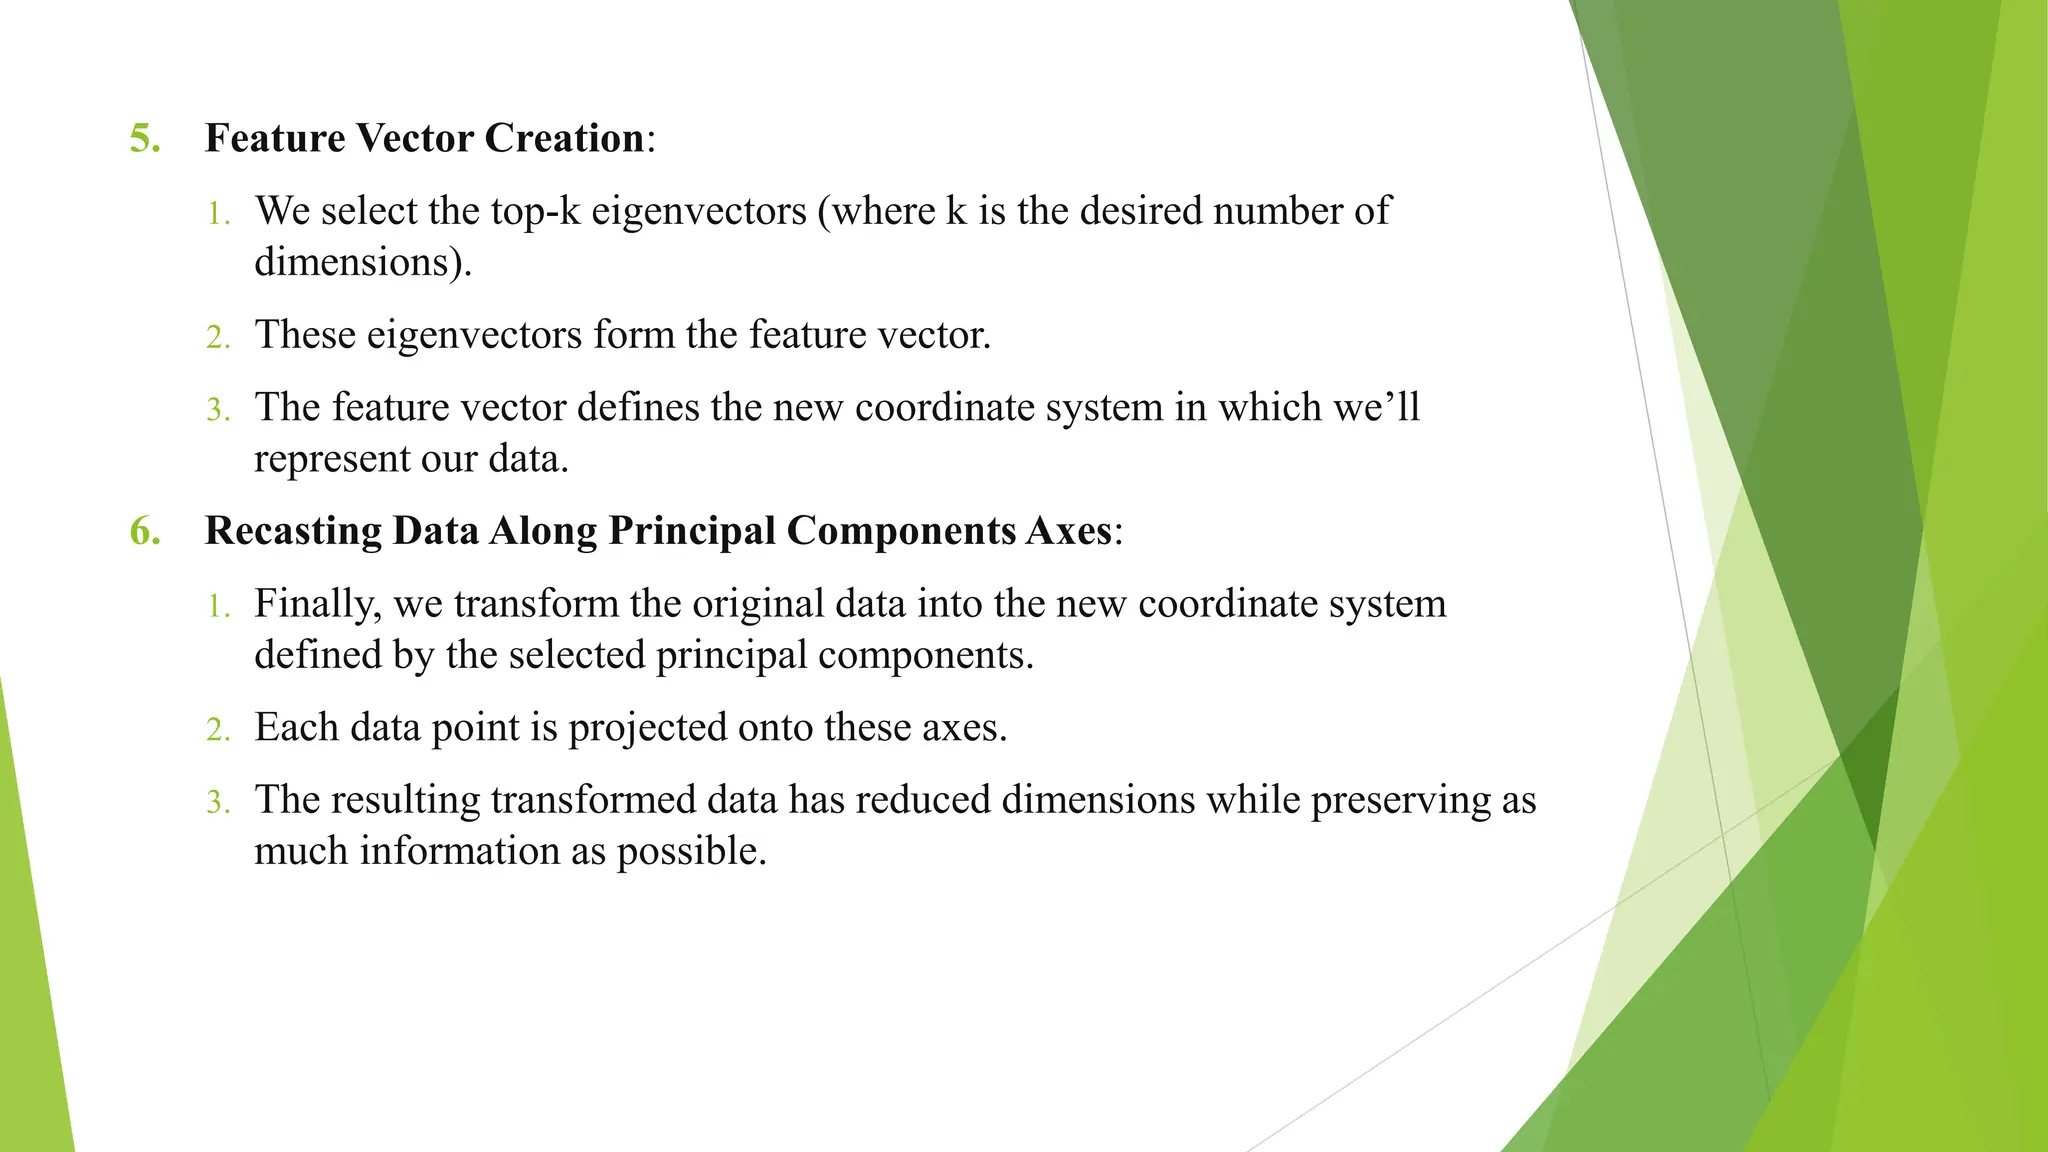
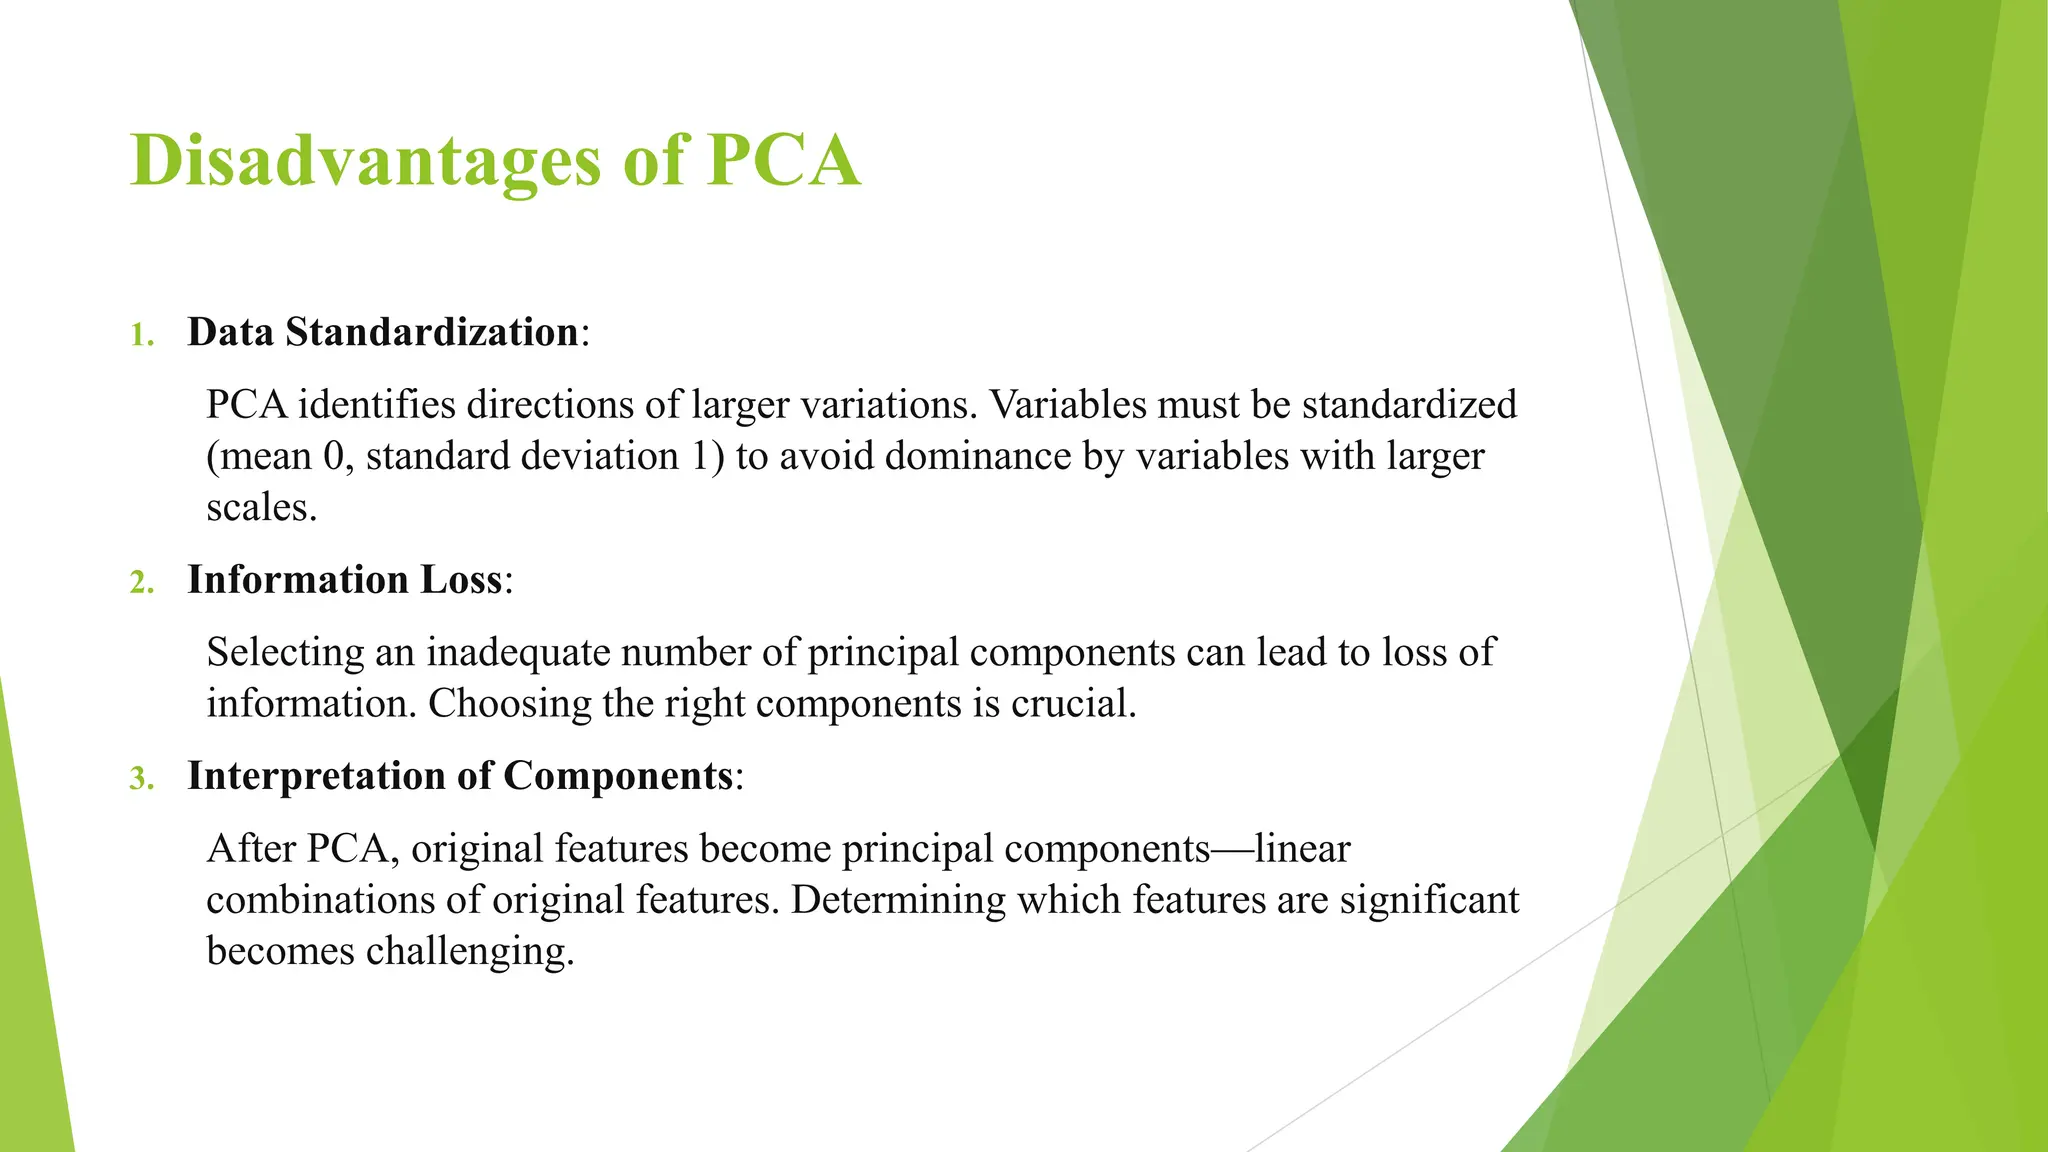
Principal Component
Analysis (PCA)
The Curse of Dimensionality
What are dimensions
 In machine learning the dimension of a dataset corresponds to the number of
attributes/features that exist in a dataset, and a dataset with a large number of
attributes, generally of the order of a hundred or more, is referred to as high
dimensional data.
 For example, if we consider a dataset of houses, the dimensions could include
the house's price, size, number of bedrooms, location, and so on.
What is the Curse of Dimensionality occur and
how does it occur
 The Curse of Dimensionality is a set of problems that arise when working with
high-dimensional data.
 As we add more dimensions to our dataset, the volume of the space increases
exponentially. The volume of the space represented grows so quickly that the
data cannot keep up and thus becomes sparse, meaning that most of the high-
dimensional space is empty. This makes clustering and classification tasks
challenging.
 More dimensions mean more computational resources and time to process the
data.
 With higher dimensions, models can become overly complex, fitting to the
noise rather than the underlying pattern. This reduces the model's ability to
generalize to new data.
 High-dimensional data is hard to visualize, making exploratory data analysis
more difficult.
How to solve the Curse of Dimensionality
 The primary solution to the curse of dimensionality is "dimensionality
reduction." It's a process that reduces the number of random variables under
consideration by obtaining a set of principal variables. By reducing the
dimensionality, we can retain the most important information in the data while
discarding the redundant or less important features.
 Some techniques to of dimensionality reduction are: Principal Component
Analysis (PCA), Linear Discriminant Analysis (LDA), t-Distributed Stochastic
Neighbor Embedding (t-SNE)
Principal Component Analysis (PCA)
 PCA is an unsupervised approach to finding the “right” features from the data.
 It is a statistical method that transforms the original variables into a new set of
variables, which are linear combinations of the original variables. These new
variables are called principal components.
 Let's say we have a dataset containing information about different aspects of
cars, such as horsepower, torque, acceleration, and top speed. We want to
reduce the dimensionality of this dataset using PCA.
 Using PCA, we can create a new set of variables called principal components.
The first principal component would capture the most variance in the data,
which could be a combination of horsepower and torque. The second principal
component might represent acceleration and top speed. By reducing the
dimensionality of the data using PCA, we can visualize and analyze the dataset
more effectively.
Visualization
How PCA works
 Step 1: Standardizing the data
 Step 2: Computing the covariance matrix
 Step 3: Obtaining the eigenvectors and eigenvalues
 Step 4: Selecting principal components based on explained variance
1. Standardization:
1. First, we need to standardize our dataset. This involves calculating the
mean and standard deviation for each variable.
2. By standardizing, we ensure that each variable has a mean of 0 and a
standard deviation of 1.
3. Standardization allows us to analyze the contribution of each variable
equally.
2. Covariance Matrix Computation:
1. Next, we calculate the covariance matrix for the features in the dataset.
2. The covariance matrix represents the relationships between different
variables.
3. It helps us understand how the variables are related to each other.
3. Eigenvalues and Eigenvectors:
1. We compute the eigenvalues and eigenvectors of the covariance matrix.
2. Eigenvalues represent the variance explained by each principal component.
3. Eigenvectors indicate the direction (or axis) along which the data varies the
most.
4. Sorting Eigenvalues and Eigenvectors:
1. We sort the eigenvalues in descending order.
2. The eigenvectors corresponding to the largest eigenvalues are the principal
components.
3. These principal components capture the most significant variability in the
data.
5. Feature Vector Creation:
1. We select the top-k eigenvectors (where k is the desired number of
dimensions).
2. These eigenvectors form the feature vector.
3. The feature vector defines the new coordinate system in which we’ll
represent our data.
6. Recasting Data Along Principal Components Axes:
1. Finally, we transform the original data into the new coordinate system
defined by the selected principal components.
2. Each data point is projected onto these axes.
3. The resulting transformed data has reduced dimensions while preserving as
much information as possible.
Disadvantages of PCA
1. Data Standardization:
PCA identifies directions of larger variations. Variables must be standardized
(mean 0, standard deviation 1) to avoid dominance by variables with larger
scales.
2. Information Loss:
Selecting an inadequate number of principal components can lead to loss of
information. Choosing the right components is crucial.
3. Interpretation of Components:
After PCA, original features become principal components—linear
combinations of original features. Determining which features are significant
becomes challenging.

Principal Component Analysis (PCA) machine Learning.

  • 1.
  • 2.
    The Curse ofDimensionality
  • 3.
    What are dimensions In machine learning the dimension of a dataset corresponds to the number of attributes/features that exist in a dataset, and a dataset with a large number of attributes, generally of the order of a hundred or more, is referred to as high dimensional data.  For example, if we consider a dataset of houses, the dimensions could include the house's price, size, number of bedrooms, location, and so on.
  • 4.
    What is theCurse of Dimensionality occur and how does it occur  The Curse of Dimensionality is a set of problems that arise when working with high-dimensional data.  As we add more dimensions to our dataset, the volume of the space increases exponentially. The volume of the space represented grows so quickly that the data cannot keep up and thus becomes sparse, meaning that most of the high- dimensional space is empty. This makes clustering and classification tasks challenging.  More dimensions mean more computational resources and time to process the data.  With higher dimensions, models can become overly complex, fitting to the noise rather than the underlying pattern. This reduces the model's ability to generalize to new data.  High-dimensional data is hard to visualize, making exploratory data analysis more difficult.
  • 5.
    How to solvethe Curse of Dimensionality  The primary solution to the curse of dimensionality is "dimensionality reduction." It's a process that reduces the number of random variables under consideration by obtaining a set of principal variables. By reducing the dimensionality, we can retain the most important information in the data while discarding the redundant or less important features.  Some techniques to of dimensionality reduction are: Principal Component Analysis (PCA), Linear Discriminant Analysis (LDA), t-Distributed Stochastic Neighbor Embedding (t-SNE)
  • 6.
    Principal Component Analysis(PCA)  PCA is an unsupervised approach to finding the “right” features from the data.  It is a statistical method that transforms the original variables into a new set of variables, which are linear combinations of the original variables. These new variables are called principal components.  Let's say we have a dataset containing information about different aspects of cars, such as horsepower, torque, acceleration, and top speed. We want to reduce the dimensionality of this dataset using PCA.  Using PCA, we can create a new set of variables called principal components. The first principal component would capture the most variance in the data, which could be a combination of horsepower and torque. The second principal component might represent acceleration and top speed. By reducing the dimensionality of the data using PCA, we can visualize and analyze the dataset more effectively.
  • 7.
  • 8.
    How PCA works Step 1: Standardizing the data  Step 2: Computing the covariance matrix  Step 3: Obtaining the eigenvectors and eigenvalues  Step 4: Selecting principal components based on explained variance
  • 9.
    1. Standardization: 1. First,we need to standardize our dataset. This involves calculating the mean and standard deviation for each variable. 2. By standardizing, we ensure that each variable has a mean of 0 and a standard deviation of 1. 3. Standardization allows us to analyze the contribution of each variable equally. 2. Covariance Matrix Computation: 1. Next, we calculate the covariance matrix for the features in the dataset. 2. The covariance matrix represents the relationships between different variables. 3. It helps us understand how the variables are related to each other.
  • 10.
    3. Eigenvalues andEigenvectors: 1. We compute the eigenvalues and eigenvectors of the covariance matrix. 2. Eigenvalues represent the variance explained by each principal component. 3. Eigenvectors indicate the direction (or axis) along which the data varies the most. 4. Sorting Eigenvalues and Eigenvectors: 1. We sort the eigenvalues in descending order. 2. The eigenvectors corresponding to the largest eigenvalues are the principal components. 3. These principal components capture the most significant variability in the data.
  • 11.
    5. Feature VectorCreation: 1. We select the top-k eigenvectors (where k is the desired number of dimensions). 2. These eigenvectors form the feature vector. 3. The feature vector defines the new coordinate system in which we’ll represent our data. 6. Recasting Data Along Principal Components Axes: 1. Finally, we transform the original data into the new coordinate system defined by the selected principal components. 2. Each data point is projected onto these axes. 3. The resulting transformed data has reduced dimensions while preserving as much information as possible.
  • 12.
    Disadvantages of PCA 1.Data Standardization: PCA identifies directions of larger variations. Variables must be standardized (mean 0, standard deviation 1) to avoid dominance by variables with larger scales. 2. Information Loss: Selecting an inadequate number of principal components can lead to loss of information. Choosing the right components is crucial. 3. Interpretation of Components: After PCA, original features become principal components—linear combinations of original features. Determining which features are significant becomes challenging.