Principal Component Analysis
•Machine Learning in general works wonders when the dataset
provided for training the machine is large and concise.
• Usually having a good amount of data lets us build a better
predictive model since we have more data to train the machine
with.
• However, using a large data set has its own pitfalls.
• The biggest pitfall is the curse of dimensionality.
3.
Principal Component Analysis
•It turns out that in large dimensional datasets, there might be lots
of inconsistencies in the features or lots of redundant features in
the dataset, which will only increase the computation time and
make data processing and EDA more convoluted.
• Dimensionality reduction techniques can be used to filter only a
limited number of significant features needed for training and this
is where PCA comes in.
4.
What Is PrincipalComponent Analysis (PCA)?
• Principal components analysis (PCA) is a dimensionality
reduction technique that enables you to identify correlations
and patterns in a data set so that it can be transformed into a
data set of significantly lower dimension without loss of any
important information.
5.
Principal Component Analysis
•The main idea behind PCA is to figure out patterns and
correlations among various features in the data set.
• On finding a strong correlation between different variables, a final
decision is made about reducing the dimensions of the data in
such a way that the significant data is still retained.
6.
Principal Component AnalysisSteps
• Standardization of the data
• Computing the covariance matrix
• Calculating the eigenvectors and eigenvalues
• Computing the Principal Components
• Reducing the dimensions of the data set
7.
Standardization of thedata
• Missing out on standardization will probably result in a biased
outcome.
• Standardization is all about scaling your data in such a way that all
the variables and their values lie within a similar range.
8.
Standardization of thedata
• Consider an example, let’s say that we have 2 variables in our
data set, one has values ranging between 10-100 and the other has
values between 1000-5000.
• In such a scenario, it is obvious that the output calculated by using
these predictor variables is going to be biased since the variable
with a larger range will have a more obvious impact on the
outcome.
9.
Standardization of thedata
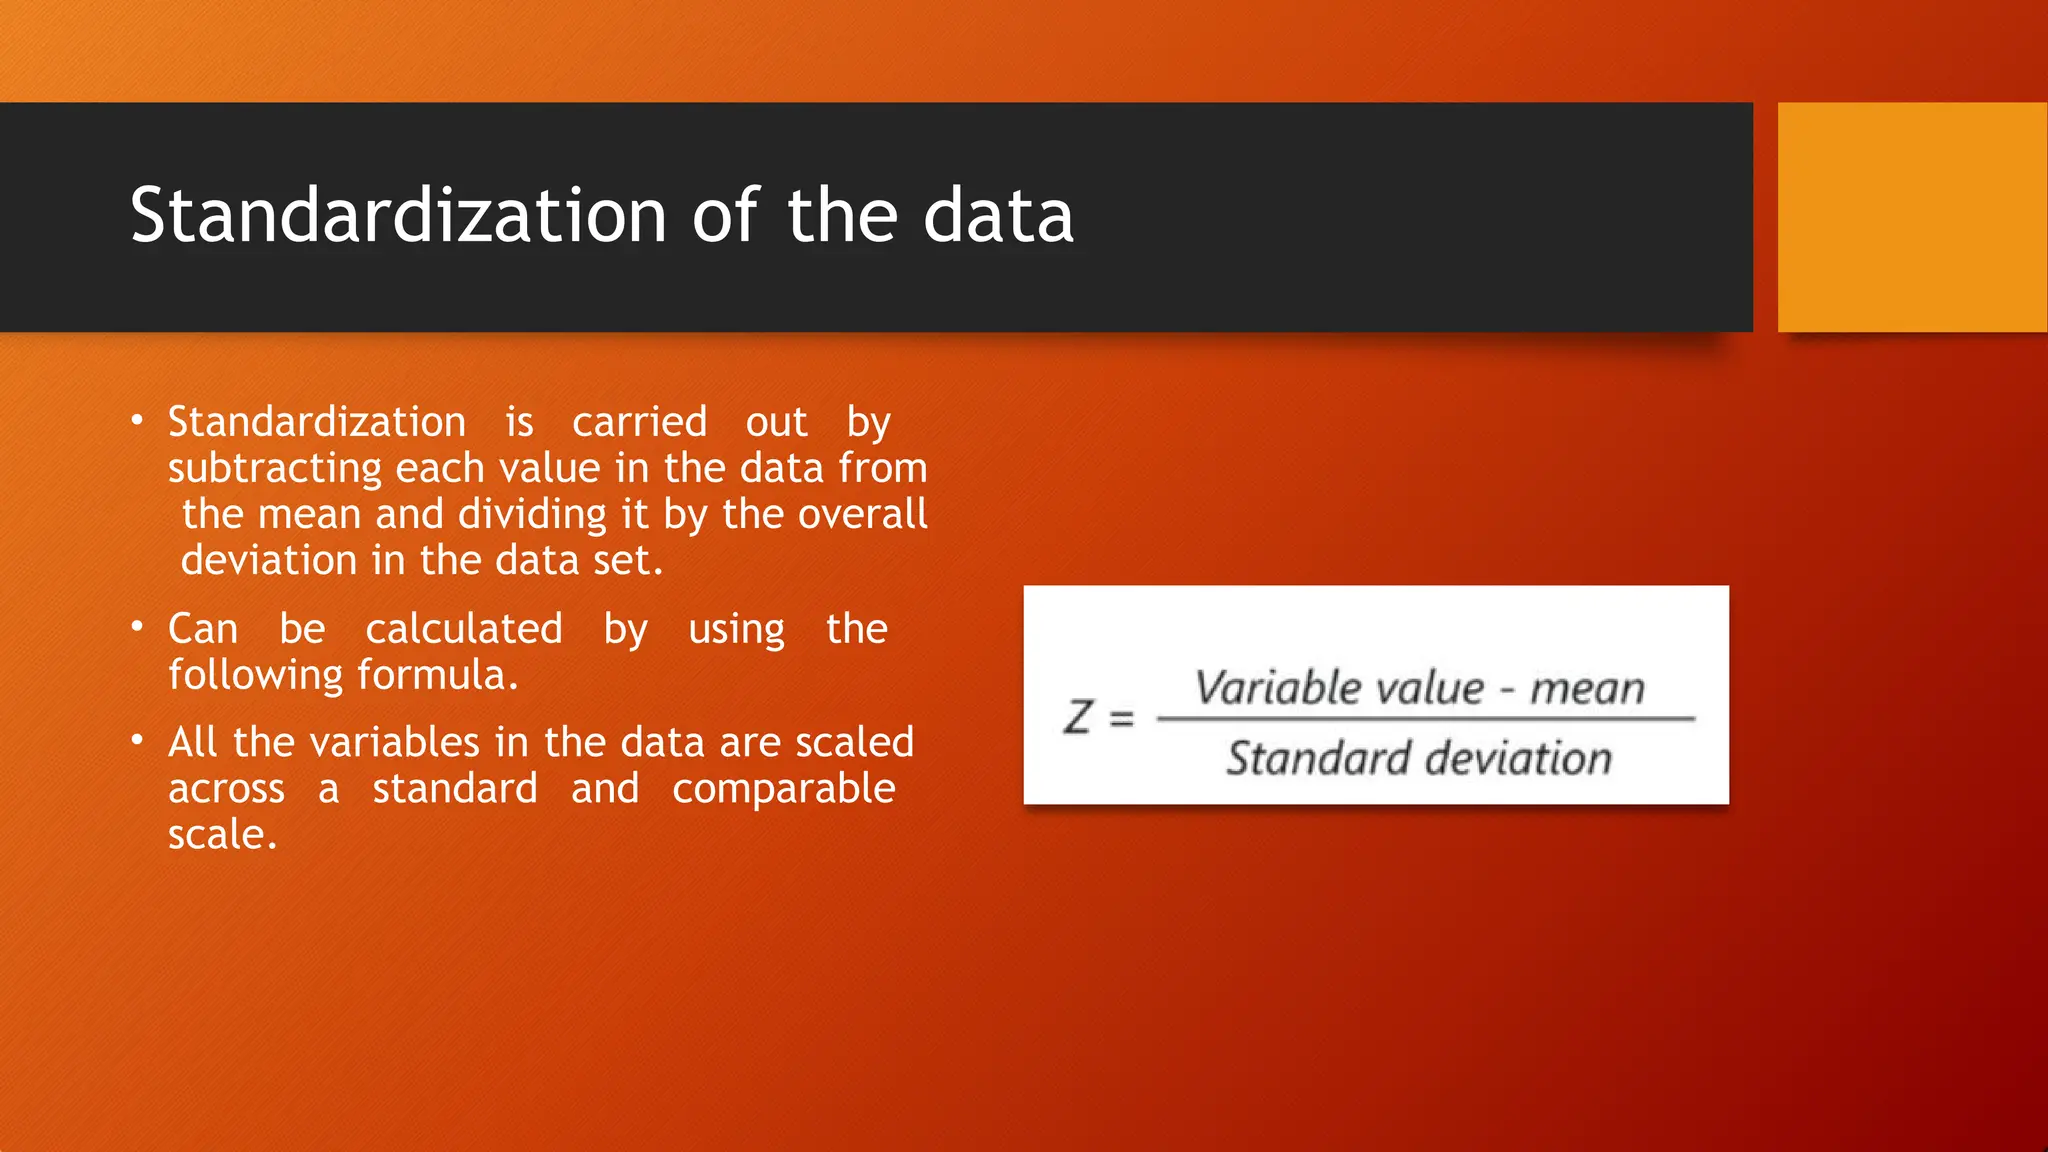
• Standardization is carried out by
subtracting each value in the data from
the mean and dividing it by the overall
deviation in the data set.
• Can be calculated by using the
following formula.
• All the variables in the data are scaled
across a standard and comparable
scale.
10.
Computing the covariancematrix
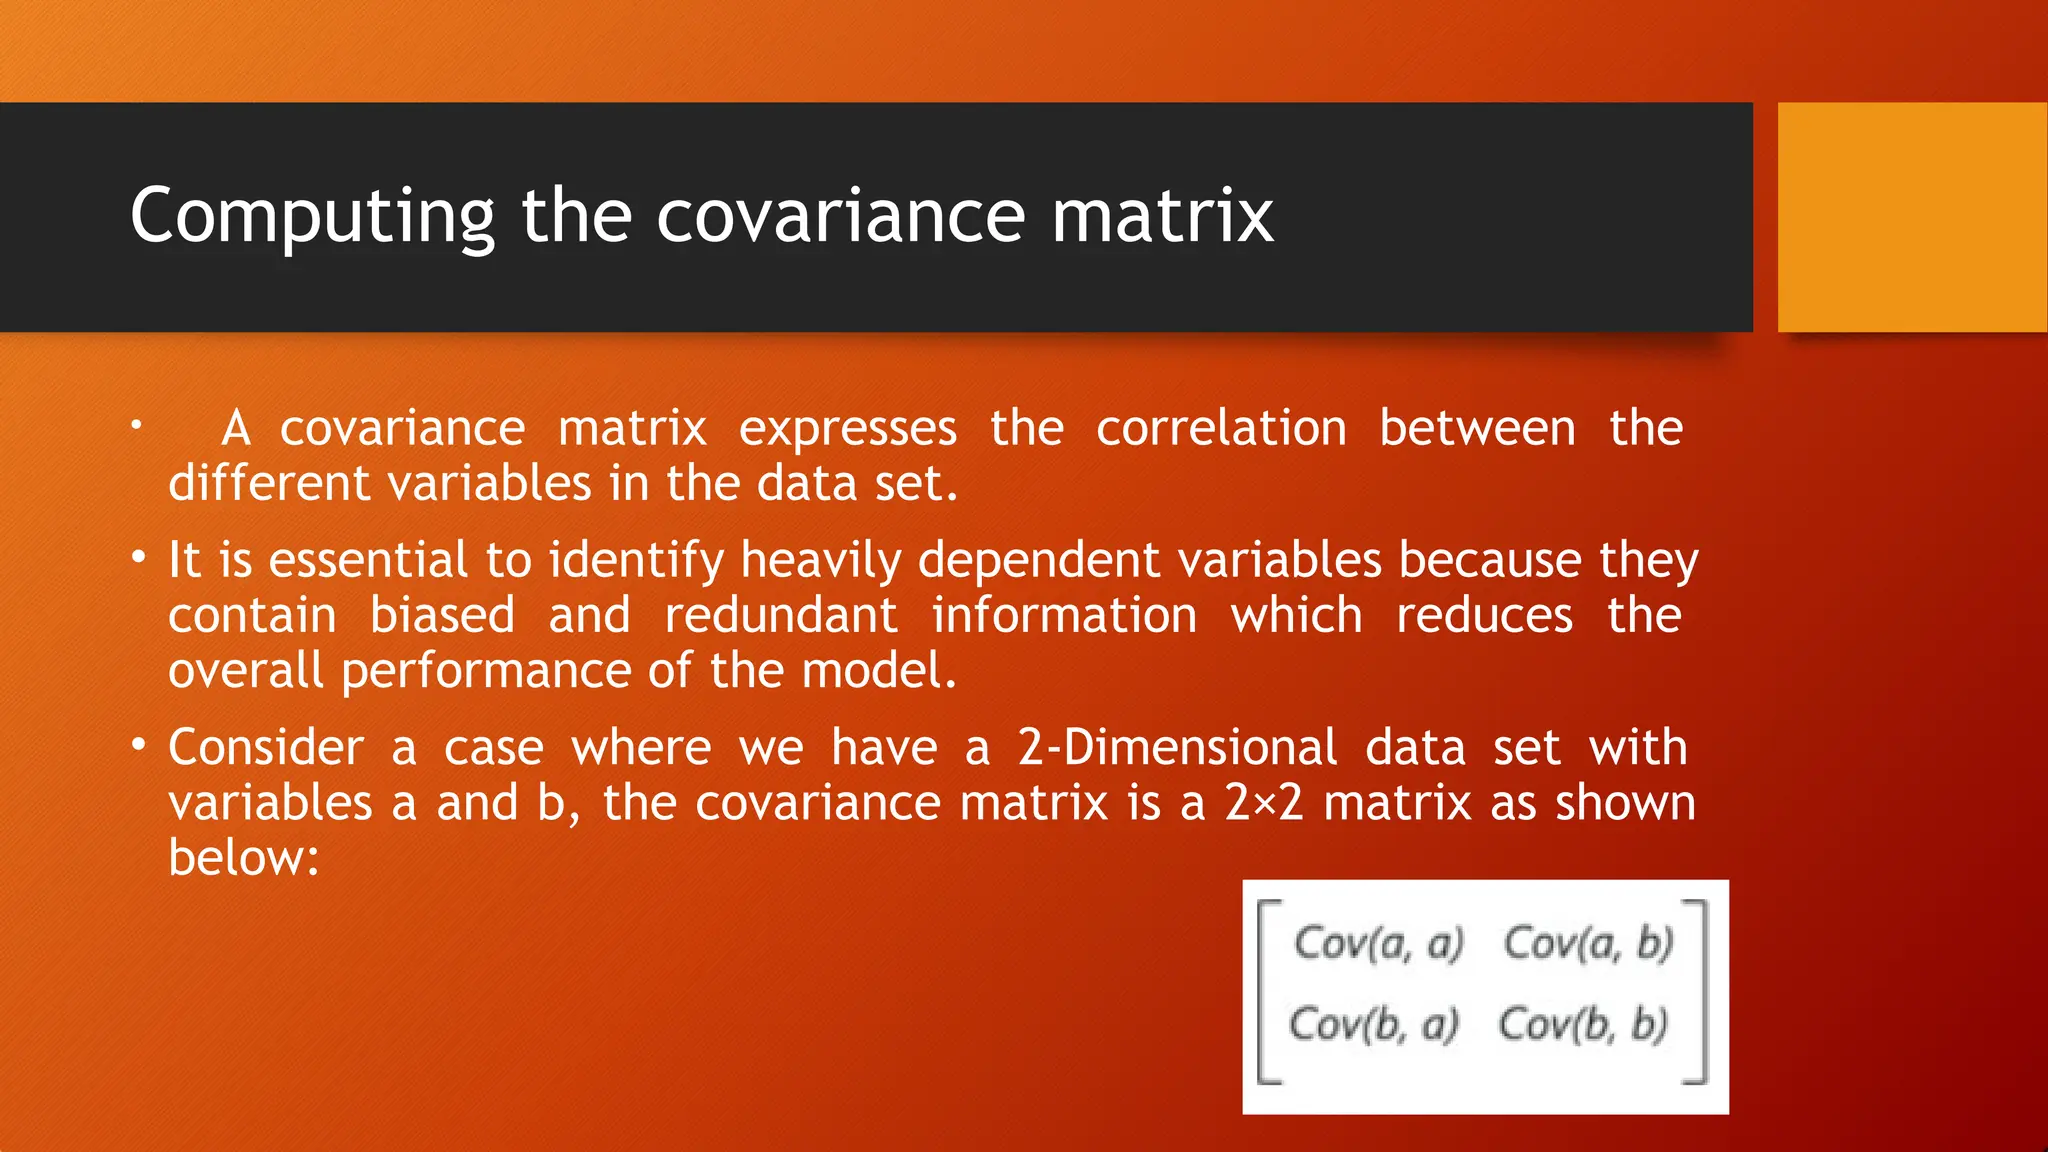
• A covariance matrix expresses the correlation between the
different variables in the data set.
• It is essential to identify heavily dependent variables because they
contain biased and redundant information which reduces the
overall performance of the model.
• Consider a case where we have a 2-Dimensional data set with
variables a and b, the covariance matrix is a 2×2 matrix as shown
below:
11.
Computing the covariancematrix
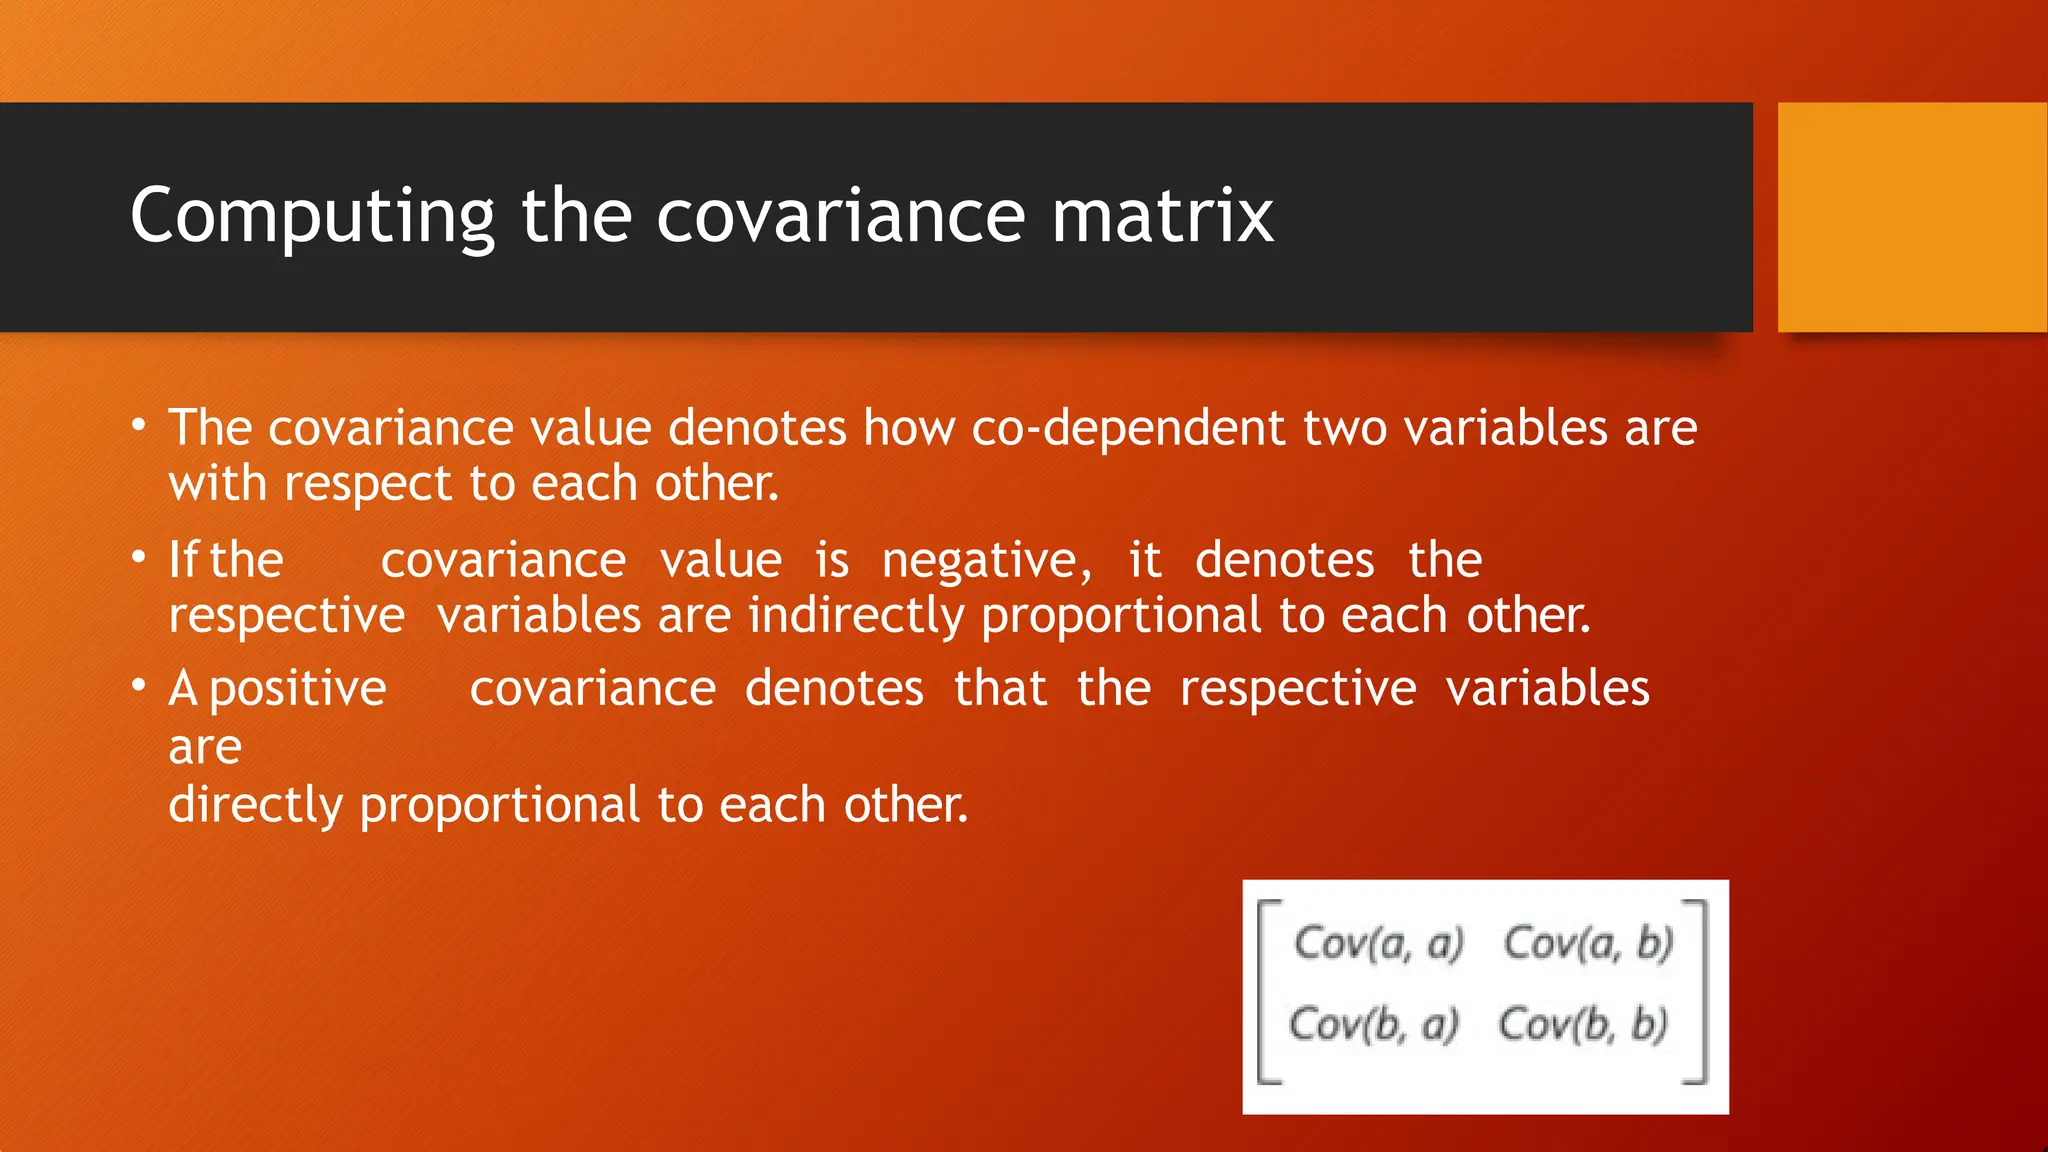
• The covariance value denotes how co-dependent two variables are
with respect to each other.
• Ifthe covariance value is negative, it denotes the
respective variables are indirectly proportional to each other.
• A positive covariance denotes that the respective variables
are
directly proportional to each other.
12.
Calculating the Eigenvectorsand Eigenvalues
• Eigenvectors and eigenvalues are the mathematical constructs
that must be computed from the covariance matrix in order to
determine the principal components of the data set.
13.
What are PrincipalComponents?
• Principal components are the new set of variables that are
obtained from the initial set of variables.
• The principal components are computed in such a manner that
newly obtained variables are highly significant and independent of
each other.
• The principal components compress and possess most of the useful
information that was scattered among the initial variables.
The transformed new features or the output of PCA are the
Principal Components. The number of these PCs are either equal
to or less than the original features present in the dataset.
14.
What are PrincipalComponents?
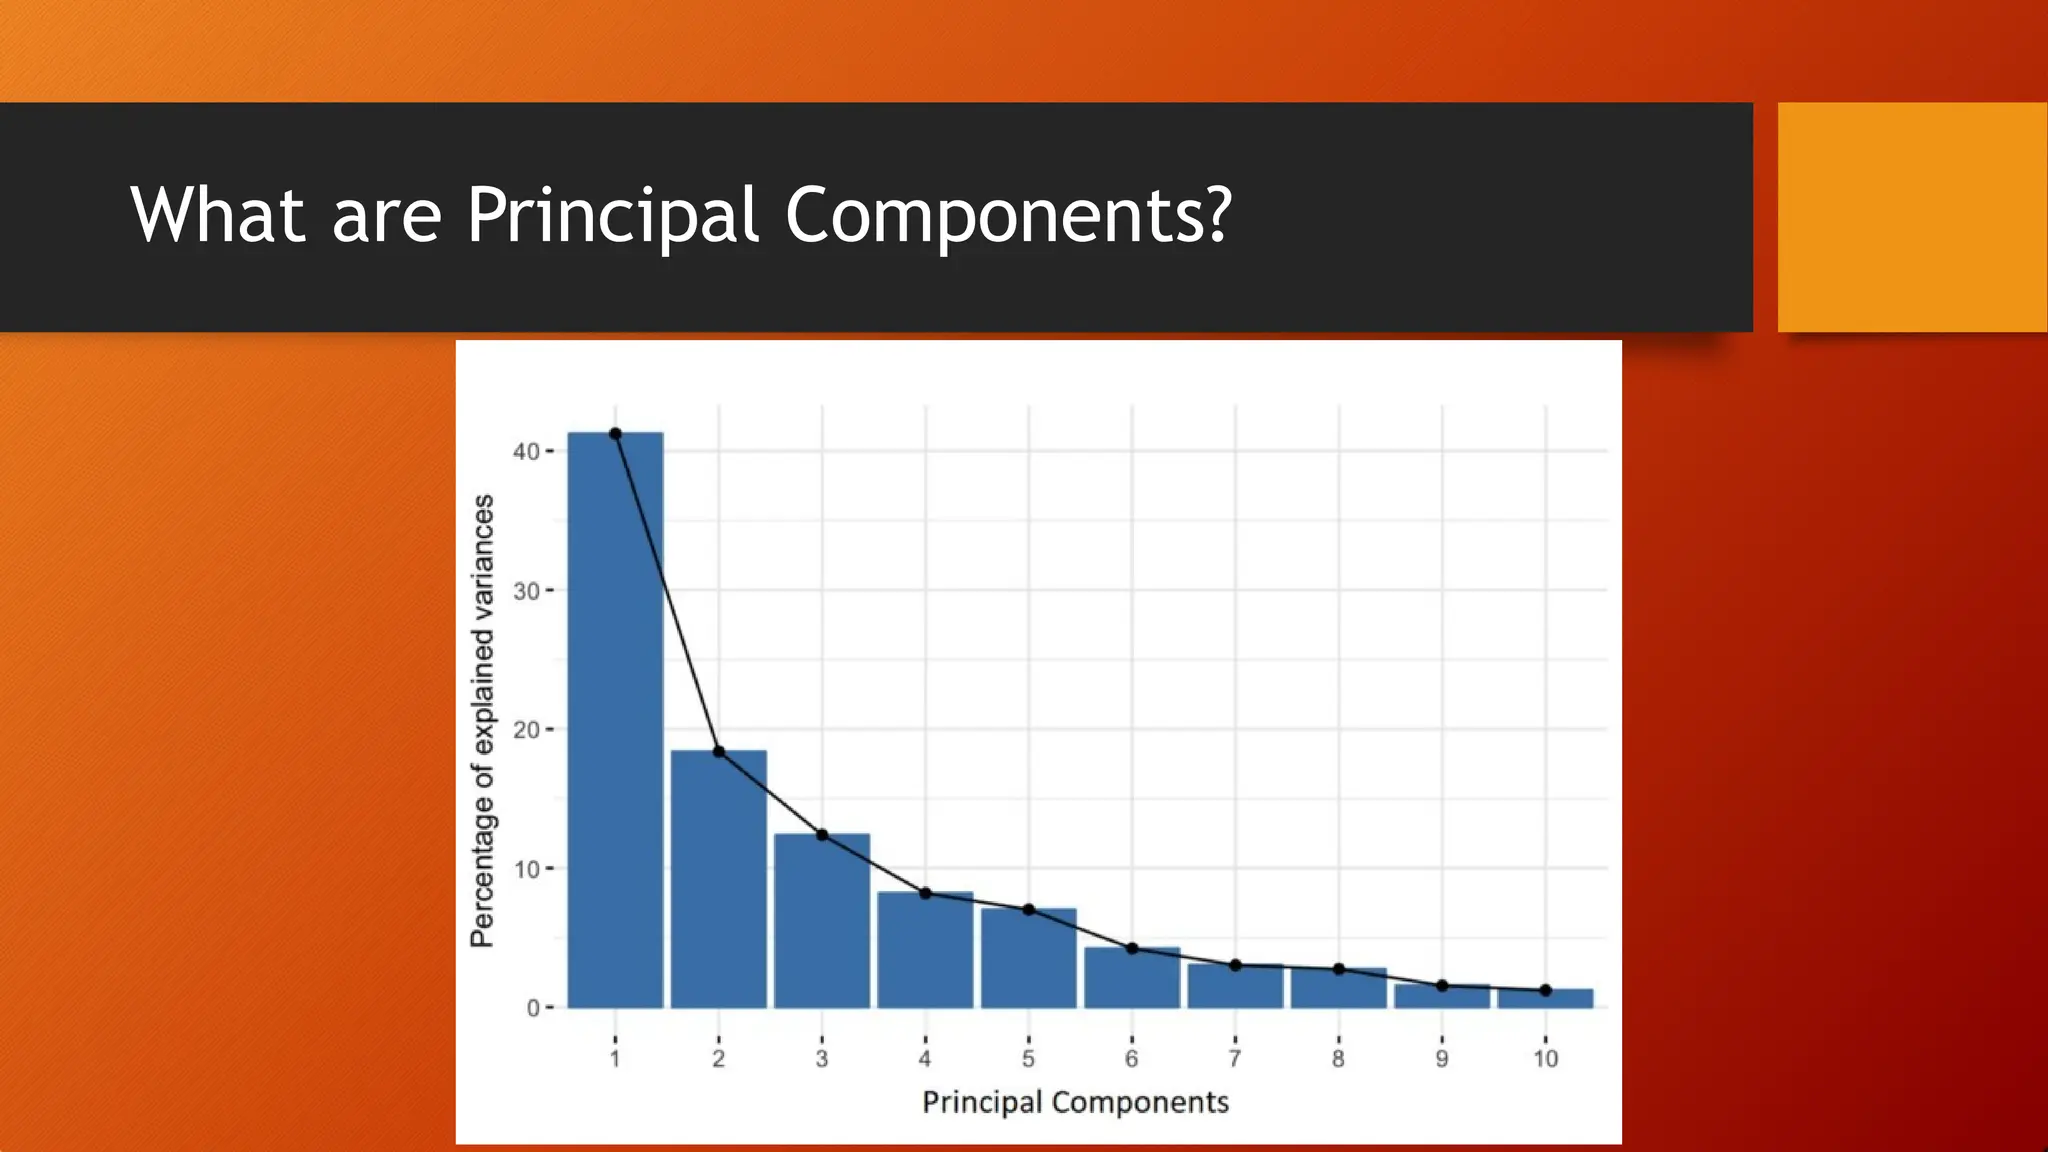
• If your data set is of 5 dimensions, then 5 principal components
are computed, such that, the first principal component stores the
maximum possible information and the second one stores the
remaining maximum info and so on.
What are PrincipalComponents?
• The relationship between variance and information here, is that,
the larger the variance carried by a line, the larger the dispersion
of the data points along it, and the larger the dispersion along a
line, the more the information it has.
17.
Determining Principal Components
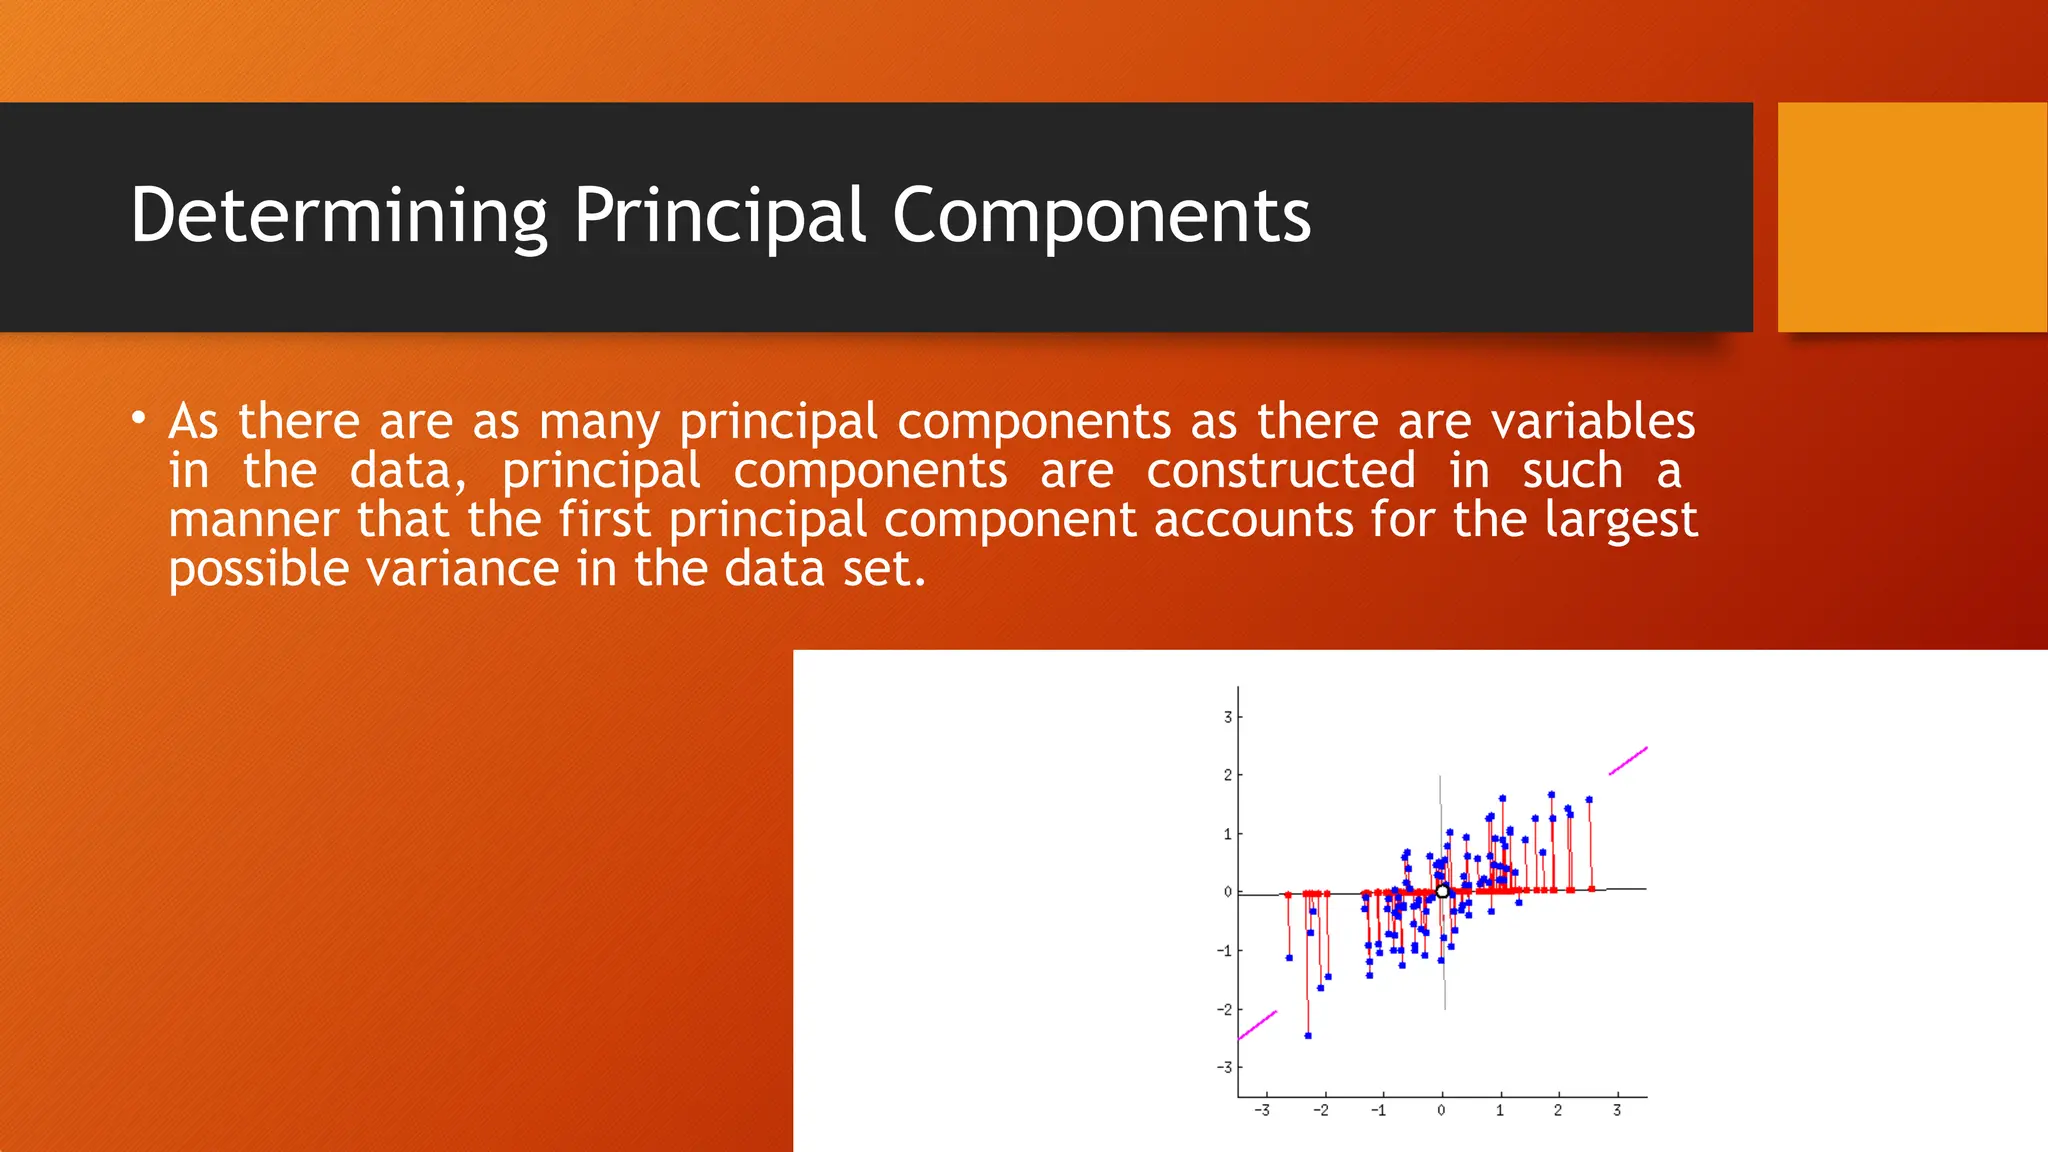
•As there are as many principal components as there are variables
in the data, principal components are constructed in such a
manner that the first principal component accounts for the largest
possible variance in the data set.
18.
Determining Principal Components
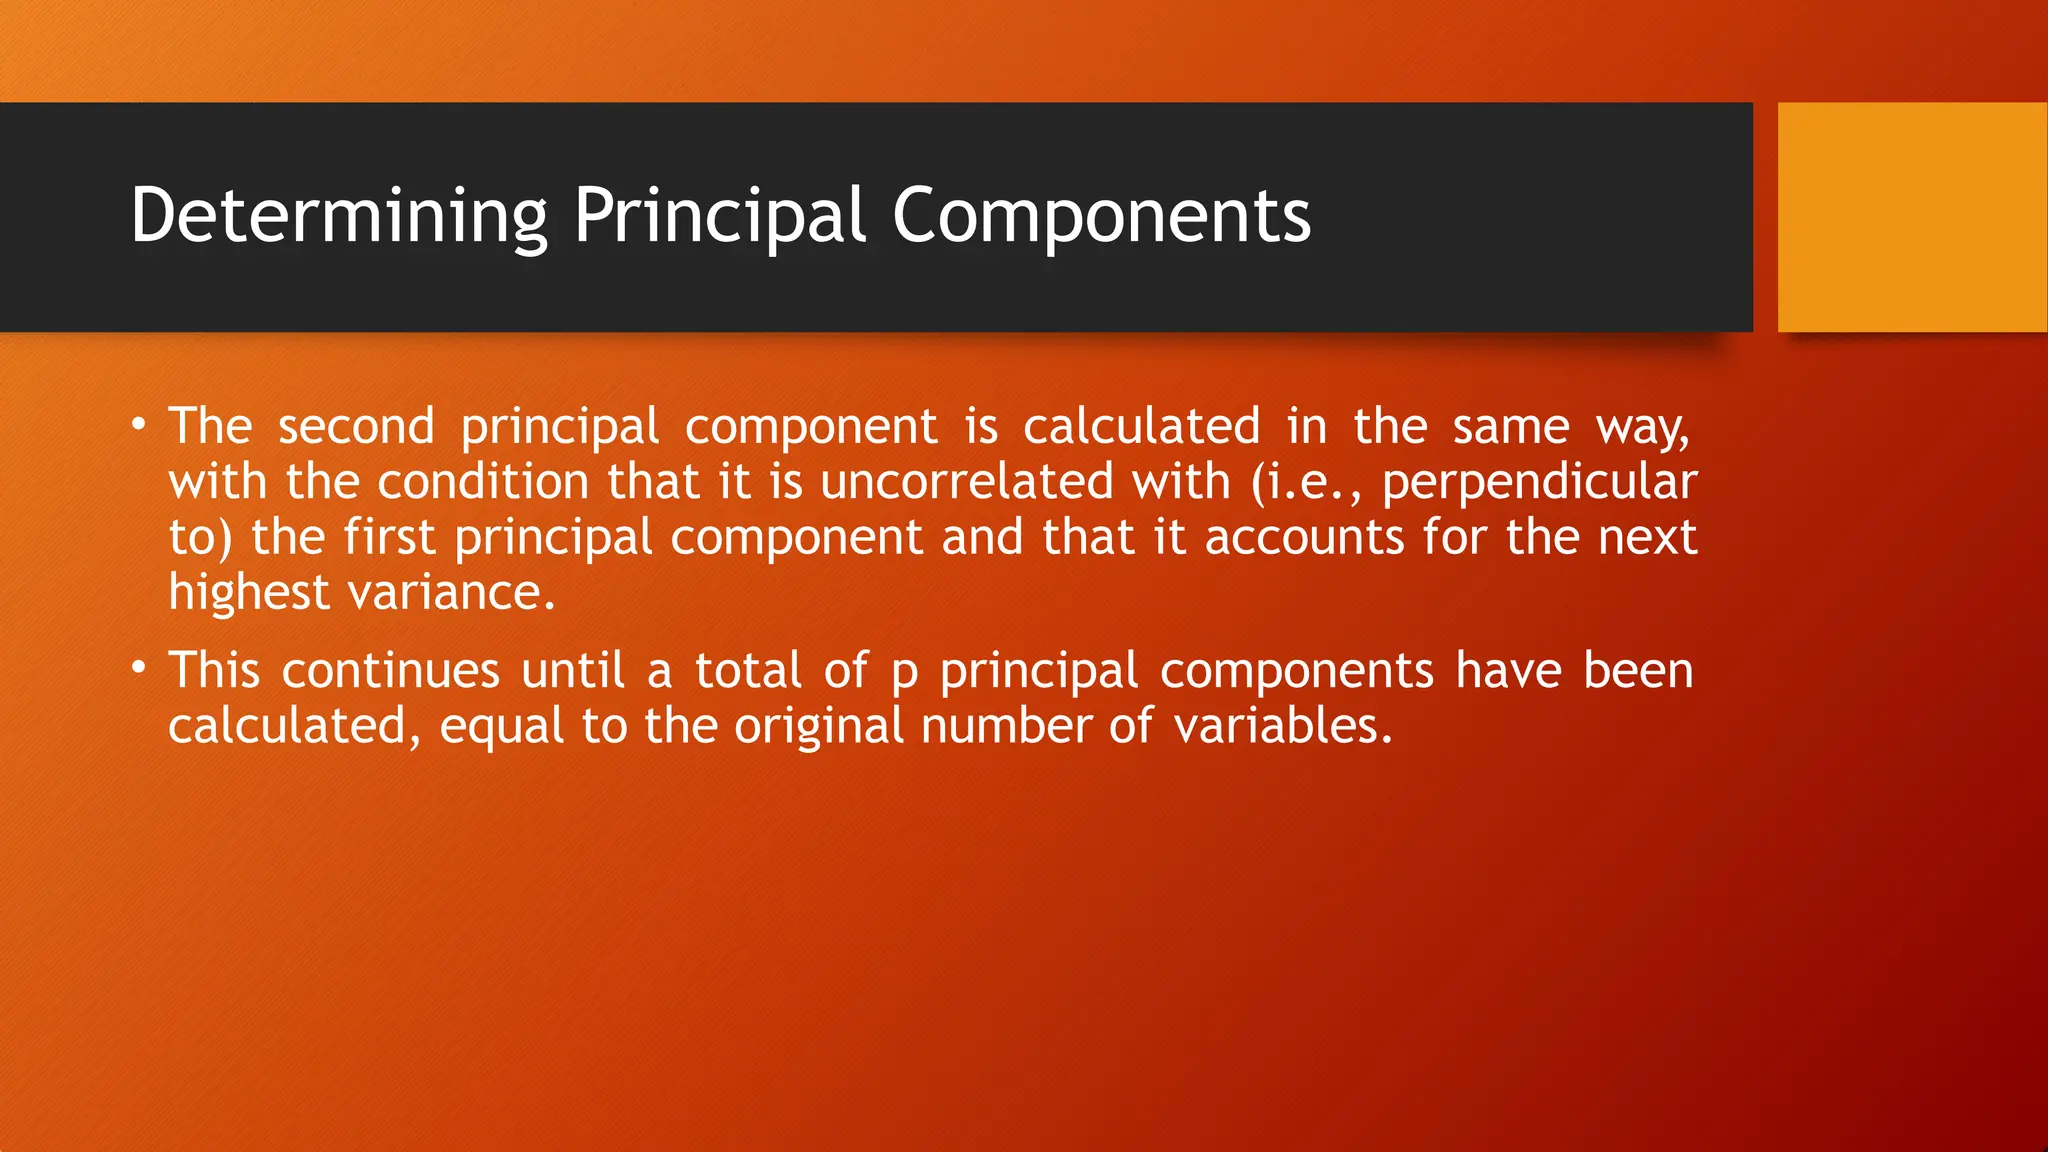
•The second principal component is calculated in the same way,
with the condition that it is uncorrelated with (i.e., perpendicular
to) the first principal component and that it accounts for the next
highest variance.
• This continues until a total of p principal components have been
calculated, equal to the original number of variables.
19.
Eigenvectors and eigenvalues
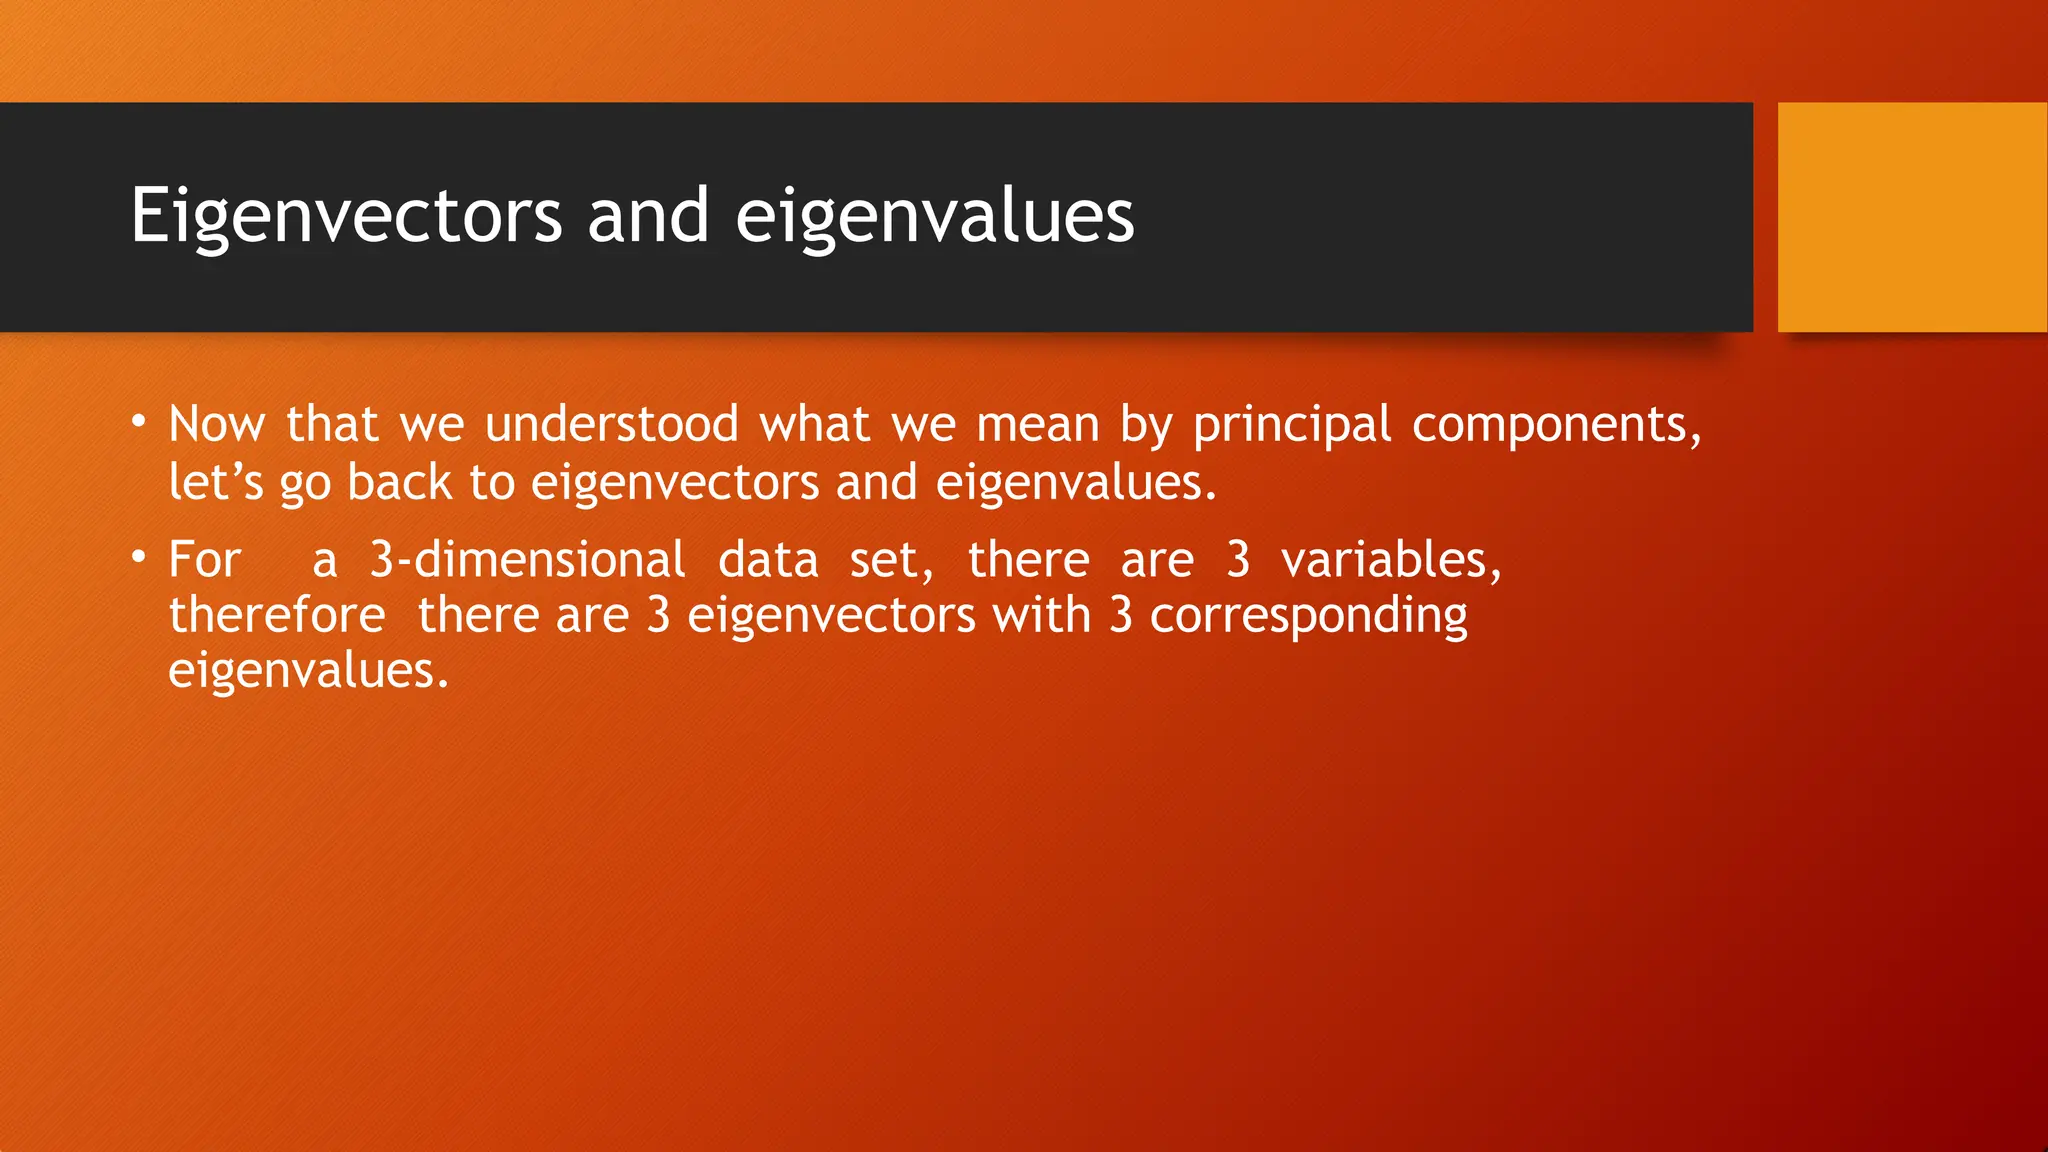
•Now that we understood what we mean by principal components,
let’s go back to eigenvectors and eigenvalues.
• For a 3-dimensional data set, there are 3 variables,
therefore there are 3 eigenvectors with 3 corresponding
eigenvalues.
20.
Eigenvectors and eigenvalues
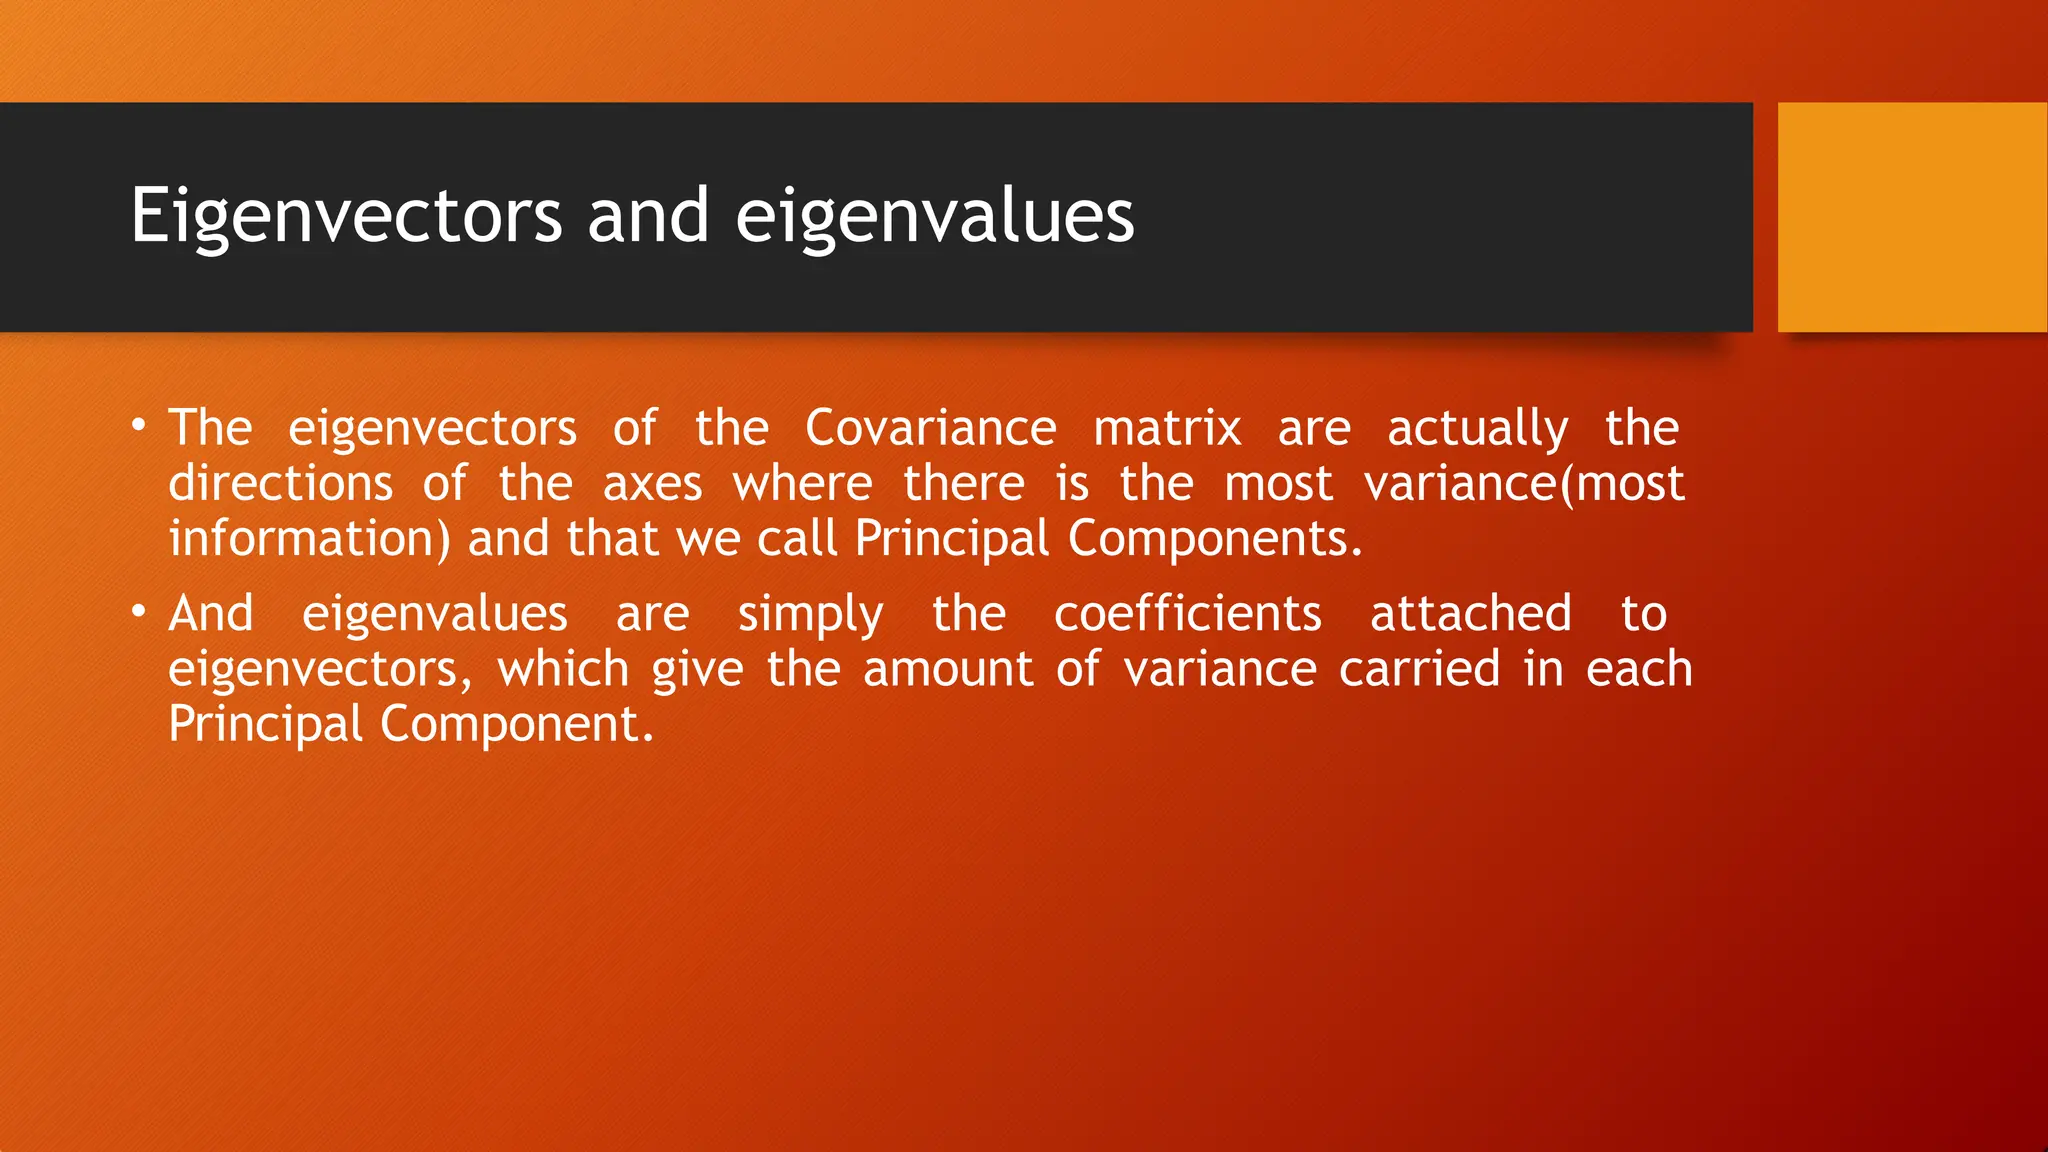
•The eigenvectors of the Covariance matrix are actually the
directions of the axes where there is the most variance(most
information) and that we call Principal Components.
• And eigenvalues are simply the coefficients attached to
eigenvectors, which give the amount of variance carried in each
Principal Component.
22.
PCA
• PCA isa great tool to help you discover important relationships in
the data and can also be used to create more informative
features.
• PCA is typically applied to standardized data. With standardized
data "variation" means "correlation".
• With unstandardized data "variation" means "covariance".