The document provides an overview of principal component analysis (PCA), including:
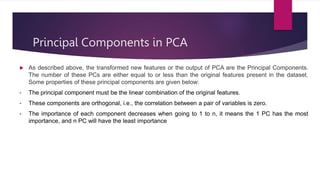
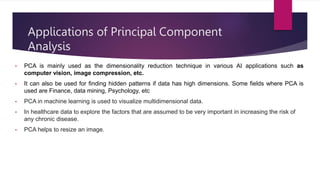
- PCA is a dimensionality reduction technique that transforms variables into uncorrelated principal components.
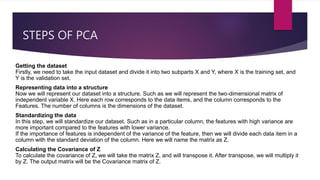
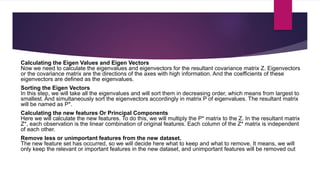
- The steps of PCA involve standardizing data, calculating the covariance matrix, and determining principal components through eigendecomposition of the covariance matrix.
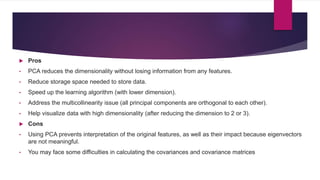
- PCA reduces dimensionality while preserving as much information as possible, helping with issues like data storage, algorithm speed, and visualization. However, it does not directly interpret the original features.
Dimensionality Reduction and feature extraction.pptxSivam Chinna
Dimensionality reduction, or dimension reduction, is the transformation of data from a high-dimensional space into a low-dimensional space so that the low-dimensional representation retains some meaningful properties of the original data, ideally close to its intrinsic dimension.
Statistical theory is a branch of mathematics and statistics that provides the foundation for understanding and working with data, making inferences, and drawing conclusions from observed phenomena. It encompasses a wide range of concepts, principles, and techniques for analyzing and interpreting data in a systematic and rigorous manner. Statistical theory is fundamental to various fields, including science, social science, economics, engineering, and more.
Delivering Micro-Credentials in Technical and Vocational Education and TrainingAG2 Design
Explore how micro-credentials are transforming Technical and Vocational Education and Training (TVET) with this comprehensive slide deck. Discover what micro-credentials are, their importance in TVET, the advantages they offer, and the insights from industry experts. Additionally, learn about the top software applications available for creating and managing micro-credentials. This presentation also includes valuable resources and a discussion on the future of these specialised certifications.
For more detailed information on delivering micro-credentials in TVET, visit this https://tvettrainer.com/delivering-micro-credentials-in-tvet/
Biological screening of herbal drugs: Introduction and Need for
Phyto-Pharmacological Screening, New Strategies for evaluating
Natural Products, In vitro evaluation techniques for Antioxidants, Antimicrobial and Anticancer drugs. In vivo evaluation techniques
for Anti-inflammatory, Antiulcer, Anticancer, Wound healing, Antidiabetic, Hepatoprotective, Cardio protective, Diuretics and
Antifertility, Toxicity studies as per OECD guidelines
Exploiting Artificial Intelligence for Empowering Researchers and Faculty, In...Dr. Vinod Kumar Kanvaria
Exploiting Artificial Intelligence for Empowering Researchers and Faculty,
International FDP on Fundamentals of Research in Social Sciences
at Integral University, Lucknow, 06.06.2024
By Dr. Vinod Kumar Kanvaria
Executive Directors Chat Leveraging AI for Diversity, Equity, and InclusionTechSoup
Let’s explore the intersection of technology and equity in the final session of our DEI series. Discover how AI tools, like ChatGPT, can be used to support and enhance your nonprofit's DEI initiatives. Participants will gain insights into practical AI applications and get tips for leveraging technology to advance their DEI goals.
Normal Labour/ Stages of Labour/ Mechanism of LabourWasim Ak
Normal labor is also termed spontaneous labor, defined as the natural physiological process through which the fetus, placenta, and membranes are expelled from the uterus through the birth canal at term (37 to 42 weeks
Safalta Digital marketing institute in Noida, provide complete applications that encompass a huge range of virtual advertising and marketing additives, which includes search engine optimization, virtual communication advertising, pay-per-click on marketing, content material advertising, internet analytics, and greater. These university courses are designed for students who possess a comprehensive understanding of virtual marketing strategies and attributes.Safalta Digital Marketing Institute in Noida is a first choice for young individuals or students who are looking to start their careers in the field of digital advertising. The institute gives specialized courses designed and certification.
for beginners, providing thorough training in areas such as SEO, digital communication marketing, and PPC training in Noida. After finishing the program, students receive the certifications recognised by top different universitie, setting a strong foundation for a successful career in digital marketing.
How to Build a Module in Odoo 17 Using the Scaffold MethodCeline George
Odoo provides an option for creating a module by using a single line command. By using this command the user can make a whole structure of a module. It is very easy for a beginner to make a module. There is no need to make each file manually. This slide will show how to create a module using the scaffold method.
A Strategic Approach: GenAI in EducationPeter Windle
Artificial Intelligence (AI) technologies such as Generative AI, Image Generators and Large Language Models have had a dramatic impact on teaching, learning and assessment over the past 18 months. The most immediate threat AI posed was to Academic Integrity with Higher Education Institutes (HEIs) focusing their efforts on combating the use of GenAI in assessment. Guidelines were developed for staff and students, policies put in place too. Innovative educators have forged paths in the use of Generative AI for teaching, learning and assessments leading to pockets of transformation springing up across HEIs, often with little or no top-down guidance, support or direction.
This Gasta posits a strategic approach to integrating AI into HEIs to prepare staff, students and the curriculum for an evolving world and workplace. We will highlight the advantages of working with these technologies beyond the realm of teaching, learning and assessment by considering prompt engineering skills, industry impact, curriculum changes, and the need for staff upskilling. In contrast, not engaging strategically with Generative AI poses risks, including falling behind peers, missed opportunities and failing to ensure our graduates remain employable. The rapid evolution of AI technologies necessitates a proactive and strategic approach if we are to remain relevant.
2. TABLE OF CONTENTS
INTRODUCTION
WHAT IS PCA
PRINCIPLE COMPONENTS IN PCA
STEPS OF PCA
APPLICATIONS
CONCLUSION
3. INTRODUCTION
PCA is a dimensionality reduction technique that has four main
parts: feature covariance, eigen decomposition, principal
component transformation, and choosing components in terms of
explained variance. PCA works by considering the variance of each
attribute because the high attribute shows the good split between
the classes, and hence it reduces the dimensionality.
Some real-world applications of PCA are image processing,
movie recommendation system, optimizing the power
allocation in various communication channels.
4. WHAT IS PCA ?
To understand PCA, we have to know its purpose. To understand the
purpose, we have to know the Curse of Dimensionality i .e As the
number of features or dimensions grows, the amount of data we need
to generalize accurately grows exponentially.
There are two options to reduce dimensionality:
Feature elimination: we remove some features directly.
Feature extraction: we keep the important fraction of all the features.
We apply PCA to achieve this. Note that PCA is not the only method
that does the feature extraction.
5. SOME COMMON TERMS USED IN PCA
ALGORITHM:
Dimensionality: It is the number of
features or variables present in the
given dataset. More easily, it is the
number of columns present in the
dataset.
Correlation: It signifies that how strongly
two variables are related to each other.
Such as if one changes, the other
variable also gets changed. The
correlation value ranges from -1 to +1.
Here, -1 occurs if variables are
inversely proportional to each other, and
+1 indicates that variables are directly
proportional to each other.
6. Continuation….
Orthogonal: It defines that variables are
not correlated to each other, and hence
the correlation between the pair of
variables is zero.
Eigenvectors: If there is a square
matrix M, and a non-zero vector v is
given. Then v will be eigenvector if Av
is the scalar multiple of v.
Covariance Matrix: A matrix containing
the covariance between the pair of
variables is called the Covariance
Matrix.
7. Principal Components in PCA
As described above, the transformed new features or the output of PCA are the Principal Components.
The number of these PCs are either equal to or less than the original features present in the dataset.
Some properties of these principal components are given below:
• The principal component must be the linear combination of the original features.
• These components are orthogonal, i.e., the correlation between a pair of variables is zero.
• The importance of each component decreases when going to 1 to n, it means the 1 PC has the most
importance, and n PC will have the least importance
8. STEPS OF PCA
Getting the dataset
Firstly, we need to take the input dataset and divide it into two subparts X and Y, where X is the training set, and
Y is the validation set.
Representing data into a structure
Now we will represent our dataset into a structure. Such as we will represent the two-dimensional matrix of
independent variable X. Here each row corresponds to the data items, and the column corresponds to the
Features. The number of columns is the dimensions of the dataset.
Standardizing the data
In this step, we will standardize our dataset. Such as in a particular column, the features with high variance are
more important compared to the features with lower variance.
If the importance of features is independent of the variance of the feature, then we will divide each data item in a
column with the standard deviation of the column. Here we will name the matrix as Z.
Calculating the Covariance of Z
To calculate the covariance of Z, we will take the matrix Z, and will transpose it. After transpose, we will multiply it
by Z. The output matrix will be the Covariance matrix of Z.
9. Calculating the Eigen Values and Eigen Vectors
Now we need to calculate the eigenvalues and eigenvectors for the resultant covariance matrix Z. Eigenvectors
or the covariance matrix are the directions of the axes with high information. And the coefficients of these
eigenvectors are defined as the eigenvalues.
Sorting the Eigen Vectors
In this step, we will take all the eigenvalues and will sort them in decreasing order, which means from largest to
smallest. And simultaneously sort the eigenvectors accordingly in matrix P of eigenvalues. The resultant matrix
will be named as P*.
Calculating the new features Or Principal Components
Here we will calculate the new features. To do this, we will multiply the P* matrix to the Z. In the resultant matrix
Z*, each observation is the linear combination of original features. Each column of the Z* matrix is independent
of each other.
Remove less or unimportant features from the new dataset.
The new feature set has occurred, so we will decide here what to keep and what to remove. It means, we will
only keep the relevant or important features in the new dataset, and unimportant features will be removed out
10. Pros
• PCA reduces the dimensionality without losing information from any features.
• Reduce storage space needed to store data.
• Speed up the learning algorithm (with lower dimension).
• Address the multicollinearity issue (all principal components are orthogonal to each other).
• Help visualize data with high dimensionality (after reducing the dimension to 2 or 3).
Cons
• Using PCA prevents interpretation of the original features, as well as their impact because eigenvectors
are not meaningful.
• You may face some difficulties in calculating the covariances and covariance matrices
11. Applications of Principal Component
Analysis
• PCA is mainly used as the dimensionality reduction technique in various AI applications such as
computer vision, image compression, etc.
• It can also be used for finding hidden patterns if data has high dimensions. Some fields where PCA is
used are Finance, data mining, Psychology, etc
• PCA in machine learning is used to visualize multidimensional data.
• In healthcare data to explore the factors that are assumed to be very important in increasing the risk of
any chronic disease.
• PCA helps to resize an image.