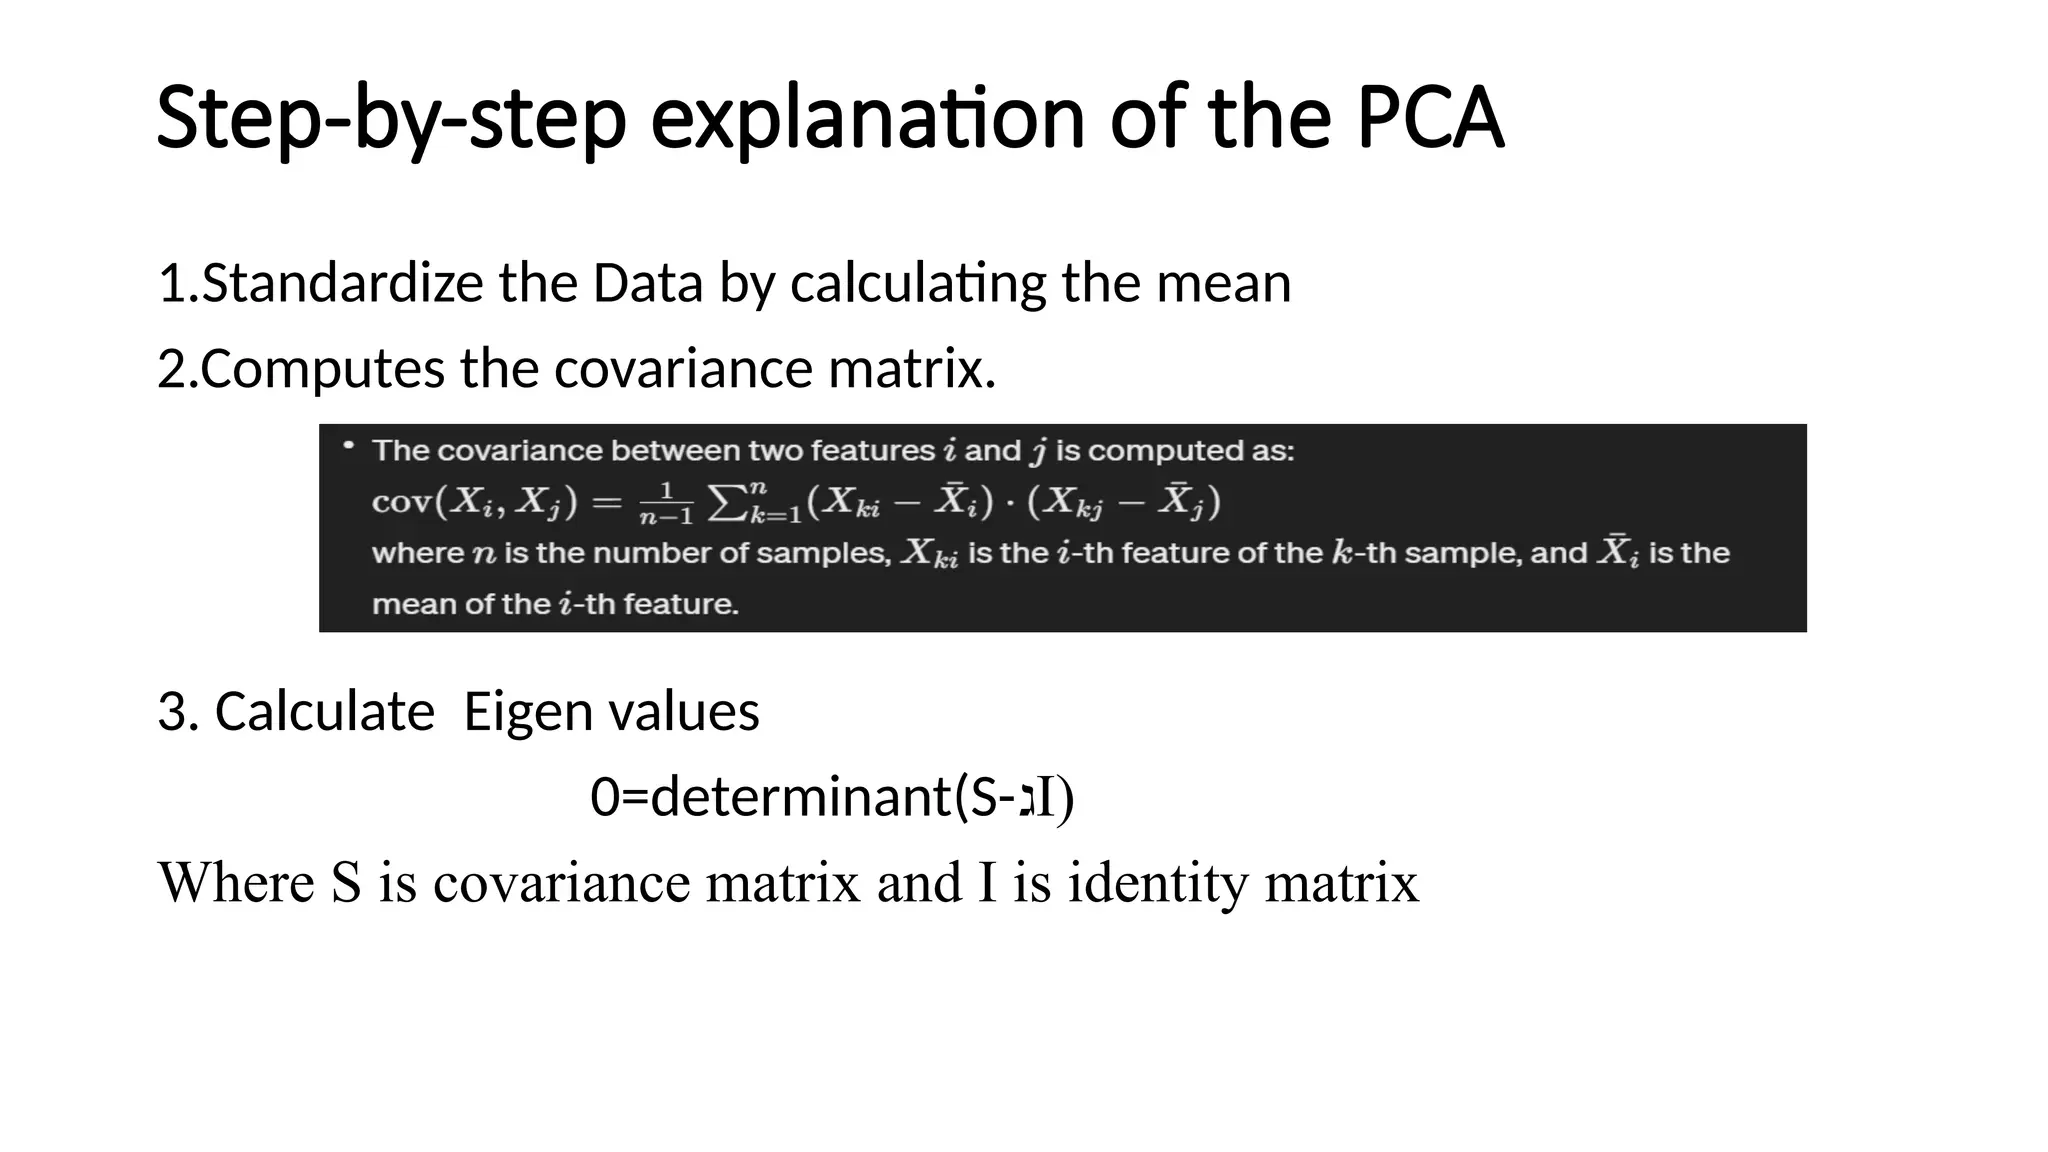
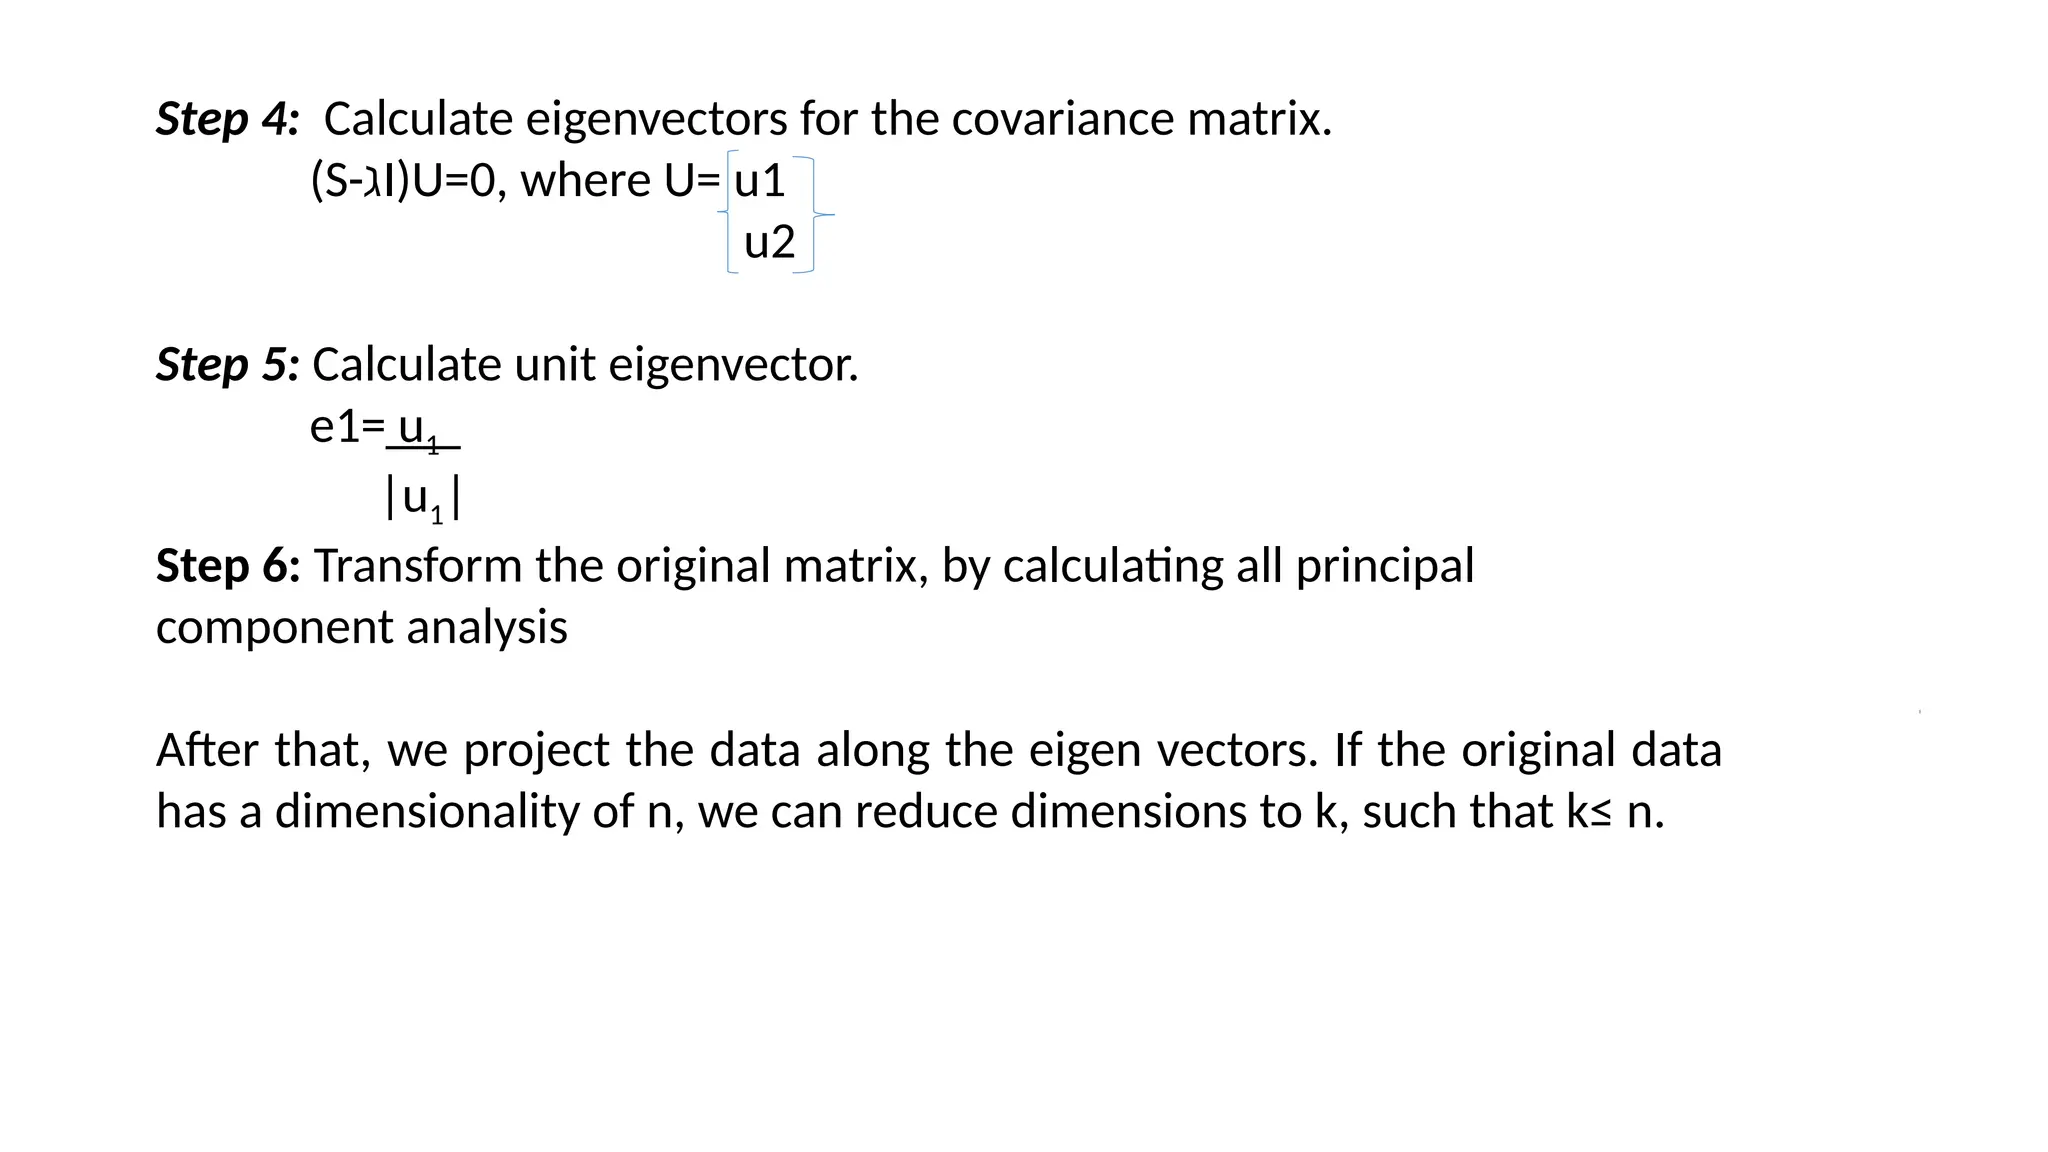
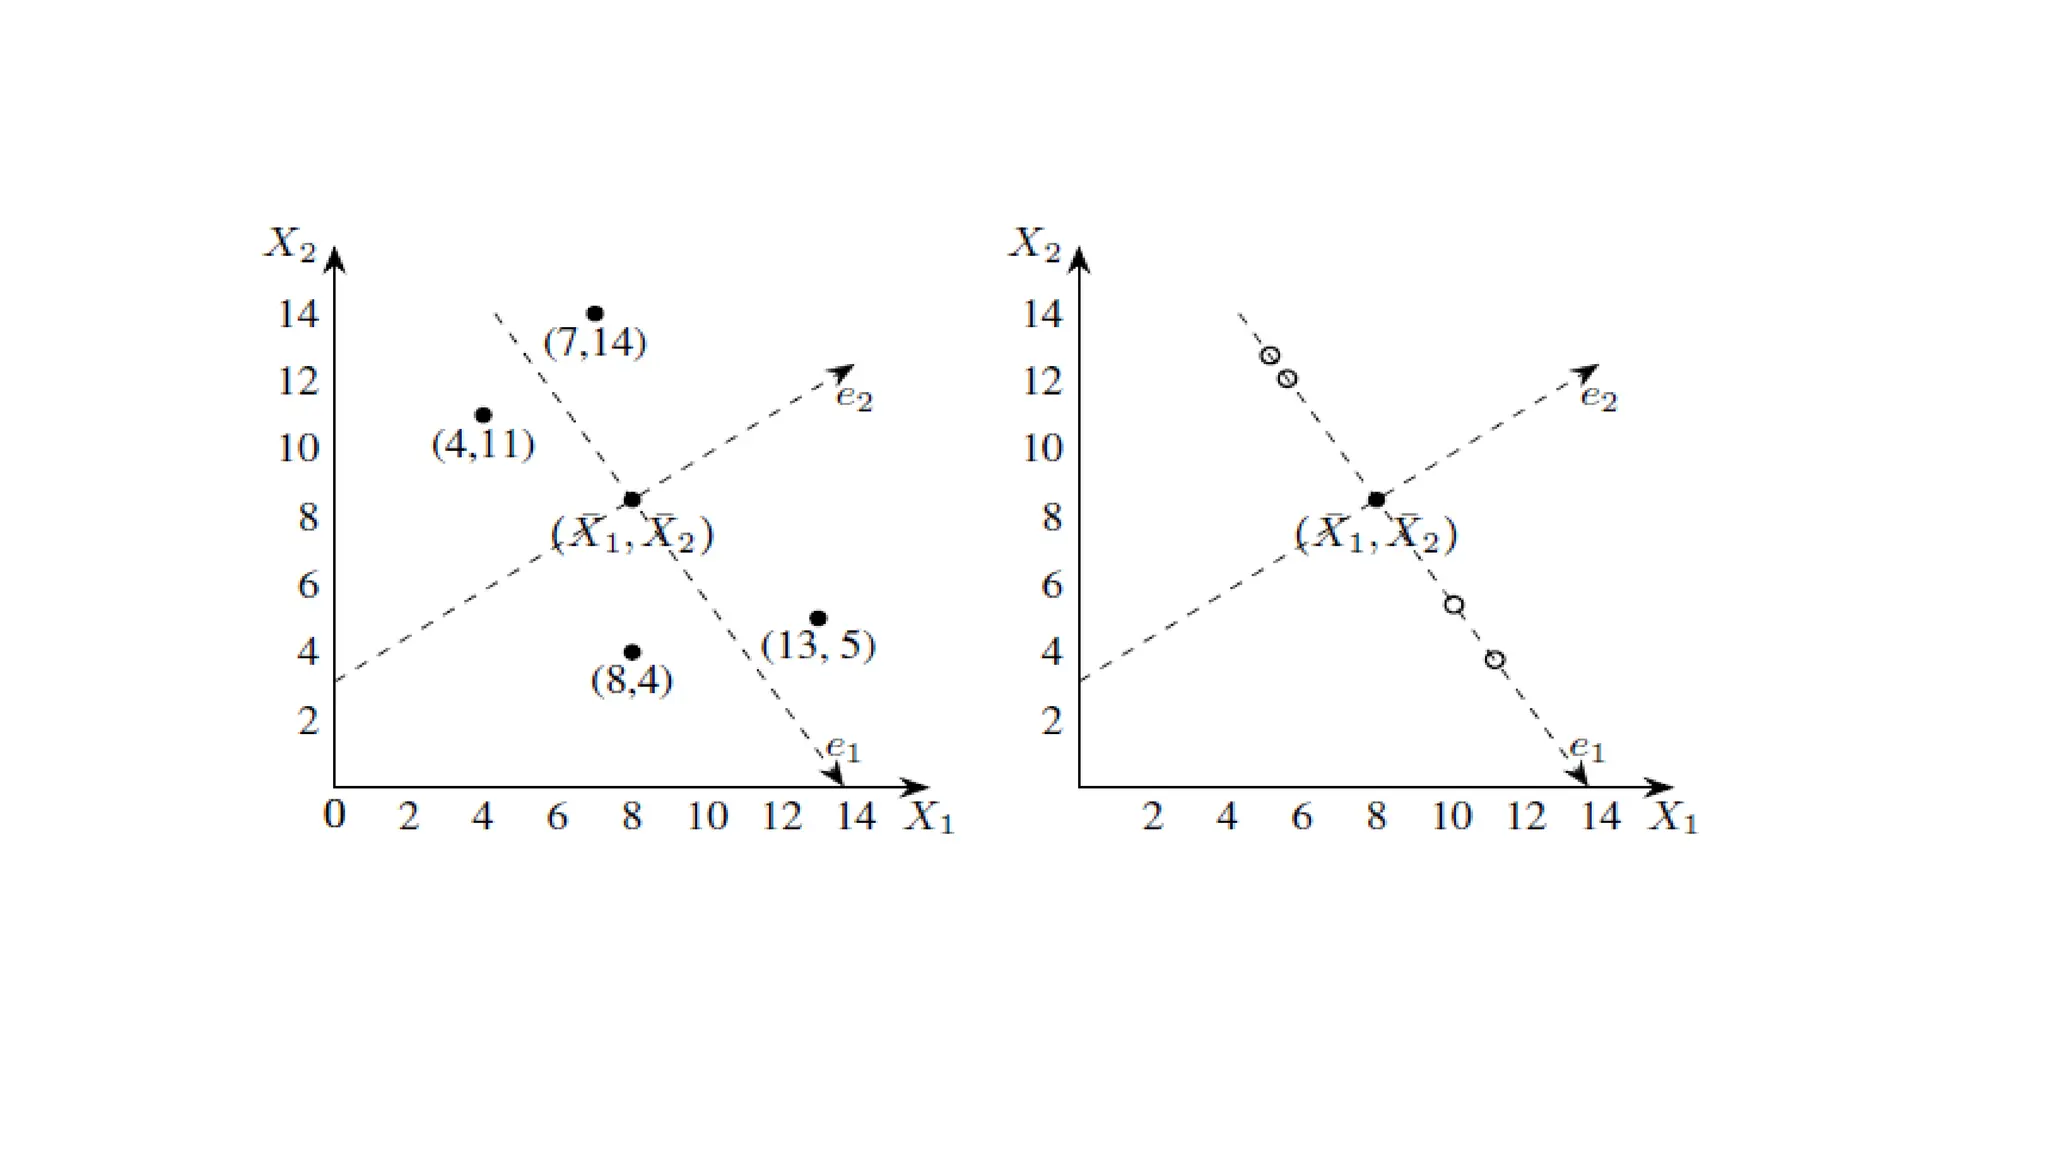
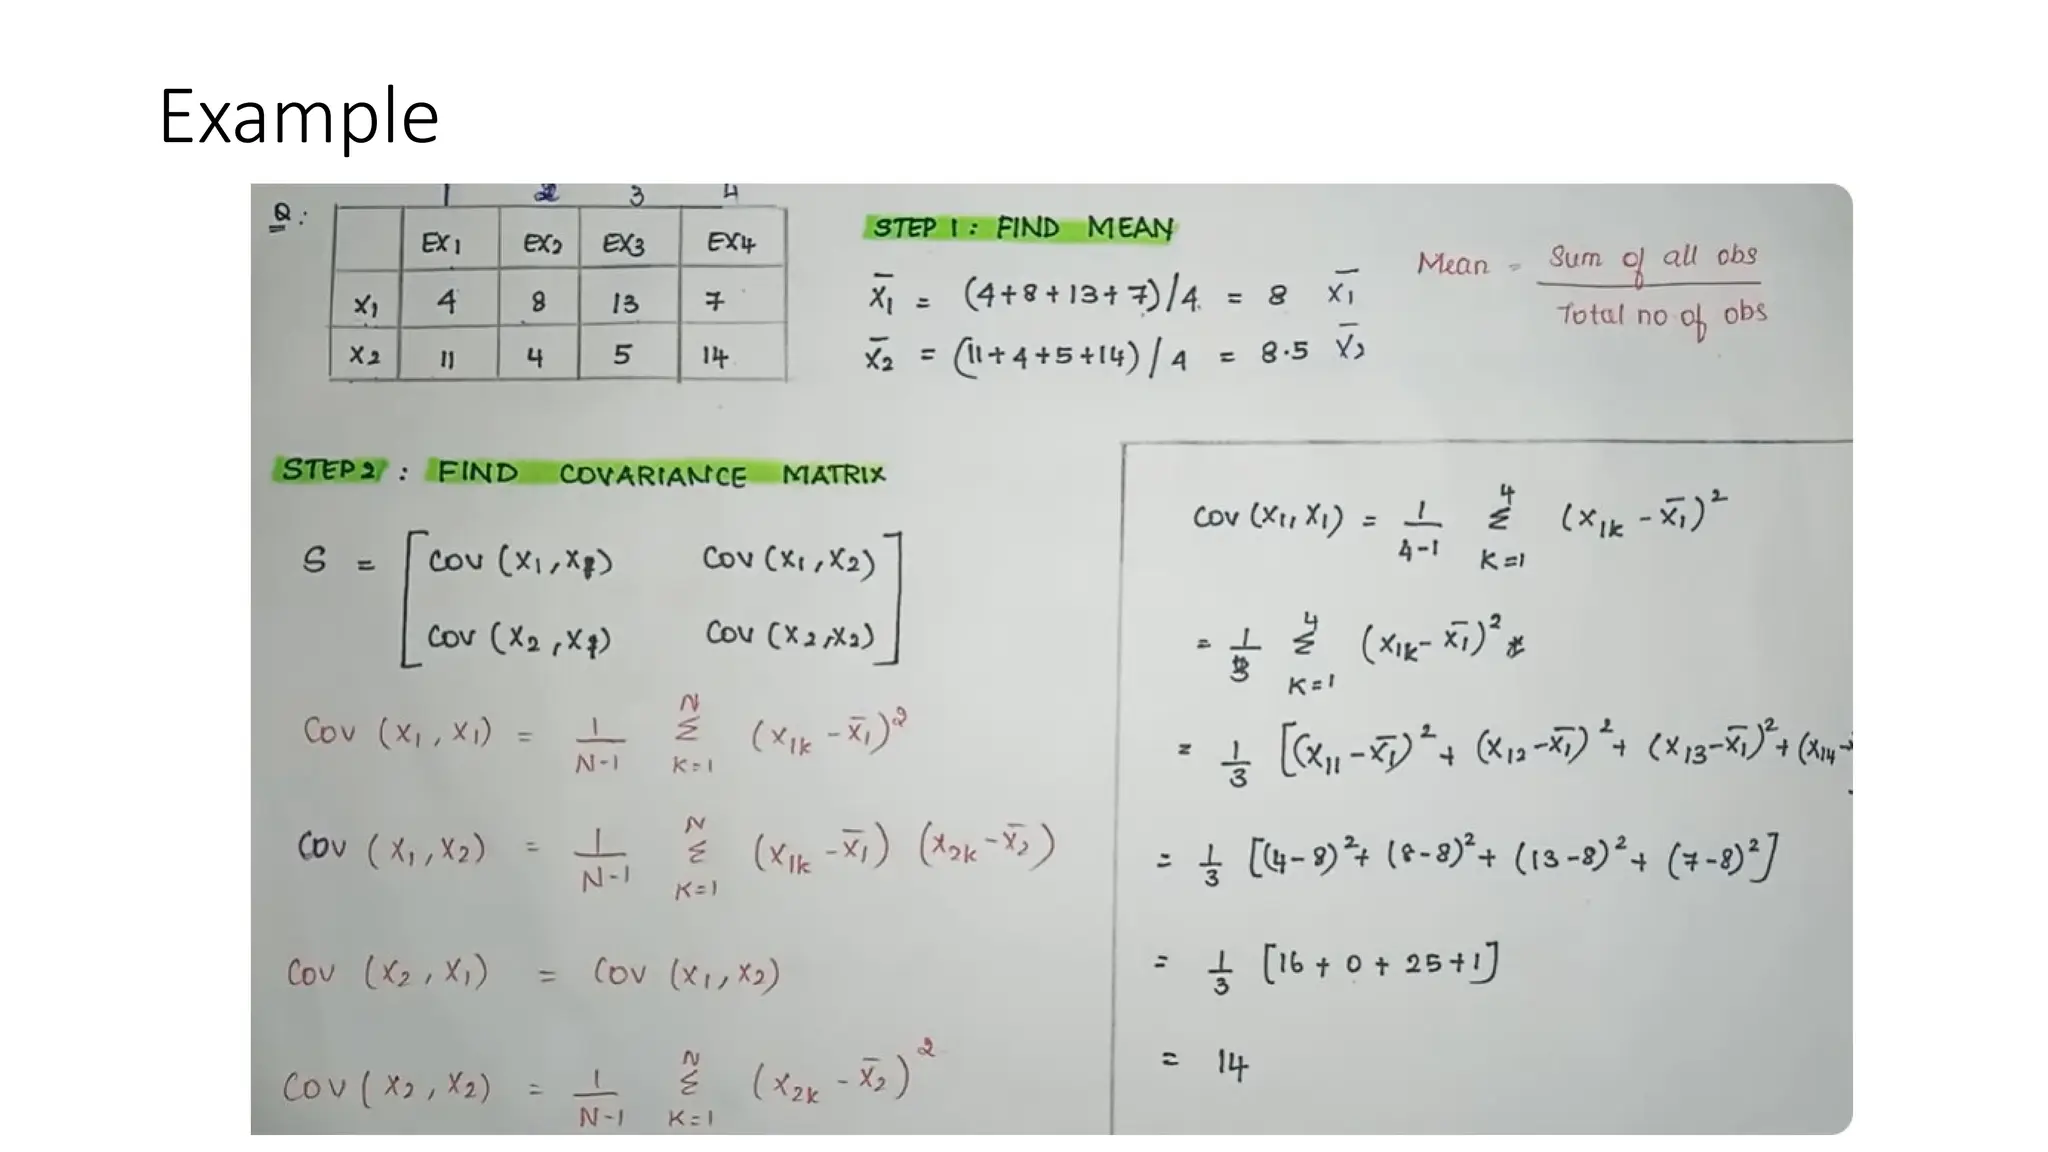
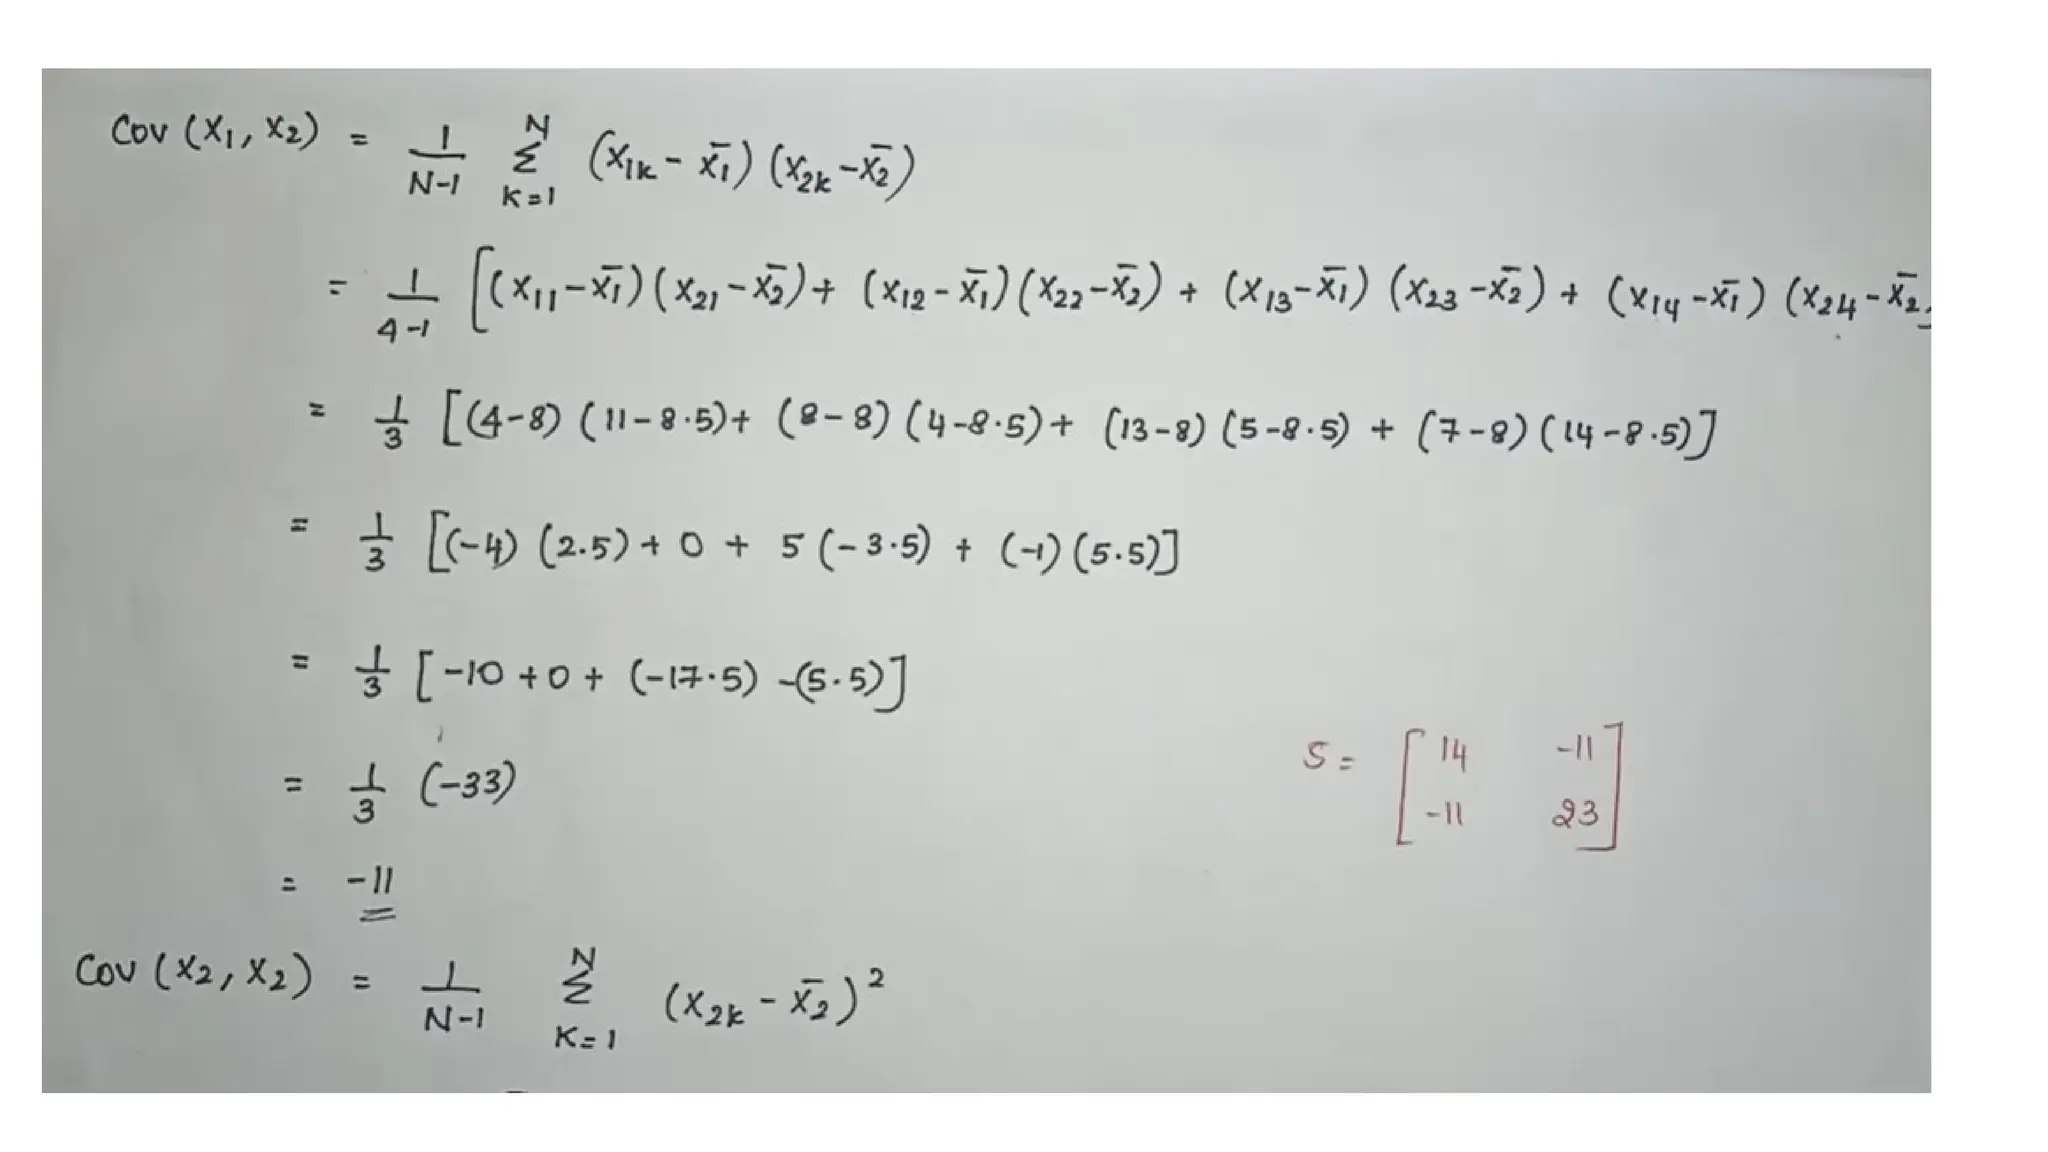
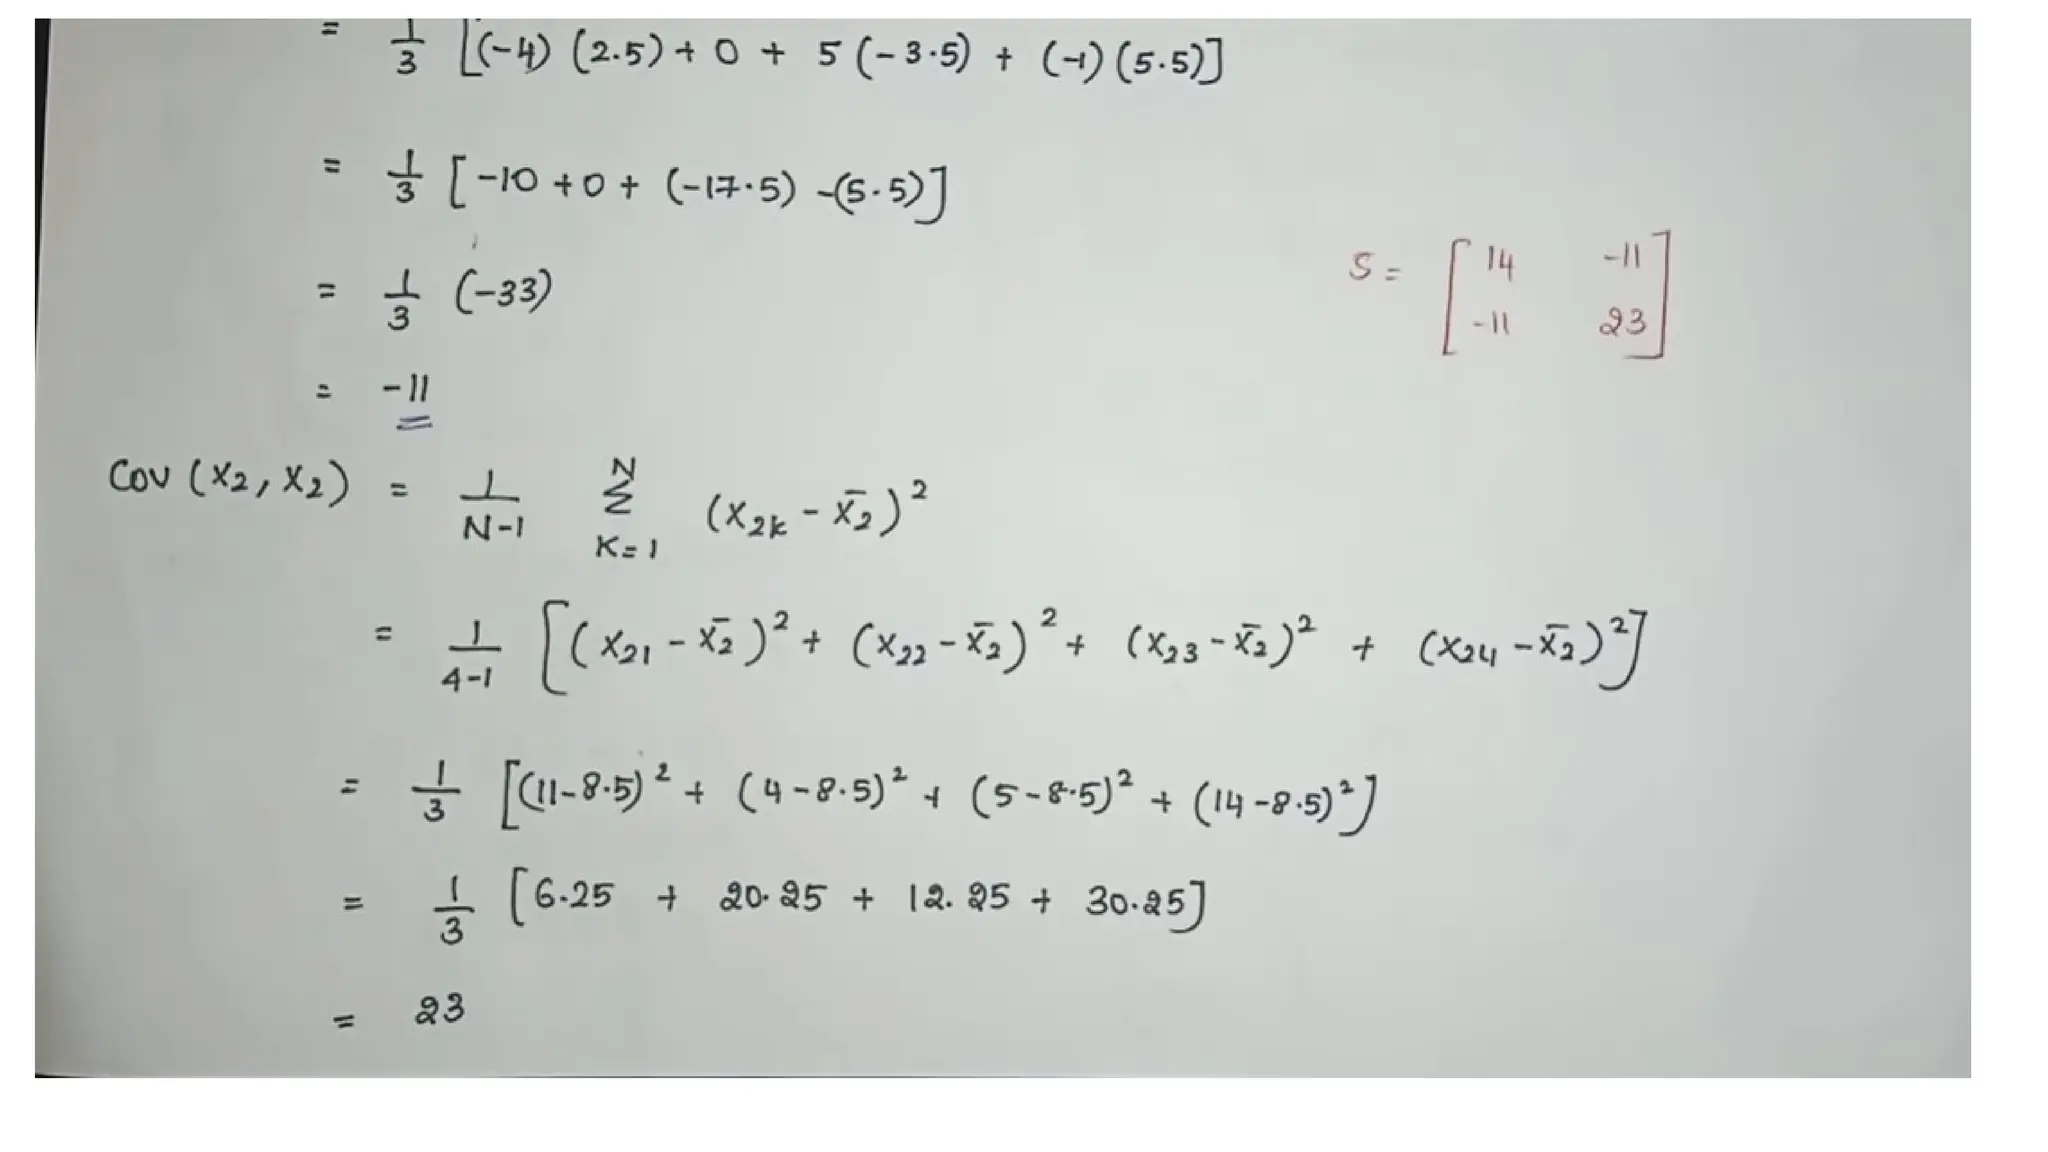
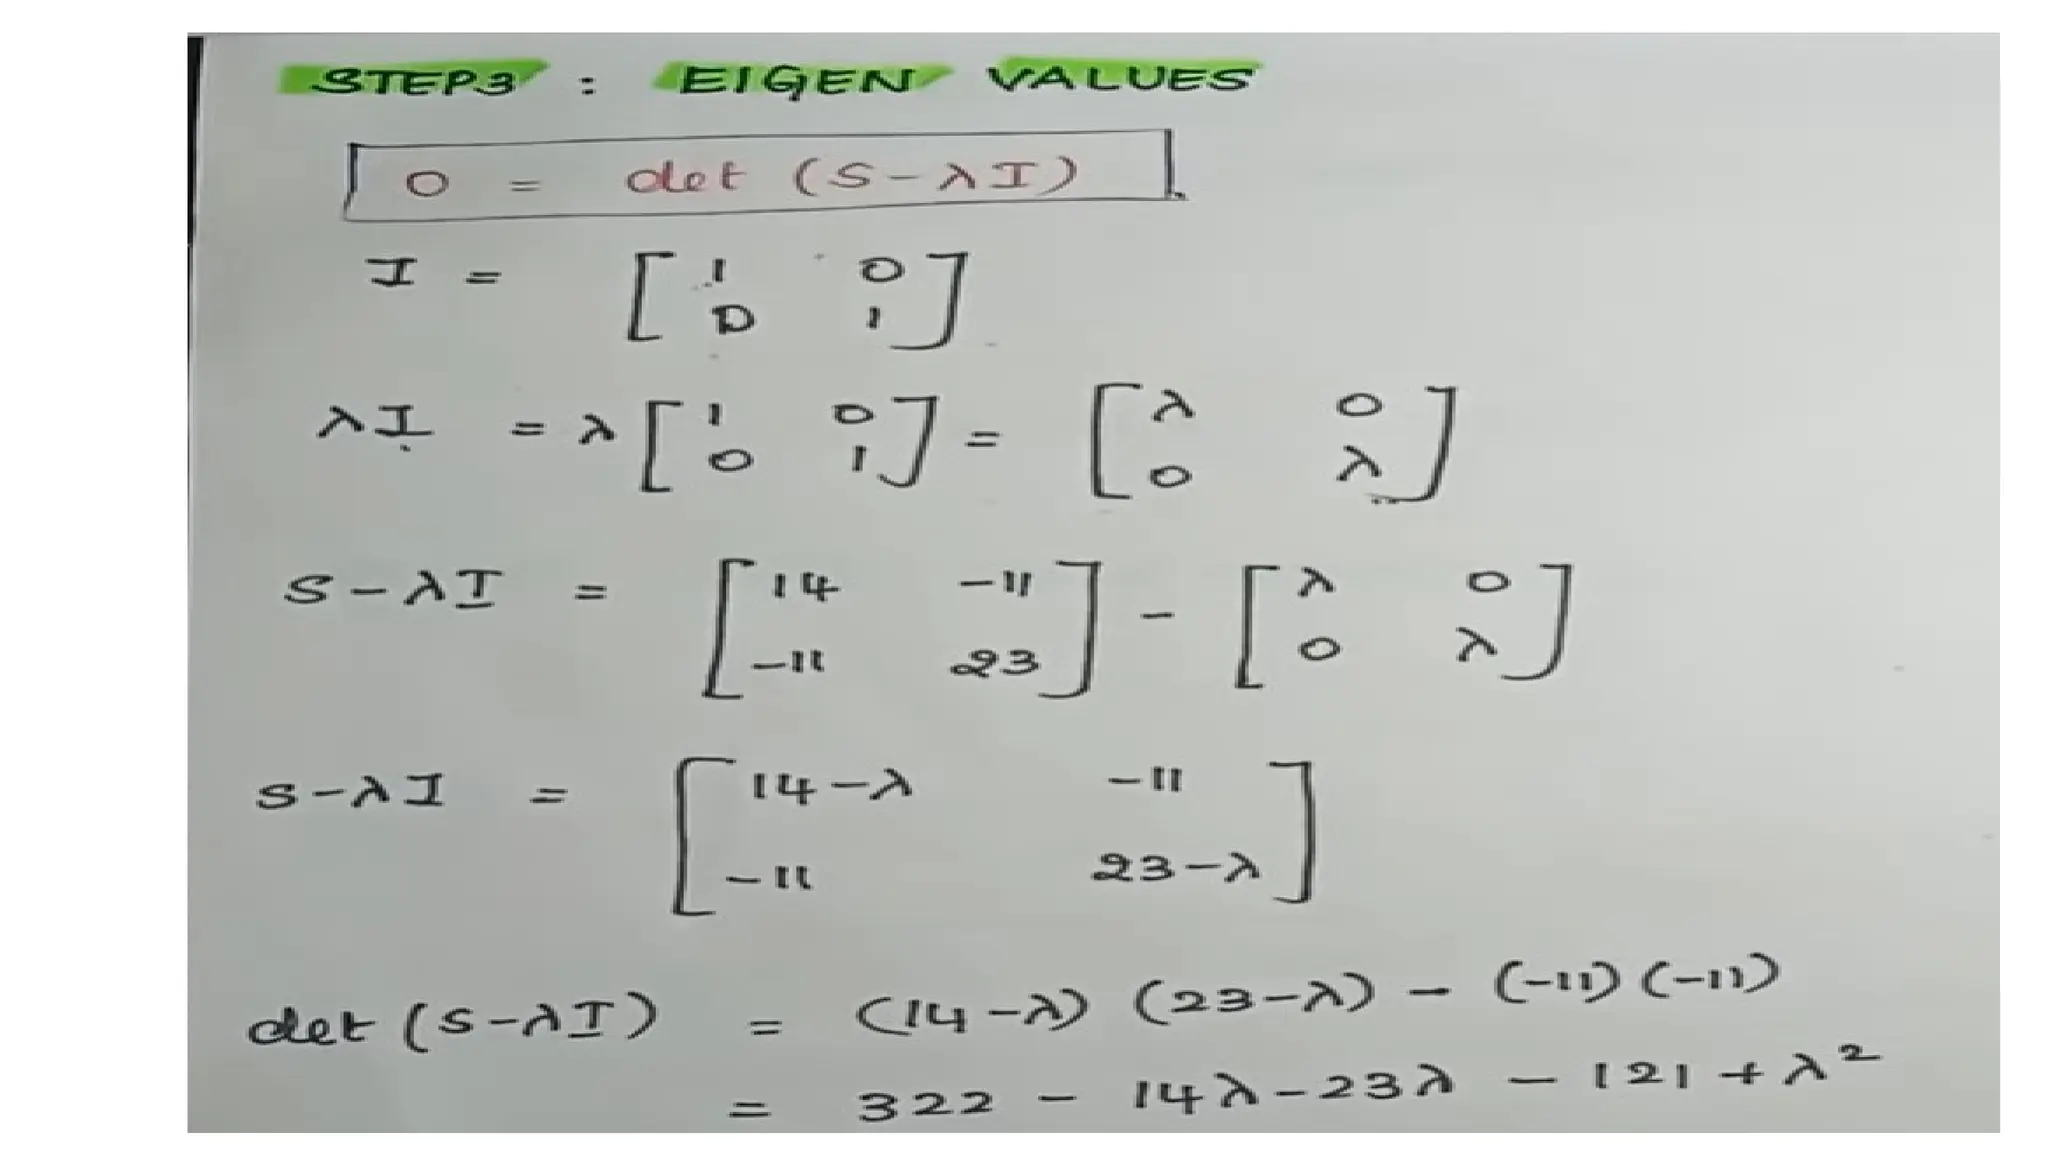
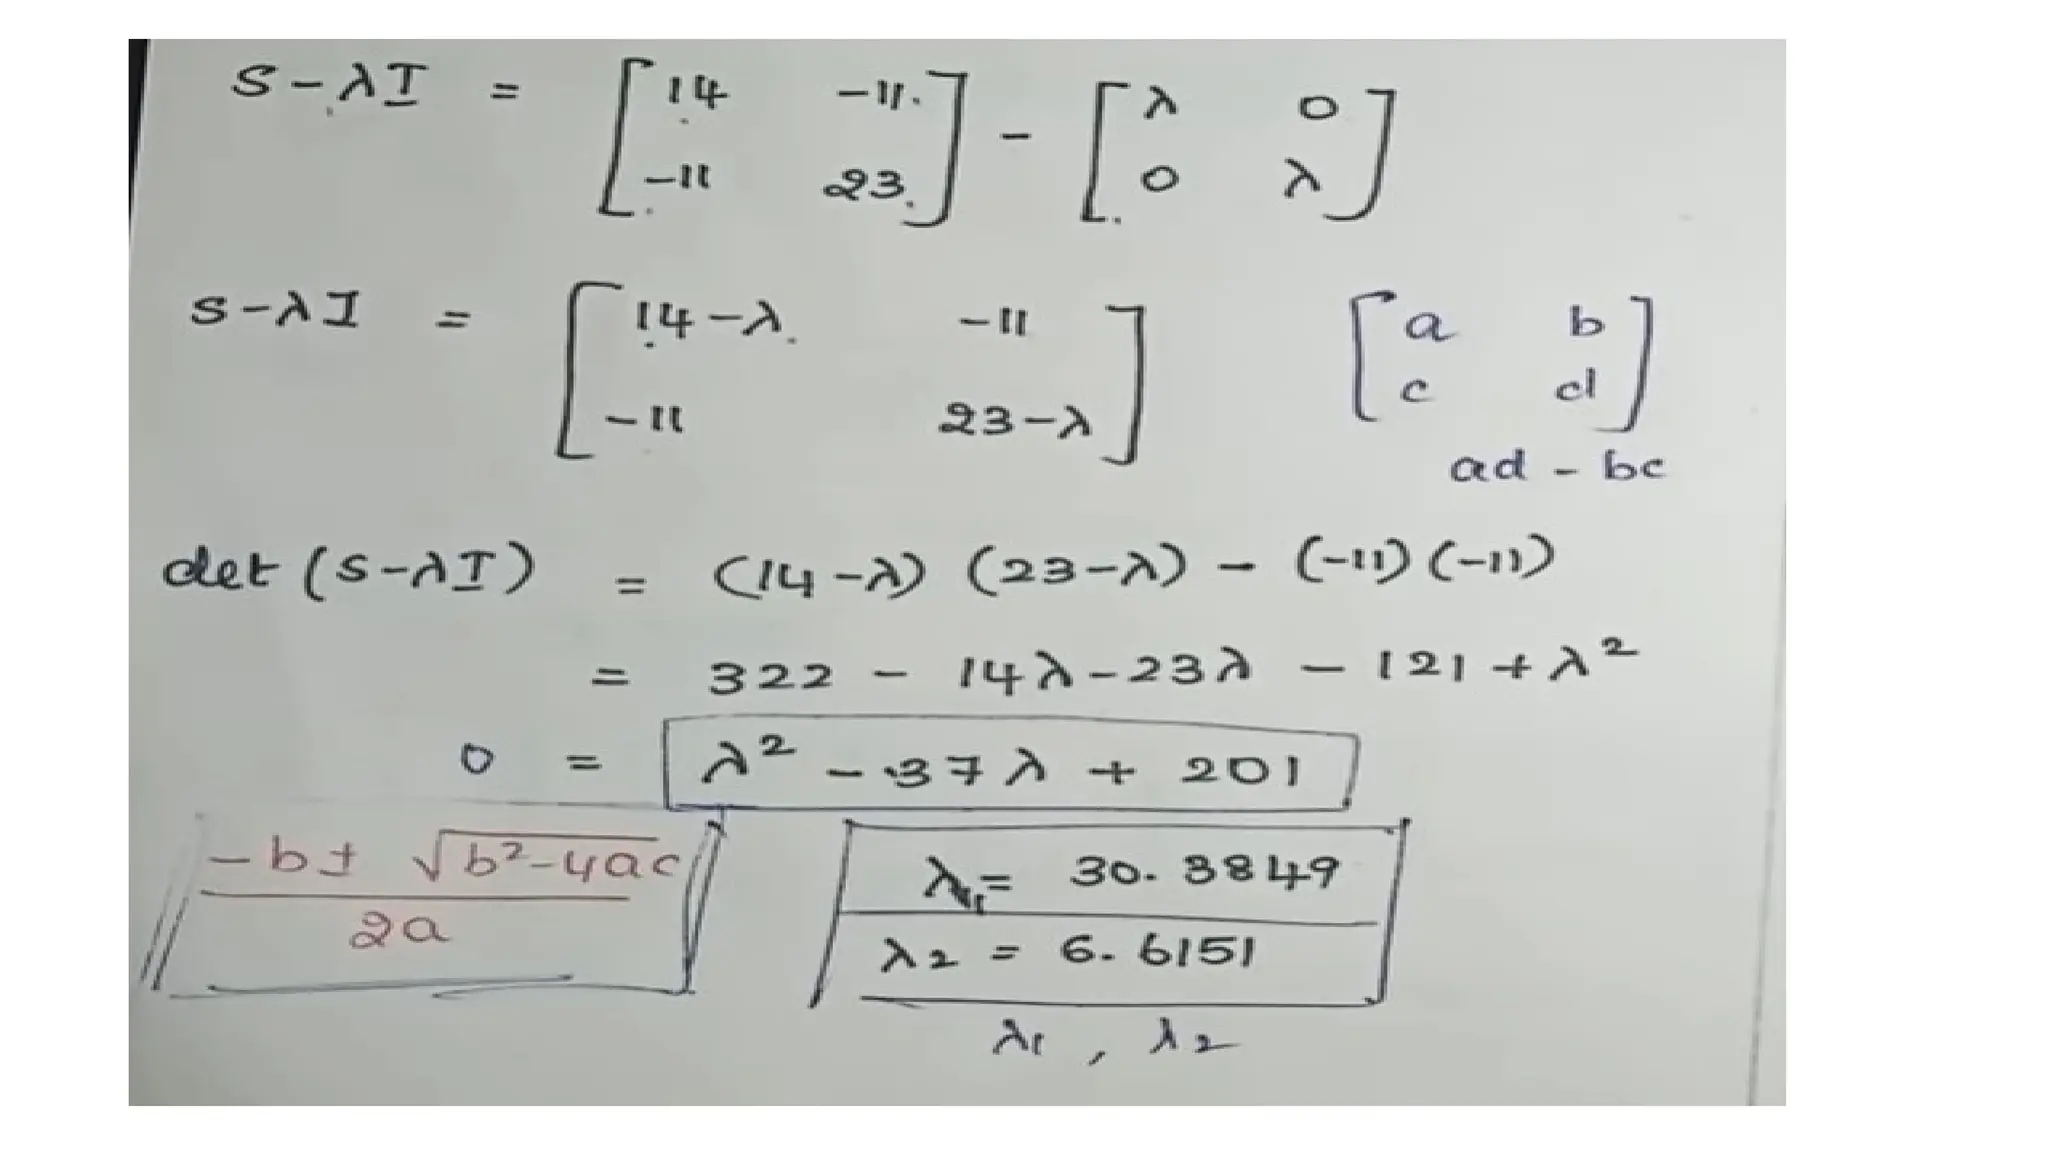
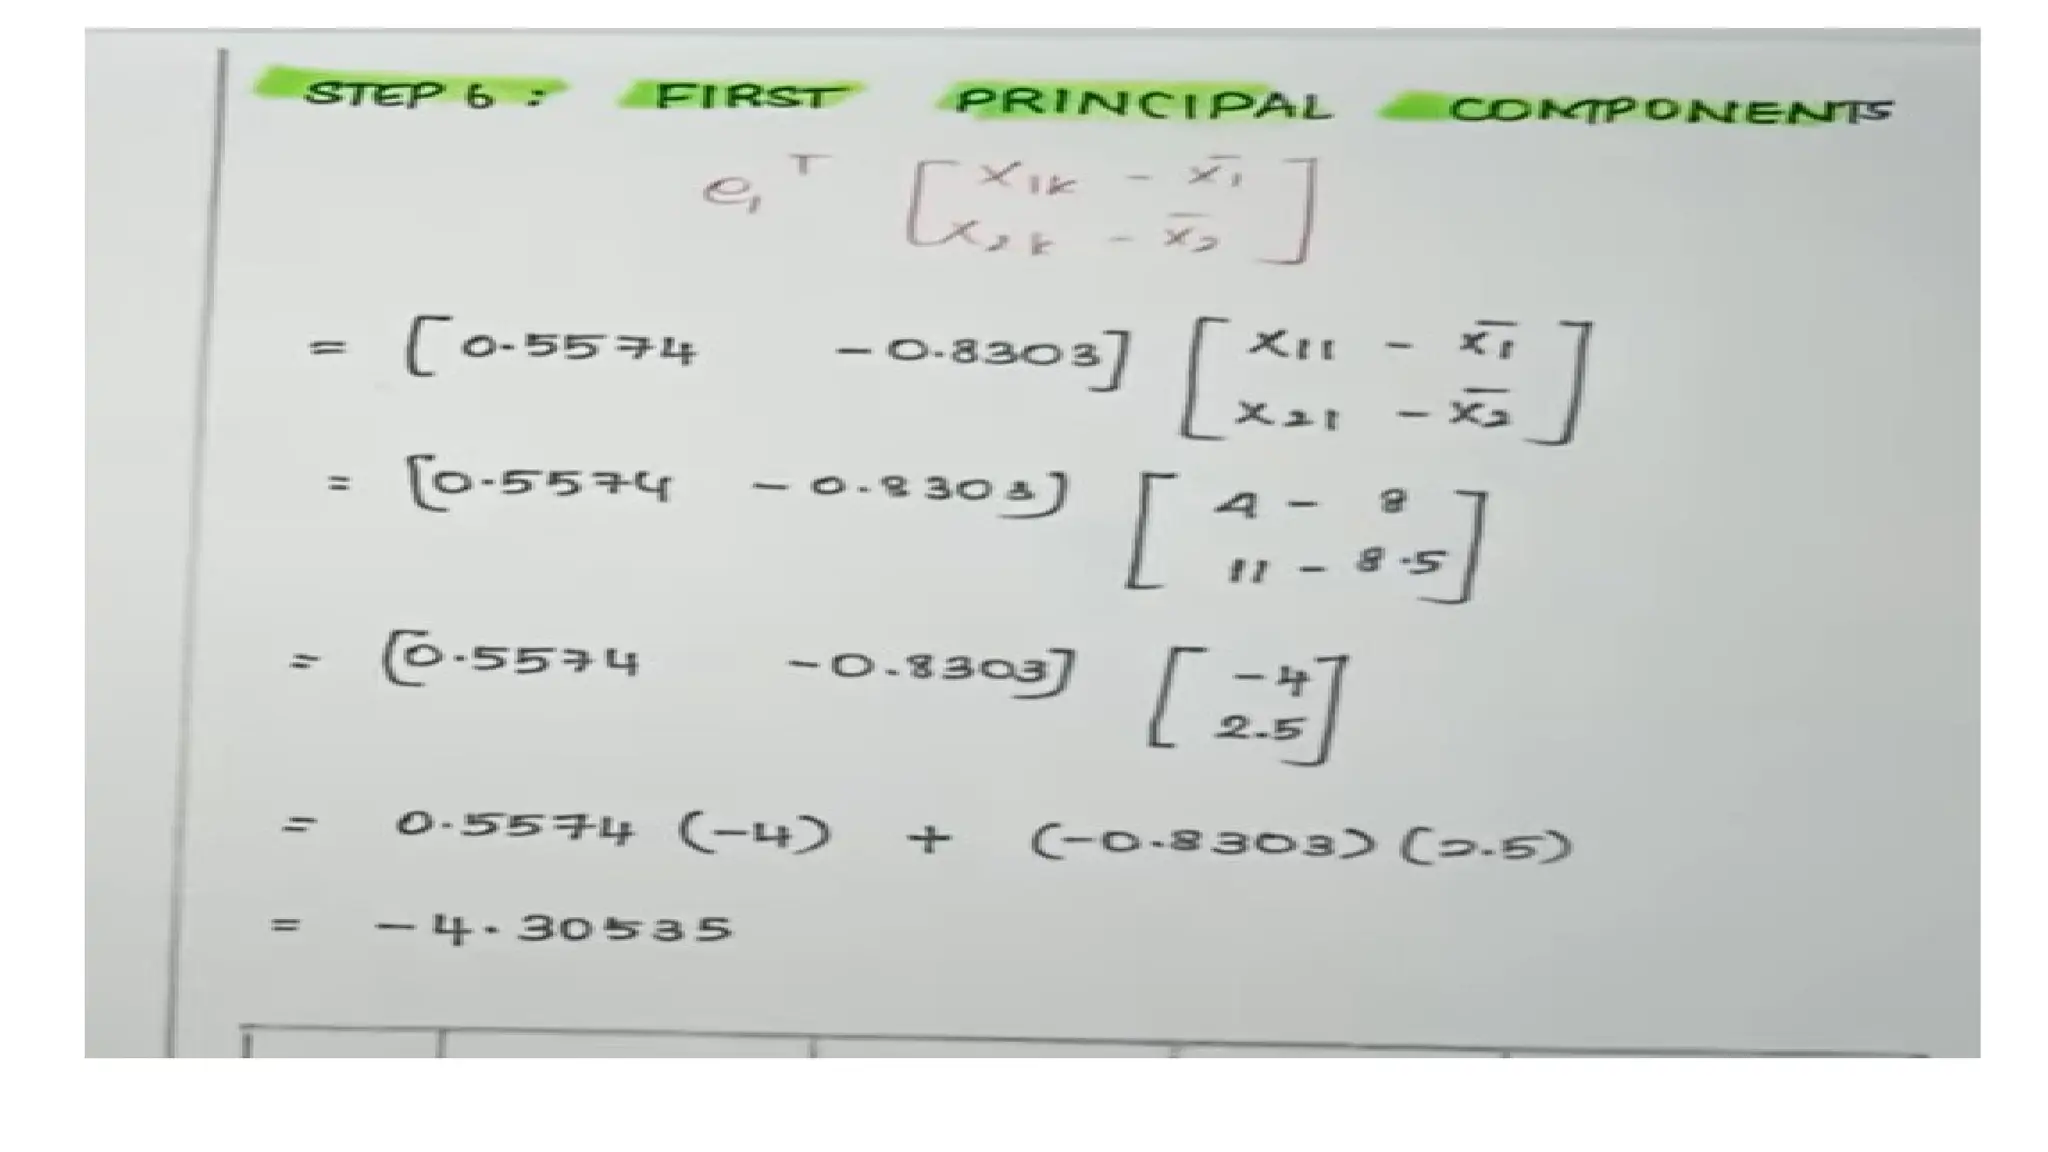
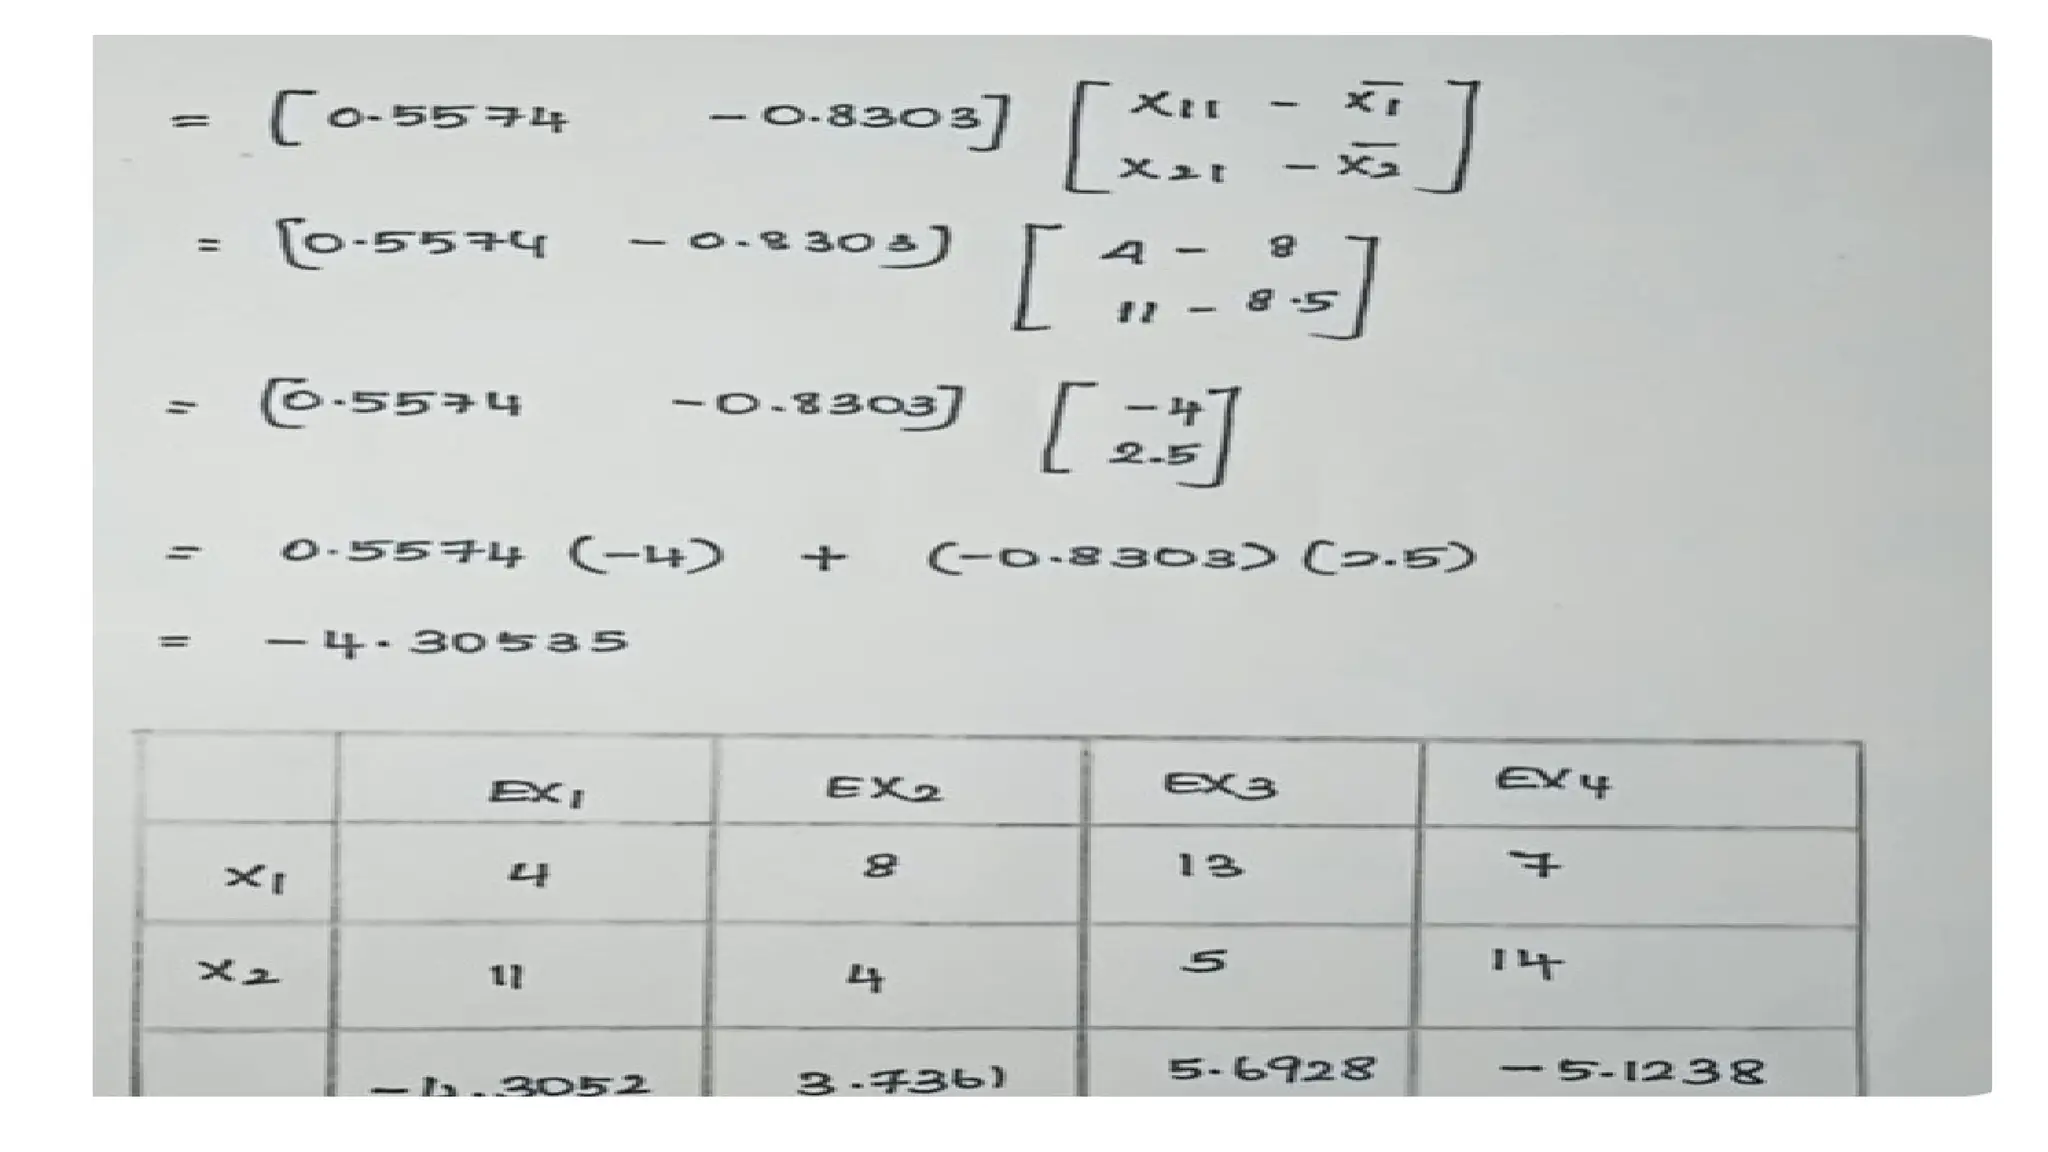
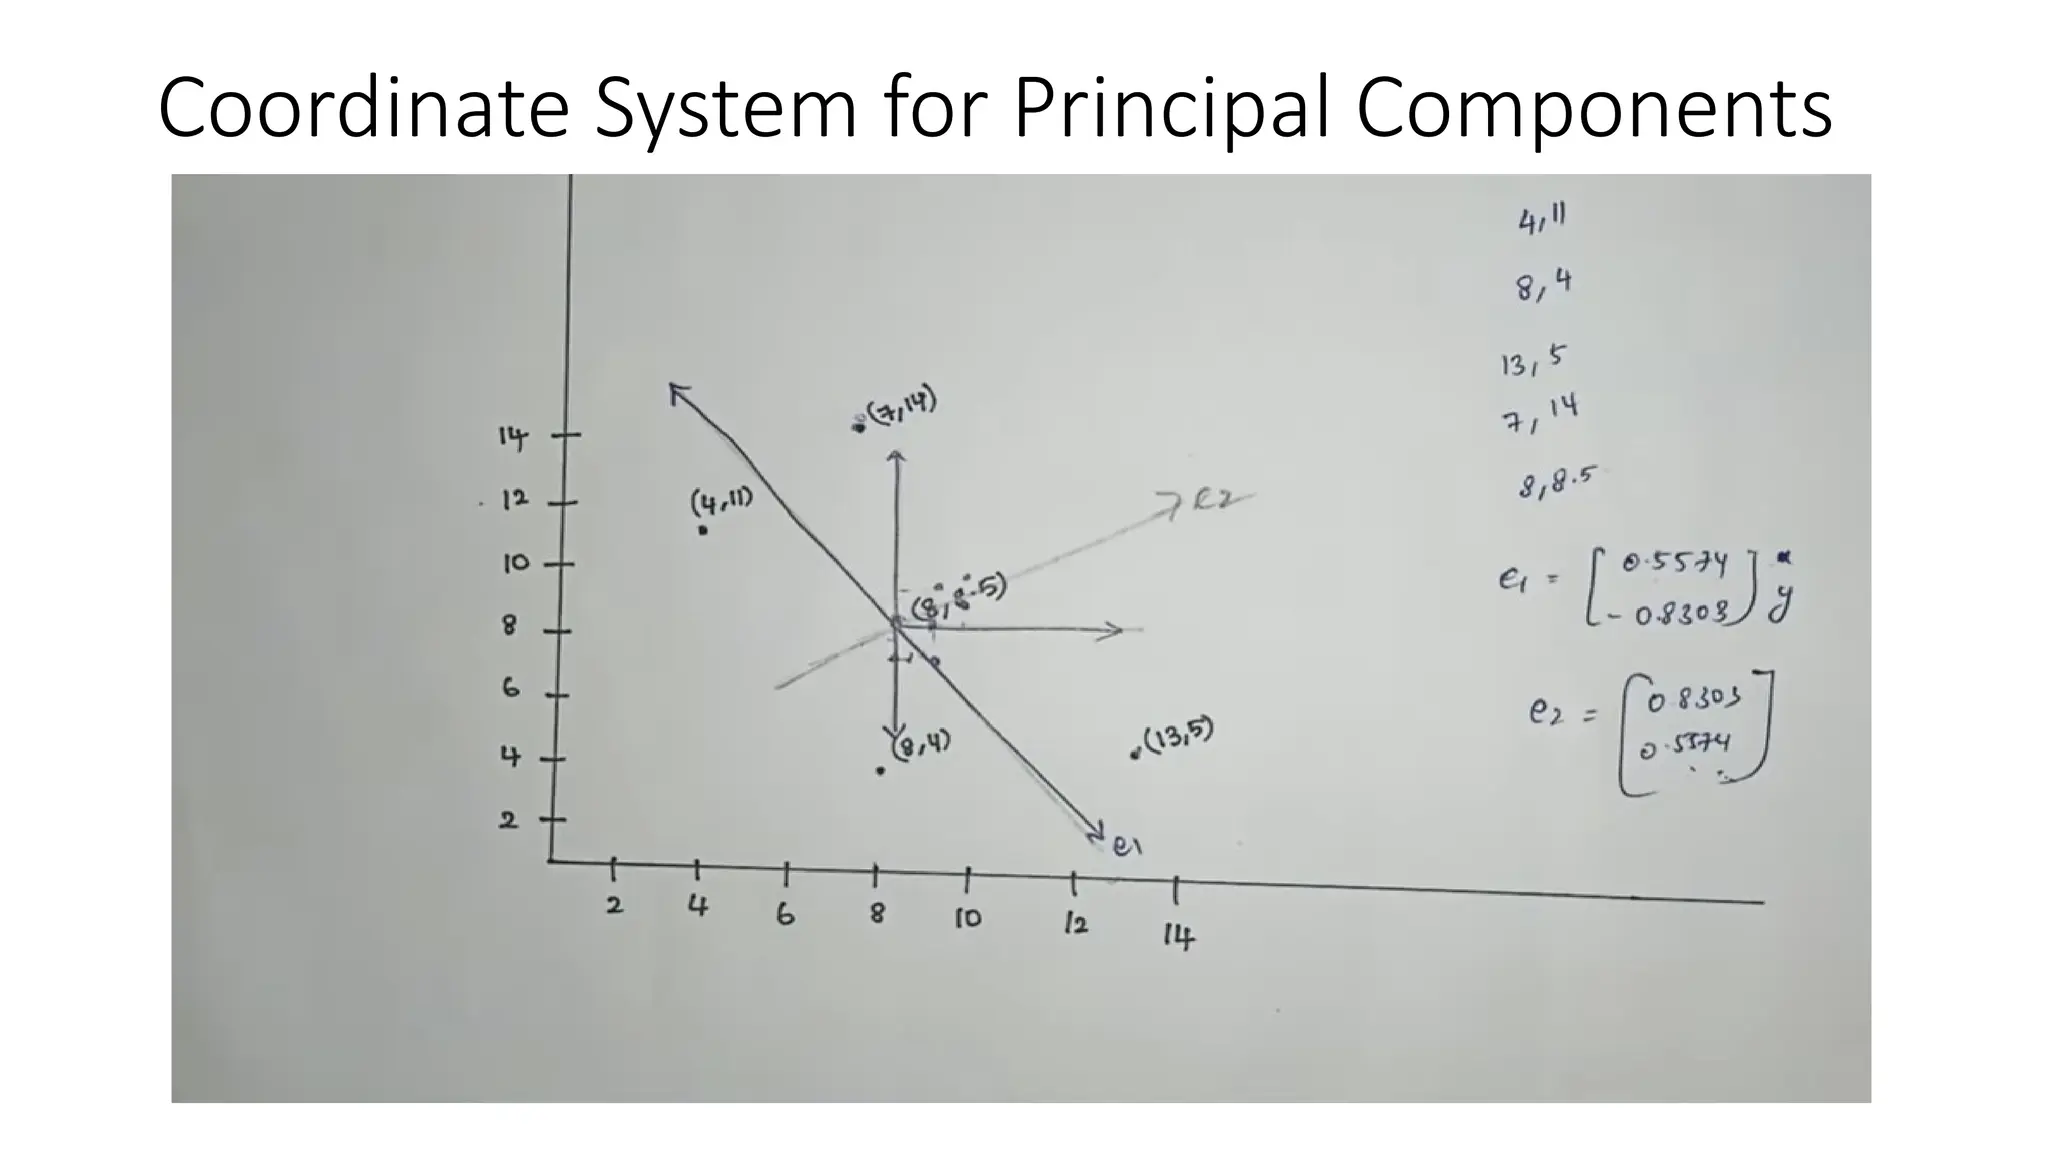
Principal Component Analysis (PCA) is a dimensionality reduction technique that transforms high-dimensional datasets into a new coordinate system, maximizing variance to simplify data while preserving key information. It uses the covariance matrix to identify relationships between features and employs eigenvalues and eigenvectors to determine directions of maximum variance. PCA helps mitigate issues related to high-dimensional data, such as overfitting and visualization challenges, by filtering out noise and focusing on significant features.