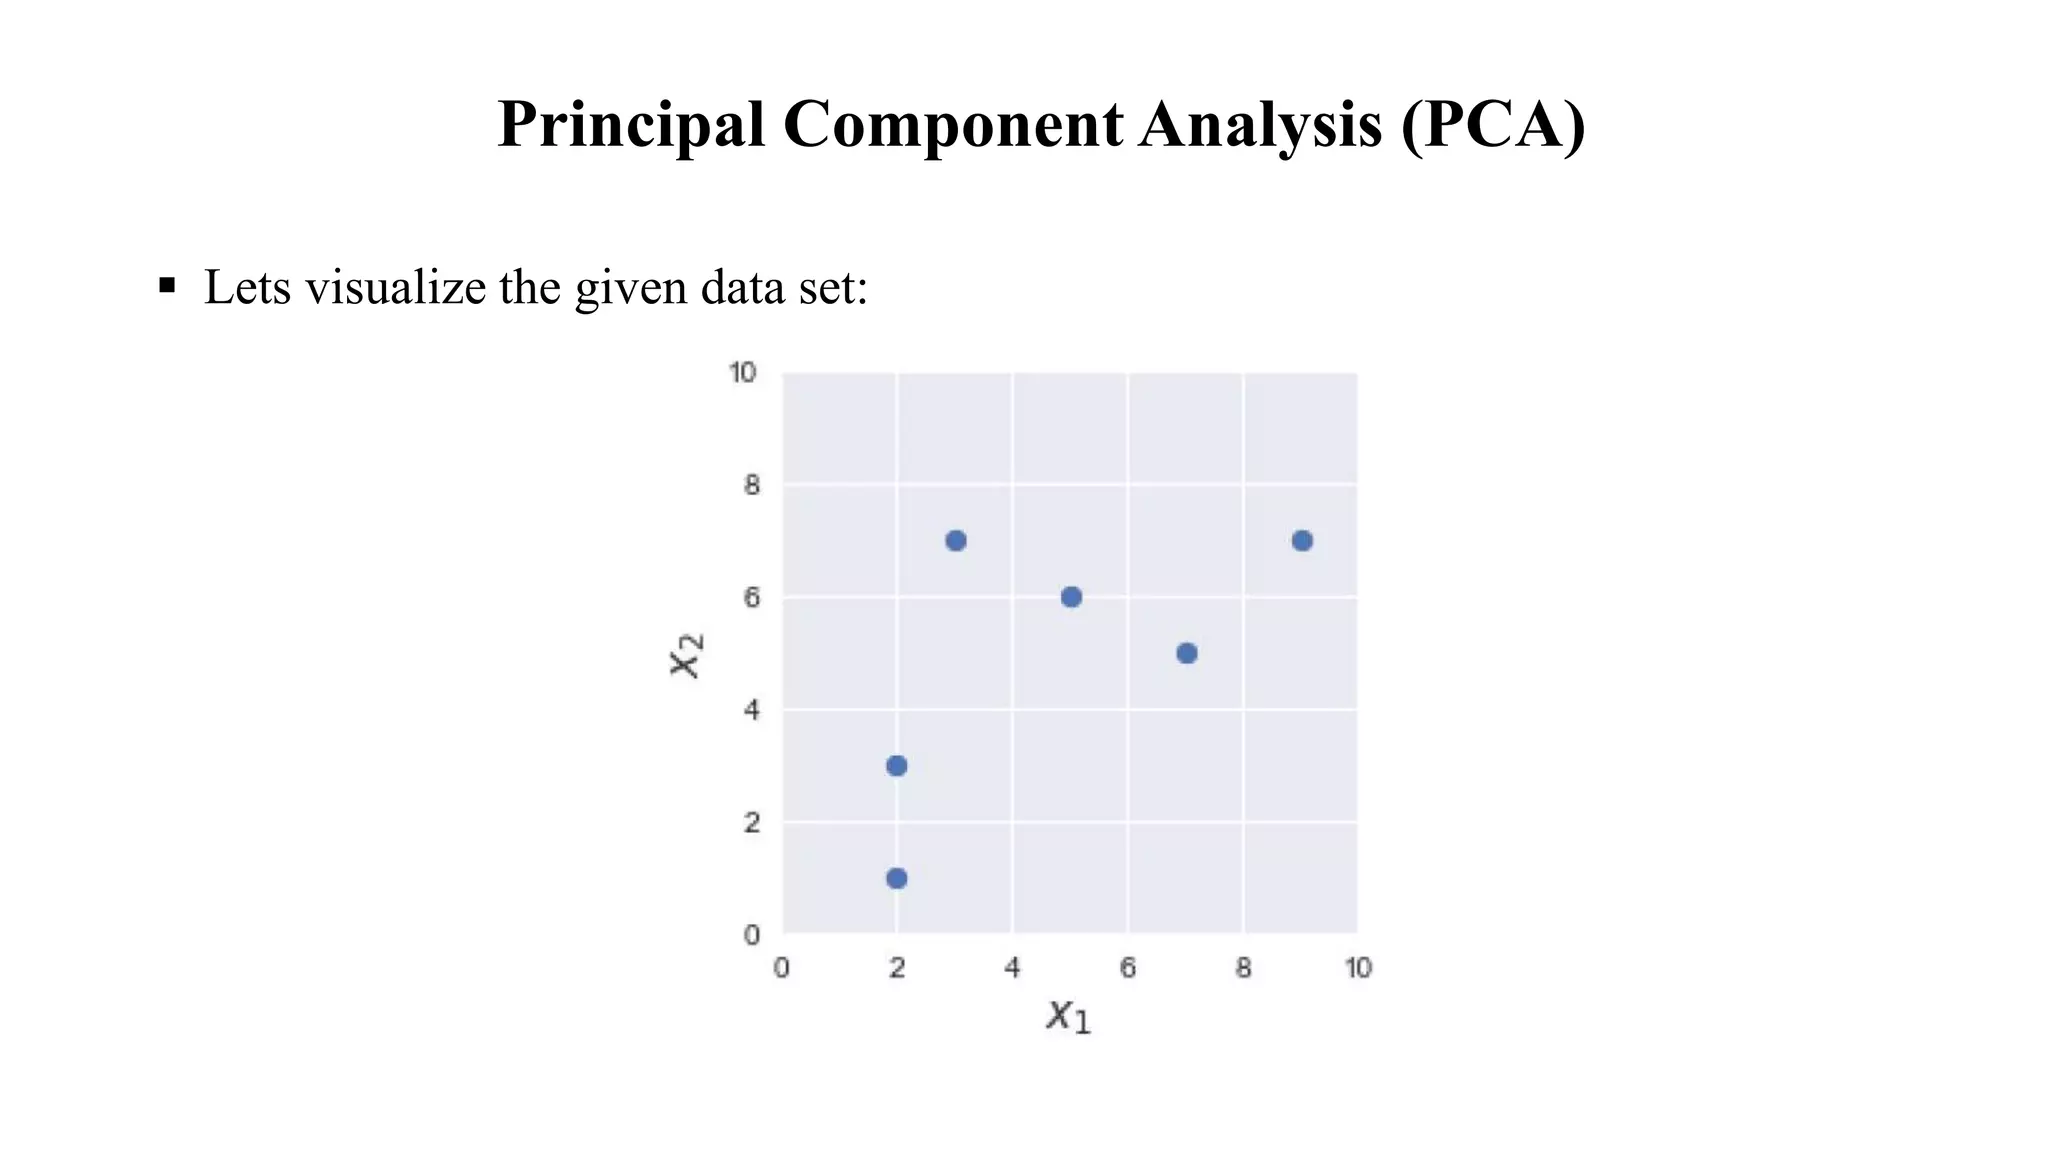
Dimensionality Reduction
Principal Component Analysis (PCA)
 The central idea of principal component analysis (PCA) is to reduce the
dimensionality of a data set consisting of a large number of interrelated
features while retaining as much as possible of the variation present in the
data set.
 This is achieved by transforming to a new set of features, the principal
components (PCs), which are uncorrelated, and which are ordered so that
the first few retain most of the variation present in all of the original
features.
Principal Component Analysis (PCA)
Mathematics Behind PCA
 PCA can be thought of as an unsupervised learning problem.
 The whole process of PCA can be summarized as follows:
• Standardize the given set of d-dimensional samples using Z-score Normalization.
• Compute the covariance matrix of the standardized dataset.
• Compute the eigenvectors and the corresponding eigenvalues of the
covariance matrix.
• Sort the eigenvectors by decreasing order of eigenvalues and choose the
eigenvectors corresponding to the largest k eigenvalues to form a d × k
dimensional matrix W
• Use this d × k eigenvector matrix W to transform the samples onto the new subspace
 Consider the following two-dimensional dataset with features x1 and x2:
 Our goal is to use PCA to reduce the dimensions of our dataset from
two to one, that is, from to R2 to R
Principal Component Analysis (PCA)
 Lets visualize the given data set:
Principal Component Analysis (PCA)
1. Standardization of the given dataset
 Suppose we want to perform PCA on two features - a person's age and weight. If the unit of
weight is in grams, then the magnitude of its spread or variance will be much larger than that
of the age feature.
 The variance of the weight would be in the order of magnitude of say 10,000 while that of
age would be say 10.
 As PCA uses the variance of each features to reduce the dimensionality, it would focus more
on extracting information from features with higher variances and ignore the other features of
less variance.
 The way to overcome this is to initially perform standardization such that all the features are
transformed to the same unitless scale. In PCA, we perform Z-score normalization
Principal Component Analysis (PCA)
1. Standardization of the given dataset
 Z-score normalization is performed as follows:
 After performing this standardization, the transformed features would each have a mean
of 0 and a standard deviation of 1.
Principal Component Analysis (PCA)
1. Standardization of the given dataset
 As an example, let's manually standardize our first feature x1. We first need to compute
the mean and the variance of this feature. We begin with the mean:
 Next, let's compute the standard deviation:
Principal Component Analysis (PCA)
1. Standardization of the given dataset
 Now, we can compute each scaled value of x1 as :
Principal Component Analysis (PCA)
1. Standardization of the given dataset
 For example, to compute the first value:
 We repeat this process for the rest of the values in the feature to finally obtain the scaled
feature z1.
Principal Component Analysis (PCA)
1. Standardization of the given dataset
 Remember that we've only standardized the feature x1 - we need to repeat the entire process
(starting with computing the mean and standard deviation) for the feature x2 also. The data set
after Z-score normalization will be as follows:
Z1 Z2
1 1.650 0.990
2 0.889 0.078
3 -0.637 0.990
4 0.126 0.534
5 -1.019 -0.835
6 -1.019 -1.749
Principal Component Analysis (PCA)
1. Standardization of the given dataset
 Our dataset visually looks like the following after standardization
 As we can see, the layout of the points still looks similar even after standardization,
and they are now centered around the origin!
Principal Component Analysis (PCA)
 The next step of PCA is to find a line (also known as principal components ) on which to
project the given samples that captures the relationship between the two features well.
 How well the relationship is captured is based on how much variance is preserved when the
samples are projected onto the line.
Finding the principal components
Principal Component Analysis (PCA)
Finding the principal components
 Let's intuitively understand what is meant by finding the principal components,
consider the following example. Suppose we have the following samples:

Unit3_1.pptx

  • 1.
  • 2.
    Principal Component Analysis(PCA)  The central idea of principal component analysis (PCA) is to reduce the dimensionality of a data set consisting of a large number of interrelated features while retaining as much as possible of the variation present in the data set.  This is achieved by transforming to a new set of features, the principal components (PCs), which are uncorrelated, and which are ordered so that the first few retain most of the variation present in all of the original features.
  • 3.
    Principal Component Analysis(PCA) Mathematics Behind PCA  PCA can be thought of as an unsupervised learning problem.  The whole process of PCA can be summarized as follows: • Standardize the given set of d-dimensional samples using Z-score Normalization. • Compute the covariance matrix of the standardized dataset. • Compute the eigenvectors and the corresponding eigenvalues of the covariance matrix. • Sort the eigenvectors by decreasing order of eigenvalues and choose the eigenvectors corresponding to the largest k eigenvalues to form a d × k dimensional matrix W • Use this d × k eigenvector matrix W to transform the samples onto the new subspace
  • 4.
     Consider thefollowing two-dimensional dataset with features x1 and x2:  Our goal is to use PCA to reduce the dimensions of our dataset from two to one, that is, from to R2 to R Principal Component Analysis (PCA)
  • 5.
     Lets visualizethe given data set: Principal Component Analysis (PCA)
  • 6.
    Principal Component Analysis(PCA) 1. Standardization of the given dataset  Suppose we want to perform PCA on two features - a person's age and weight. If the unit of weight is in grams, then the magnitude of its spread or variance will be much larger than that of the age feature.  The variance of the weight would be in the order of magnitude of say 10,000 while that of age would be say 10.  As PCA uses the variance of each features to reduce the dimensionality, it would focus more on extracting information from features with higher variances and ignore the other features of less variance.  The way to overcome this is to initially perform standardization such that all the features are transformed to the same unitless scale. In PCA, we perform Z-score normalization
  • 7.
    Principal Component Analysis(PCA) 1. Standardization of the given dataset  Z-score normalization is performed as follows:  After performing this standardization, the transformed features would each have a mean of 0 and a standard deviation of 1.
  • 8.
    Principal Component Analysis(PCA) 1. Standardization of the given dataset  As an example, let's manually standardize our first feature x1. We first need to compute the mean and the variance of this feature. We begin with the mean:  Next, let's compute the standard deviation:
  • 9.
    Principal Component Analysis(PCA) 1. Standardization of the given dataset  Now, we can compute each scaled value of x1 as :
  • 10.
    Principal Component Analysis(PCA) 1. Standardization of the given dataset  For example, to compute the first value:  We repeat this process for the rest of the values in the feature to finally obtain the scaled feature z1.
  • 11.
    Principal Component Analysis(PCA) 1. Standardization of the given dataset  Remember that we've only standardized the feature x1 - we need to repeat the entire process (starting with computing the mean and standard deviation) for the feature x2 also. The data set after Z-score normalization will be as follows: Z1 Z2 1 1.650 0.990 2 0.889 0.078 3 -0.637 0.990 4 0.126 0.534 5 -1.019 -0.835 6 -1.019 -1.749
  • 12.
    Principal Component Analysis(PCA) 1. Standardization of the given dataset  Our dataset visually looks like the following after standardization  As we can see, the layout of the points still looks similar even after standardization, and they are now centered around the origin!
  • 13.
    Principal Component Analysis(PCA)  The next step of PCA is to find a line (also known as principal components ) on which to project the given samples that captures the relationship between the two features well.  How well the relationship is captured is based on how much variance is preserved when the samples are projected onto the line. Finding the principal components
  • 14.
    Principal Component Analysis(PCA) Finding the principal components  Let's intuitively understand what is meant by finding the principal components, consider the following example. Suppose we have the following samples: