Presentation2, radiological imaging of neurodegenerative and dementai disease of adult.
•Download as PPTX, PDF•
17 likes•1,747 views

This document discusses radiological imaging techniques for diagnosing various neurodegenerative diseases and dementias. It provides an overview of different neurodegenerative diseases categorized by their underlying pathological processes including synucleinopathies, tauopathies, cerebral amyloidosis, spinocerebellar ataxias, and prion diseases. It then focuses on Alzheimer's disease, providing details on structural changes seen on MRI, patterns of hypometabolism on FDG-PET and amyloid deposition on amyloid PET. Imaging patterns of other diseases like vascular dementia, frontotemporal dementia, dementia with Lewy bodies, and corticobasal degeneration are also summarized.
![Neurodegenerative diseases
Neurodegenerative diseases are legion and their classification just as
protean. A useful approach is to divide them according to underlying
pathological process, although even using this schema, there is much
overlap and thus resulting confusion.
Neurodegenerative diseases.
Synucleinopathies
Diseases with Lewy bodies[+]
Multiple systemic atrophy(MSA) [+]
Tauopathies:
Alzheimer disease [+]
Chronic traumatic encephalopathy(CTE)
Corticobasal degeneration
Front-temporal lobar degeneration (FTLD) (not all are tau) [+]
Pick disease
Progressive supra-nuclear palsy(PSP)](data:image/gif;base64,R0lGODlhAQABAIAAAAAAAP///yH5BAEAAAAALAAAAAABAAEAAAIBRAA7)
Recommended
More Related Content
What's hot
What's hot (20)
Similar to Presentation2, radiological imaging of neurodegenerative and dementai disease of adult.
Similar to Presentation2, radiological imaging of neurodegenerative and dementai disease of adult. (20)
More from Abdellah Nazeer
More from Abdellah Nazeer (20)
Recently uploaded
Recently uploaded (20)
Presentation2, radiological imaging of neurodegenerative and dementai disease of adult.
- 1. Radiological Imaging of Neurodegenerative Diseases And Dementia of Adults. Dr/ ABD ALLAH NAZEER. MD.
- 2. Neurodegenerative diseases Neurodegenerative diseases are legion and their classification just as protean. A useful approach is to divide them according to underlying pathological process, although even using this schema, there is much overlap and thus resulting confusion. Neurodegenerative diseases. Synucleinopathies Diseases with Lewy bodies[+] Multiple systemic atrophy(MSA) [+] Tauopathies: Alzheimer disease [+] Chronic traumatic encephalopathy(CTE) Corticobasal degeneration Front-temporal lobar degeneration (FTLD) (not all are tau) [+] Pick disease Progressive supra-nuclear palsy(PSP)
- 3. Cerebral amyloidosis cerebral amyloid angiopathy (CAA)[+] transthyretine-associated cerebral amyloidosis neuronal intranuclear hyaline inclusion disease (NIHID) Spinocerebellar ataxias. Huntington disease Hereditary spastic paraplegia. Amyotrophic lateral sclerosis(ALS) Clinically unclassifiable parkinsonism(CUP) Unverricht-Lundborg disease Prion diseases (not always included as neurodegenerative) Creutzfeldt-Jakob disease (sporadic, variant, familial, and iatrogenic) Fatal familial insomnia Gerstmann-Straussler-Scheinker disease kuru Variably protease sensitive prionopathy
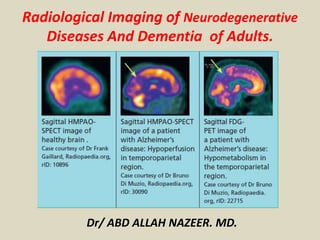
- 6. Alzheimer Disease (AD) represents the underlying cause of approximately 50–80% of all cases of dementia. The incidence of AD doubles every 5 years after the age of 60 years old. Clinically, this disease progresses with decline in episodic memory with or without language or visual difficulties. The prodromal stage of MCI has been defined as cognitive decline greater than expected for age but not interfering with activities of daily living. Progression to AD has been reported in approximately 10–15% of patients with MCI annually. It is difficult to differentiate MCI and AD from cortical atrophy related to normal aging using MRI. Typical structural changes seen in AD occur late in the disease process and include disproportionate hippocampal, amygdala, and temporoparietal volume loss with sparing of the primary sensorimotor cortex. Volumetric software for quantifying hippocampal volumes can be helpful. Visible change within a 12- to 18-month time period on serial imaging has been reported to increase the sensitivity for the diagnosis of AD.
- 7. Brain volume measurements, assessed with segmentation, demonstrate that patients with Alzheimer disease have accelerated rates of brain volume loss, typically around twice normal (1% vs. ~0.5% per year). This is even more marked in the hippocampi, with affected individuals exhibiting three times the volume loss per year (~4.5% vs. ~1.5% per year). Nuclear medicine SPECT and PET are able to detect regional hypoperfusion/hypometabolism in a biparietal and bitemporal distribution. FDG PET 18F-fluorodeoxyglucose (FDG) PET typically shows bilateral temporoparietal, precuneus and posterior cingulate hypometabolism which is usually symmetric. Uptake may be asymmetric in the early stages. The anterior cingulate, visual cortex (eyes should be kept open while scanning to avoid the pitfall of hypometabolism in the visual cortex), basal ganglia, thalami, occipital lobes and cerebellum are usually spared. Frontal lobes may be involved in late stage. Amyloid PET 11C-Pittsburgh compound B, as well as newer compounds such as 18F-florbetapir, 18F- flutemetamol, and 18F- florbetaben, are PET tracers that bind preferentially to beta-amyloid fibrils and thus may be able to improve the specificity of antemortem diagnosis, although there is considerable overlap with normal controls. With increased cerebral amyloid-β (Aβ) deposition, increased activity is demonstrated in the cortex. It is particularly useful in excluding Alzheimer disease as the cause of dementia, as a negative amyloid PET scan renders the diagnosis unlikely. Tau PET Newer PET agents that bind tau proteins are being investigated, which result in increased activity in the expected locations (hippocampus, entorhinal cortex and temporal and parietal cortex).
- 8. Brain With Alzheimer's Disease
- 9. How the Brain and Nerve Cells Change During Alzheimer's Disease Medical illustration showing how the brain and nerve cells change during Alzheimer's
- 10. Substantia Nigra: substantia nigra appear darker than neighboring areas due to high levels of melanin in dopaminergic neurons and Parkinson's disease is characterized by the death of dopaminergic neurons in the substantia nigra. Brain With Parkinson's Disease
- 12. A, Axial T2-weighted FLAIR images at varying intracranial levels (left image, middle left image, middle right image), and coronal T1- weighted volumetric acquisition image (right image) show mild diffuse cerebral and cerebellar atrophy and normal hippocampi for age. B, FDG PET images (B), 3D stereotactic surface projection maps (C), and Z-score maps (D) show mild temporoparietal lobe hypometabolism, right worse than left, and mildly diminished activity in posterior cingulate gyrus (arrows, D); these findings are suggestive of early Alzheimer disease.
- 13. C, FDG PET images (B), 3D stereotactic surface projection maps (C), and Z-score maps (D) show mild temporoparietal lobe hypometabolism, right worse than left, and mildly diminished activity in posterior cingulate gyrus (arrows, D); these findings are suggestive of early Alzheimer disease. D, FDG PET images (B), 3D stereotactic surface projection maps (C), and Z-score maps (D) show mild temporoparietal lobe hypometabolism, right worse than left, and mildly diminished activity in posterior cingulate gyrus (arrows, D); these findings are suggestive of early Alzheimer disease. E, Amyloid PET images reveal abnormal diffuse activity in gray matter (arrows) similar to white matter.
- 14. A, Axial T2-weighted FLAIR images at varying intracranial levels (left image, middle left image, middle right image) and coronal T1-weighted image at hippocampal level (right image) show generalized cerebral volume loss that is most notable in perisylvian regions and commensurate volume loss of both hippocampal formations (arrows). B, FDG PET images show marked right and moderate left temporoparietal hypometabolism. Prominent right frontal lobe hypometabolism is also noted. There is motor and visual cortex sparing.
- 15. C, Three-dimensional stereotactic surface projection maps (C) and Z-score maps (D) show significant temporoparietal lobe hypometabolism, right greater than left (> 6 SD) and bilateral posterior cingulate gyri hypometabolism (arrows, D). D, Three-dimensional stereotactic surface projection maps (C) and Z-score maps (D) show significant temporoparietal lobe hypometabolism, right greater than left (> 6 SD) and bilateral posterior cingulate gyri hypometabolism (arrows, D). E, Amyloid PET images reveal intense activity in gray matter (arrows) similar to activity in white matter indicating positive study.
- 16. Comparison of arterial spin labeling (ASL) and fluorodeoxyglucose (FDG) images. Representative images from control subjects (top row) and AD patients (bottom row) comparing structural magnetic resonance imaging images (T1 and fluid- attenuated inversion recovery), arterial spin labeling magnetic resonance imaging (ASL-MRI), and fluorodeoxyglucose positron emission tomography (FDG-PET). All four patients were diagnosed correctly by both readers using both modalities. White arrows highlight areas of concordant hypometabolism on FDG-PET and hypoperfusion on ASL-MRI.
- 18. Vascular dementia may present with sudden onset of dysfunction or stepwise deterioration in patients with risk factors for stroke, systemic vascular disease, or a history of stroke. Because white matter disease increases with age, there remains uncertainty about the severity of disease needed to diagnose vascular dementia. Some sources suggest that approximately 25% of white matter needs to be affected; however, this imaging pattern alone does not imply clinical findings of dementia. Vascular dementia is most commonly sporadic because of underlying pathologic conditions such as atherosclerosis or cerebral amyloid angiopathy (CAA). More rarely, vascular dementia may be heritable, such as in cerebral autosomal-dominant arteriopathy with subcortical infarcts and leukoencephalopathy (CADASIL). Complicating matters is the fact that the coexistence of vascular dementia and AD is common given the shared risk factors in an aging population Large-vessel disease may result in a typical cerebral vascular distribution of cortical or subcortical infarcts. However, small-vessel disease is more common, resulting in focal or confluent regions of subcortical and periventricular increased signal intensity on T2-weighted FLAIR imaging, sparing of the subcortical U fibers, and small lacunar infarcts.
- 19. A, Axial T2-weighted FLAIR images at varying intracranial levels (left image, middle left image, middle right image), and coronal T1-weighted image at hippocampal level (right image) show moderate periventricular leukoaraiosis and generalized cerebral atrophy, most marked in both temporal lobes and insula. Right parafalcine occipital lobe encephalomalacia (arrows) is also present. B, FDG PET images reveal focal hypometabolism in area of old right posterior cerebral artery (PCA) infarct-encephalomalacia on MRI (arrow).
- 20. C, Three-dimensional stereotactic surface projection maps (C) and Z-score maps (D) not only confirm hypometabolism in right PCA territory but also show multiple discrete foci of hypometabolism throughout cortex in areas of focal gyral atrophy (arrows). This case illustrates potential pitfall of using FDG PET/CT without anatomic imaging correlation. D, Three-dimensional stereotactic surface projection maps (C) and Z-score maps (D) not only confirm hypometabolism in right PCA territory but also show multiple discrete foci of hypometabolism throughout cortex in areas of focal gyral atrophy (arrows). This case illustrates potential pitfall of using FDG PET/CT without anatomic imaging correlation.
- 21. Diffusion-weighted MRI in vascular dementia
- 22. Vascular dementia, no medial temporal lobe atrophy.
- 23. Frontotemporal Dementia: Estimated to contribute to less than 10% of all dementia cases, FTD is the third most common type of dementia and the most common type of dementia in patients younger than 60 years old. Clinical symptoms include behavioral issues, affective symptoms, and language disorders. FTD subtypes include behavioral FTD and language-predominant cognitive decline FTD, the latter of which is referred to as primary progressive aphasia (PPA). PPA is further classified into semantic, agrammatic or nonfluent, and logopenic PPA variants. Compared with AD, FTD usually has an earlier onset and more rapid progression. FTD likely represents several different types of neurodegenerative processes, and the patterns of imaging findings can be strikingly different. Early differentiation of FTD from AD is clinically important because symptoms caused by FTD do not respond to traditional therapies approved for AD. Anatomic imaging—The structural findings in patients with behavioral FTD include symmetric or asymmetric frontal or temporal lobe atrophy with relative sparing of the parietal and occipital lobes. Atrophy can be severe with so-called “knife blade gyri,” but this is a late finding in the behavioral FTD process. The following characteristic patterns of atrophy have been described for the language- predominant cognitive decline FTD (PPA) subtypes: left anterior temporal lobe and hippocampal atrophy in semantic PPA; left perisylvian cortex, inferior frontal gyrus (Broca area), and superior temporal gyrus atrophy in agrammatic or nonfluent PPA; and left posterior perisylvian or parietal atrophy in logopenic PPA.
- 24. Frontotemporal dementia. A, Axial T2-weighted FLAIR images at varying intracranial levels (left image, middle left image, middle right image), and sagittal T1-weighted (right image) show moderate diffuse parenchymal volume loss for age and superimposed focal atrophy of the frontal and anterior temporal lobes (arrow). B, FDG PET images show moderate to markedly decreased activity in both Frontotemporal lobes and mildly decreased parietal lobe metabolism. Mildly decreased basal ganglia activity. There is motor cortex preservation.
- 25. C, Three-dimensional stereotactic surface projection maps (C) and Z-score maps (D) depict large areas of bilateral frontotemporal hypometabolism (3–4 SD) (arrows, D). D, Three-dimensional stereotactic surface projection maps (C) and Z-score maps (D) depict large areas of bilateral frontotemporal hypometabolism (3–4 SD) (arrows, D).
- 26. FTLD: T2WI and FLAIR with 'knife blade' atrophy of left temporal lobe with normal right temporal lobe.
- 27. Brain MRI in frontotemporal dementia patients.
- 28. Dementia With Lewy Bodies: DLB is increasingly recognized as a cause of dementia in patients older than 60 years old and now possibly represents 1 in every 25 dementia cases in the community and 1 in every 12 cases in secondary care centers. Symptoms include dementia with visual hallucinations, parkinsonism, and REM sleep behavior disorder. In this entity, dementia symptoms occur before parkinsonism in contrast to Parkinson disease with dementia in which dementia occurs in the setting of well-established parkinsonism. Approximately 70–90% of patients with DLB show Parkinsonian symptoms at the time of cognitive symptoms. Early differentiation of DLB from AD is critical because DLB symptoms may respond to neuroleptic therapy, thus improving the quality of life of patients with DLB. Anatomic imaging—The imaging findings of DLB are nonspecific, with varying patterns of cortical and white matter volume loss and relative preservation of the hippocampi. Despite visual symptoms reported in patients with DLB, occipital lobe atrophy is not typically observed.
- 29. Dementia with Lewy bodies (DLB). A, Axial T2-weighted FLAIR images at varying intracranial levels (left image, middle left image, middle right image) and coronal T1-weighted image at hippocampal level (right image) show mild diffuse cerebral atrophy including the hippocampi. B, FDG PET images show parietal, occipital, posterior temporal, and frontal lobe hypometabolism with motor strip preservation.
- 30. C, Three-dimensional stereotactic surface projection maps (C) and Z-score maps (D) show significant parietooccipital hypometabolism including visual cortex (3–4 SD) (arrows, D). D, Three-dimensional stereotactic surface projection maps (C) and Z-score maps (D) show significant parietooccipital hypometabolism including visual cortex (3–4 SD) (arrows, D). E, Amyloid PET images reveal abnormal diffuse activity in gray matter similar to white matter indicating positive study (arrows).
- 31. Lewi body dementia: normal hippocampus.
- 33. Corticobasal degeneration (CBD) is characterized by cognitive decline or behavioral disturbance that precedes the development of a movement disorder, typically asymmetric parkinsonism or alien limb phenomenon. Specific cognitive features include executive dysfunction, aphasia, apraxia, and visuospatial disturbances. Similar to the parkinsonism of many other atypical degenerative dementias, parkinsonism in CBD can be differentiated from idiopathic Parkinson disease in that it is typically asymmetric and lacks a robust response to levodopa therapy. Current research suggests that CBD may be further divided into FTD and AD subtypes on the basis of the underlying histology at autopsy. Although not robust, dopaminergic drugs may be helpful for symptom treatment. Targeted therapy with botulinum toxin for symptomatic limb dystonia can also improve quality of life. A relatively aggressive course is typically seen, with a mean survival of 8 years from symptom onset. Anatomic imaging—In the early stages of CBD, the MRI findings may be subtle. With disease progression, asymmetric cortical atrophy involving the frontoparietal lobes and corpus callosum may be present. There may also be atrophy of the ipsilateral cerebellar peduncle. On T2-weighted sequences, marked hypointensity can be seen in the putamen and globus pallidum. Volume loss does not occur in the basal ganglia and hippocampi, which can be helpful in differentiation from AD
- 34. 1A —Corticobasal degeneration in 67-year-old man who presented with cognitive decline, expressive aphasia, right upper extremity rigidity, and focal myoclonus. A, Axial (left image and middle left image), sagittal (middle right image), and coronal (right image) T2-weighted FLAIR MR images show asymmetric cortical atrophy in left temporal and parietal lobes (arrows). B, Axial (left image and middle left image), sagittal (middle right image), and coronal (right image) FDG PET images reveal marked left temporoparietal hypometabolism with subtle decreased activity in left basal ganglia (arrows).
- 35. C, Three-dimensional stereotactic surface projection (SSP) maps (C) and Z-score maps (D) confirm severe left-sided cortical hypometabolism (> 5 SD; arrows). Three-dimensional SSP images are semi quantitative sampling of metabolism from various cortical locations. Z- score images compare cortical metabolism with age-matched normative database; color change is based on reduction in metabolism relative to number of SDs from mean. D, Three-dimensional stereotactic surface projection (SSP) maps (C) and Z-score maps (D) confirm severe left-sided cortical hypometabolism (> 5 SD; arrows). Three-dimensional SSP images are semiquantitative sampling of metabolism from various cortical locations. Z-score images compare cortical metabolism with age-matched normative database; color change is based on reduction in metabolism relative to number of SDs from mean.
- 36. Multiple-system atrophy (MSA) is a neurodegenerative movement disorder characterized by prominent parkinsonism. Cognitive decline and cerebellar ataxia with early falls are characteristic of this disorder. When dysautonomia predominates, this condition may be termed “Shy-Drager syndrome.” This disease process is further subclassified on the basis of the type of movement disorder: MSA with predominantly parkinsonism symptoms is referred to as “MSA-P,” and MSA with predominantly cerebellar ataxia symptoms is referred to as “MSA-C” . Dopamine replacement therapy is not beneficial in patients with MSA, unlike patients with CBD, and can potentially aggravate the dysautonomia. As with the other atypical degenerative dementias, the clinical course of MSA is aggressive, and death typically occurs within 10 years of diagnosis. In patients with prominent dysautonomia, the prognosis can be even worse. Multiple distinct patterns may be seen on conventional MRI of patients with MSA. In MSA-P, putaminal abnormalities predominate with atrophy and symmetric hypointensity on T2-weighted and gradient- weighted images.
- 37. 2A —Multiple-system atrophy (MSA-C) in 56-year-old man who presented with mild parkinsonism, cerebellar ataxia, and autonomic dysfunction. A, Axial T2-weighted FLAIR images (images from left to right: skull base to vertex) show marked focal atrophy of midbrain and both middle cerebral peduncles, exvacuo dilatation of fourth ventricle, and “hot cross bun” sign with cruciform T2 hyperintensity in pons (arrows). B, Axial FDG PET images (images from left to right [B]: skull base to vertex), 3D stereotactic surface projection maps (C), and Z-score projection maps (D) show dominant cerebellar and mild pontine hypometabolism (arrows) typical of subtype of MSA with predominantly cerebellar ataxia symptoms.
- 38. C, Axial FDG PET images (images from left to right [B]: skull base to vertex), 3D stereotactic surface projection maps (C), and Z-score projection maps (D) show dominant cerebellar and mild pontine hypometabolism (arrows) typical of subtype of MSA with predominantly cerebellar ataxia symptoms. D, Axial FDG PET images (images from left to right [B]: skull base to vertex), 3D stereotactic surface projection maps (C), and Z-score projection maps (D) show dominant cerebellar and mild pontine hypometabolism (arrows) typical of subtype of MSA with predominantly cerebellar ataxia symptoms.
- 39. 'Hot cross bun sign' in MSA
- 40. Progressive Supranuclear Palsy: PSP is clinically characterized by parkinsonism, postural instability, and vertical gaze palsy. PSP is the second most common cause of parkinsonism after idiopathic Parkinson disease. PSP is characterized by early falls within the first year of disease onset, and there is typically symmetric involvement at presentation with central (i.e., trunk and neck) involvement greater than limb involvement. Although supranuclear ophthalmoplegia is the most striking cranial nerve finding, other cranial nerves can also be involved, producing pseudobulbar palsy and cervical dystonia. Concomitant cognitive impairment is typically characterized by personality change, memory impairment, and depression or apathy. Disease progression is usually aggressive, with death occurring within 6–10 years of diagnosis. Misdiagnosis as idiopathic Parkinson disease is not rare, and this misdiagnosis may lead to unnecessary trials of dopamine replacement therapy, to which PSP is typically unresponsive. Conventional MRI. These abnormalities include the following: first, atrophy of the mid-brain tegmentum with relative preservation of the pons, which is termed the “hummingbird” sign, on midline sagittal images; second, atrophy of the midbrain, preservation of the tectum, and widening of the interpeduncular cistern, which is termed the “Mickey Mouse” sign, on axial images; and putaminal T2 hypointensity, which is likely caused by iron deposition
- 41. Progressive supranuclear palsy: A, Axial T2-weighted FLAIR images (first three images from left to right: skull base to vertex) and sagittal T1-weighted image (right image) show generalized cerebral atrophy is more prominent in frontotemporal lobes including hippocampi and perisylvian regions. Selective atrophy of midbrain tegmentum with relative preservation of pons (arrow), which is termed “hummingbird” sign, is seen on sagittal image. B, Axial FDG PET images (first three images from left to right, B), sagittal FDG PET image (right image, B), and sagittal 3D stereotactic surface projection maps (C) show subtle posterior frontal cortex hypometabolism.
- 42. C, Axial FDG PET images (first three images from left to right, B), sagittal FDG PET image (right image, B), and sagittal 3D stereotactic surface projection maps (C) show subtle posterior frontal cortex hypometabolism. D, Posterior frontal cortex hypometabolism (arrows) is better delineated on sagittal Z-score maps.
- 43. Progressive supranuclear palsy (PSP): PSP is also one of the atypical parkinsonian syndromes. In PSP there is pronounced atrophy of the midbrain (mesencephalon), which accounts for the typical upward gaze paralysis. PSP with midbrain atrophy. PSP: 'humming bird sign' due to midbrain atrophy
- 44. Pseudodementia has been described as a reversible dementia syndrome secondary to a primary psychiatric disorder, classically major depressive disorder. This diagnosis should be considered in the differential diagnosis of any patient with a long-standing psychiatric history. Clinically, the only major differentiating factor is the complete reversibility of the symptoms after treatment. In the population with treatment-resistant major depressive disorder, cognitive symptom improvement may be achieved only after electroconvulsive therapy (ECT). Significant morbidity and mortality can be associated with this condition, which stresses the importance of early and accurate diagnosis. Anatomic imaging—No structural or morphologic abnormalities are seen on conventional MRI in pseudodementia. However, this lack of structural abnormalities may be indistinguishable from other early-stage dementia processes. Metabolic imaging—A broad spectrum of presentations may be seen on FDG PET/CT; most commonly, FDG PET/CT of these patients will show normal metabolism. However, diffuse hypometabolism has also been described, and there have been several cases reported of severe depressive pseudodementia with diffuse cerebral hypometabolism showing varying degrees of metabolic change after ECT
- 45. Pseudodementia in 57-year-old woman who presented with progressive cognitive decline and history of depression. A, Axial FLAIR MR images (images from left to right [A]: base to vertex), axial FDG PET images (B), 3D stereotactic surface projection maps (C), and sagittal Z-score maps (D) show normal findings. Both MRI and PET studies show normal findings. Nonspecific pattern of diffuse cortical hypometabolism can be seen with pseudodementia. B, Axial FLAIR MR images (images from left to right [A]: base to vertex), axial FDG PET images (B), 3D stereotactic surface projection maps (C), and sagittal Z-score maps (D) show normal findings. Both MRI and PET studies show normal findings. Nonspecific pattern of diffuse cortical hypometabolism can be seen with pseudodementia.
- 46. C, Axial FLAIR MR images (images from left to right [A]: base to vertex), axial FDG PET images (B), 3D stereotactic surface projection maps (C), and sagittal Z-score maps (D) show normal findings. Both MRI and PET studies show normal findings. Nonspecific pattern of diffuse cortical hypometabolism can be seen with pseudodementia. D, Axial FLAIR MR images (images from left to right [A]: base to vertex), axial FDG PET images (B), 3D stereotactic surface projection maps (C), and sagittal Z-score maps (D) show normal findings. Both MRI and PET studies show normal findings. Nonspecific pattern of diffuse cortical hypometabolism can be seen with pseudodementia.
- 47. Paraneoplastic neurological syndromes (PNS) are a rare group of disorders that result from neuronal dysfunction in the setting of malignancy that is likely because of immune-mediated direct damage rather than because of metastasis, infection, metabolic deficits, or treatment. This phenomenon is most frequently encountered in breast, lung, and ovarian cancer and is estimated to occur in less than 0.01% of patients with cancer. Most often, the symptoms of PNS develop before the detection of the primary malignancy. There are multiple syndromes included in the PNS that may present clinically with cognitive symptoms; two of the more common entities include paraneoplastic limbic encephalitis and subacute cerebellar degeneration. Patients with paraneoplastic limbic encephalitis, the most common clinical paraneoplastic syndrome, present with cognitive decline, confusion, and possibly seizures. Patients with sub- acute cerebellar degeneration typically present with profound axial and appendicular ataxia, dysarthria, and nystagmus. Accurate diagnosis can help to initiate treatment with immune- modulating therapies and elicit a search for occult malignancy in these patients. Anatomic imaging—Conventional MRI findings may range from grossly normal to abnormal in PNS. Paraneoplastic limbic encephalitis can mimic herpes encephalitis on imaging with relatively symmetric T2 hyperintensity in the medial temporal lobes. The cingulate gyrus, insula, inferior frontal cortex, and white matter may be involved as well. Minimal mass effect and patchy contrast enhancement can be present, which may confuse the imaging appearance. In acute cases in which herpes cannot be excluded, treatment with antiviral agents is advised until herpes encephalitis can be excluded by spinal fluid examination. In paraneoplastic cerebellar degeneration, focal atrophy of the cerebellum is noted. This disorder can be difficult to accurately diagnose in patients with more widespread cerebral atrophy, but there is progressive volume loss on serial examinations. The cerebellar atrophy is often more obvious on sagittal images than on axial images.
- 48. Paraneoplastic limbic encephalitis in 35-year-old woman who presented with subacute memory deficits and psychiatric symptoms including paranoia and hallucinations. A, Axial T2-weighted (first three images from left to right: base to vertex) and coronal T2-weighted FLAIR (right image) MRI shows signal abnormalities in both mesial temporal lobes (arrows). B, Axial FDG PET images (first three images from left to right [B]: base to vertex), coronal FDG PET image (right image, B), and 3D stereotactic surface projection maps (C) show mild diffuse cortical hypometabolism and intense hypermetabolism in medial temporal lobes (arrows).
- 49. C, Axial FDG PET images (first three images from left to right [B]: base to vertex), coronal FDG PET image (right image, B), and 3D stereotactic surface projection maps (C) show mild diffuse cortical hypometabolism and intense hypermetabolism in medial temporal lobes (arrows). D, There is no use for Z-score maps in this patient because they show areas of cortical hypometabolism in patients with neurodegenerative disorders.
- 50. Creutzfeldt-Jakob disease (CJD) is a rare fatal prion neurodegenerative disease characterized by rapidly progressive dementia with myoclonus. Although there are classic pathologic findings on brain biopsy, noninvasive diagnosis by a combination of electroencephalography (EEG) and imaging findings is optimal to reduce the potential for additional potential prion exposures. In addition to characteristic EEG periodic complexes, highly specific features can be seen on imaging that allow accurate diagnosis of CJD. Anatomic imaging—The most common imaging finding is rapidly progressive atrophy that typically involves the frontal, temporal, and parietal lobes. Rarer subtypes can preferentially involve the occipital (Heidenhain variant) and cerebellar (Oppenheimer-Brownell variant) hemispheres. Aside from the progressive atrophy, more specific MRI features can be present and include, first, T2 signal and diffusion restriction in the pulvinar of the thalami; and, second, symmetric increased signal intensity in the pulvinar and dorsomedial thalamus that gives a “hockey stick” configuration. Other findings frequently encountered include patchy gyriform T2 hyperintensity in the cerebral cortex and increased T1 signal in the globus pallidum
- 51. Creutzfeldt-Jakob disease in 53-year-old man who presented with rapidly progressive dementia and myoclonus B, Axial MR images obtained 3 months after A show progressive atrophy with increased T2 signal in caudate (arrows, B); asymmetric gyriform pattern of restricted diffusion in cerebral cortex (arrows, C); involvement of caudate, putamen, and pulvinar with increased FLAIR signal (arrows, D); and increased T1 signal in globus pallidum (arrow, E). Constellation of MRI findings, short- interval progression, and clinical scenario obviated brain biopsy in this case.
- 52. Huntington disease (HD) is an uncommon autosomal-dominant neurodegenerative disease with both juvenile and adult-onset forms that is characterized by cytosine-adenosineguanine trinucleotide repeats in the short arm of chromosome 4. The classic adult-onset form, accounting for approximately 90– 95% of HD cases, typically presents in patients 40–50 years old with rapidly progressive mental deterioration and choreoathetoid movements. The less common juvenile form typically presents in patients younger than 20 years old, and affected patients can have prominent rigidity. Although HD is autosomal- dominant, approximately 10–15% of cases are sporadic, which can potentially lead to a delayed diagnosis. Anatomic imaging—The main feature of HD is caudate atrophy with overall decreased size, loss of the convex medial margin of the caudate heads, and an increased intercaudate distance. Putaminal and globus pallidus volume loss with compensatory enlargement of the anterior horns of the lateral ventricles may also be seen. The basal ganglia atrophy can be subtle, especially in minimally symptomatic patients or in presymptomatic patients. Therefore, volumetric quantitation may be useful. Nonspecific T2 hypointensity in the striatum can result from iron deposition. In the juvenile form, T2 hyperintensity in the caudate and putamen may occur due to gliosis
- 53. A, Prominent bilateral caudate atrophy (arrows) is visible on axial T2-weighted image (A) and coronal T1-weighted image (B) of 43-year-old man with HD who presented with choreoathetoid movements. Axial 11C-raclopride PET images of 34-year-old control patient (E) and 32-year-old presymptomatic HD gene carrier (F). Decreased uptake is seen in basal ganglia of gene carrier (arrows, F).
- 56. Koedam scale grade 0-1 Koedam scale grade 2-3
- 57. Creutzfeldt-Jakob disease (CJD): CJD is a very rare and incurable neurodegenerative disease, caused by a unique type of infectious agent called a prion. The first symptom of CJD is rapidly progressive dementia, leading to memory loss, personality changes and hallucinations. The disease is characterized by spongiform changes in the cortical and subcortical gray matter, with loss of neurons and replacement by gliosis. The abnormalities can sometimes be detected on FLAIR, but are most conspicuous on DWI sequences, affecting either the striatum, the neo-cortex, or a combination of both. Changes in the neocortex as seen on FLAIR (left) and DWI (right).
- 58. Pulvinar hyperintensity in new variant of CJD.
- 59. Typical MRI features of Creutzfeldt-Jakob disease (CJD). (A and B) Sporadic CJD showing typical basal ganglia signal return on fluid- attenuated inversion recovery (FLAIR) (A), which is more obvious on diffusion-weighted sequences (B). (C) Diffusion- weighted imaging sequence showing striking cortical ribboning with normal basal ganglia in sporadic CJD. (D) Variant CJD showing pulvinar sign on the FLAIR sequence.
- 60. Corticobasal Degeneration (CBD): CBD is a rare entity which may present with cognitive dysfunction, usually in combination with Parkinson-like symptoms. The so-called 'Alien- hand' syndrome is a typical manifestation. MRI shows asymmetric parietal cortical atrophy, sometimes with associated hyperintensity of the white matter on T2W images. Axial FLAIR image shows striking asymmetric cortical parietal atrophy in a patient with CBD. Corticobasal degeneration.
- 61. Cerebral Autosomal Dominant Arteriopathy with Subcortical Infarcts and Leukoencephalopathy (CADASIL): CADASIL is another hereditary disease which may present with a progressive cognitive dysfunction. Other presenting symptoms include migraines, stroke-like episodes and behavioral disturbances. It affects the small vessels of the brain. Confluent white matter hyperintensities in the frontal and especially anterior temporal lobes in combination with (lacunar) infarcts and microbleeds are seen on imaging. The FLAIR images show classic findings in CADASIL - confluent white matter hyperintensities with lacunar infarcts and involvement of the anterior temporal lobes.
- 63. Traumatic Brain Injury (TBI): Long term sequelae of traumatic brain injury such as cerebral contusions and diffuse axonal injury (DAI) may include cognitive impairment. Frontobasal/temporal parenchymal loss or T2* black dots typical for DAI in a patient with a history of trauma must therefore be taken into consideration when assessing MR images for dementia. The FLAIR images show classic post-traumatic tissue loss with gliosis in both frontal lobes, the left occipital lobe and right temporal lobe. Traumatic brain injury.
- 64. Cerebral Amyloid Angiopathy (CAA) Dementia may be the clinical presentation in CAA, a condition in which ?-amyloid is deposited in the vessel walls of the brain. The result is hemorrhage, usually microhemorrhages, but also subarachnoid hemorrhage or lobar hematomas may occur. On MR, the T2* sequence will show multiple microhemorrhages, typically in a peripheral location (as opposed to hypertensive microhemorrhages, which are usually more centrally located, e.g. in the basal ganglia and thalami). In addition, FLAIR will reveal moderate to sever white matter hyperintensities (Fazekas grade 2 or 3) T2* images in a patient with CAA show multiple peripherally located microbleeds.
- 69. Fatal familial insomnia is an extremely rare autosomal dominant inherited prion disease 1. Unlike other prion diseases, it does not exhibit spongiform changes. The main pathological findings are gliosis in the inferior olivary nuclei and thalami. Cranial imaging of a FFI patient. In the MRI, there are abnormal signals in the bilateral frontoparietal subcortical area. MRA showed smaller distal branches of cerebral arteries.
- 71. Pick disease is a neurodegenerative disease, and one of the tauopathies characterised by the accumulation of Pick bodies. Pick disease.
- 73. Picks disease: Single-photon emission computed tomography using N-isopropyl-p-[sup 123 I]- iodoamphetamine on June 22, 1990. Uptake decrease extends in the left perisylvian, paracentral, and upper parietal regions. Negligible defect is observed in the right parietal region.
- 75. Thank You.