Downloaded 447 times


![Positron Emission Tomography in Epilepsy
• PET has been the first functional neuroimaging technique applied to presurgical
evaluation of pharmacoresistant focal epilepsies, in the late seventies, before MRI was
available.
• It used the [18F]-Fluorodeoxyglucose (FDG) to obtain images of interictal brain
glucose metabolism.
• It was particularly useful in patients with a normal brain CT scan, showing a focal
interictal glucose hypometabolism.
• FDG PET remains today a routinely used examination in the presurgical assessment
of drug refractory focal epilepsies.
• Focal interictal hypometabolism on FDG PET is usually associated with seizure foci,
but hypometabolism is typically larger than the epileptogenic cortex, reflecting the
altered neuronal function in the ictal focus and possibly extending to the areas of first
ictal spread](https://image.slidesharecdn.com/epilepsiadeneurologica-160506151946/75/Current-trends-in-imaging-of-Epilepsy-55-2048.jpg)


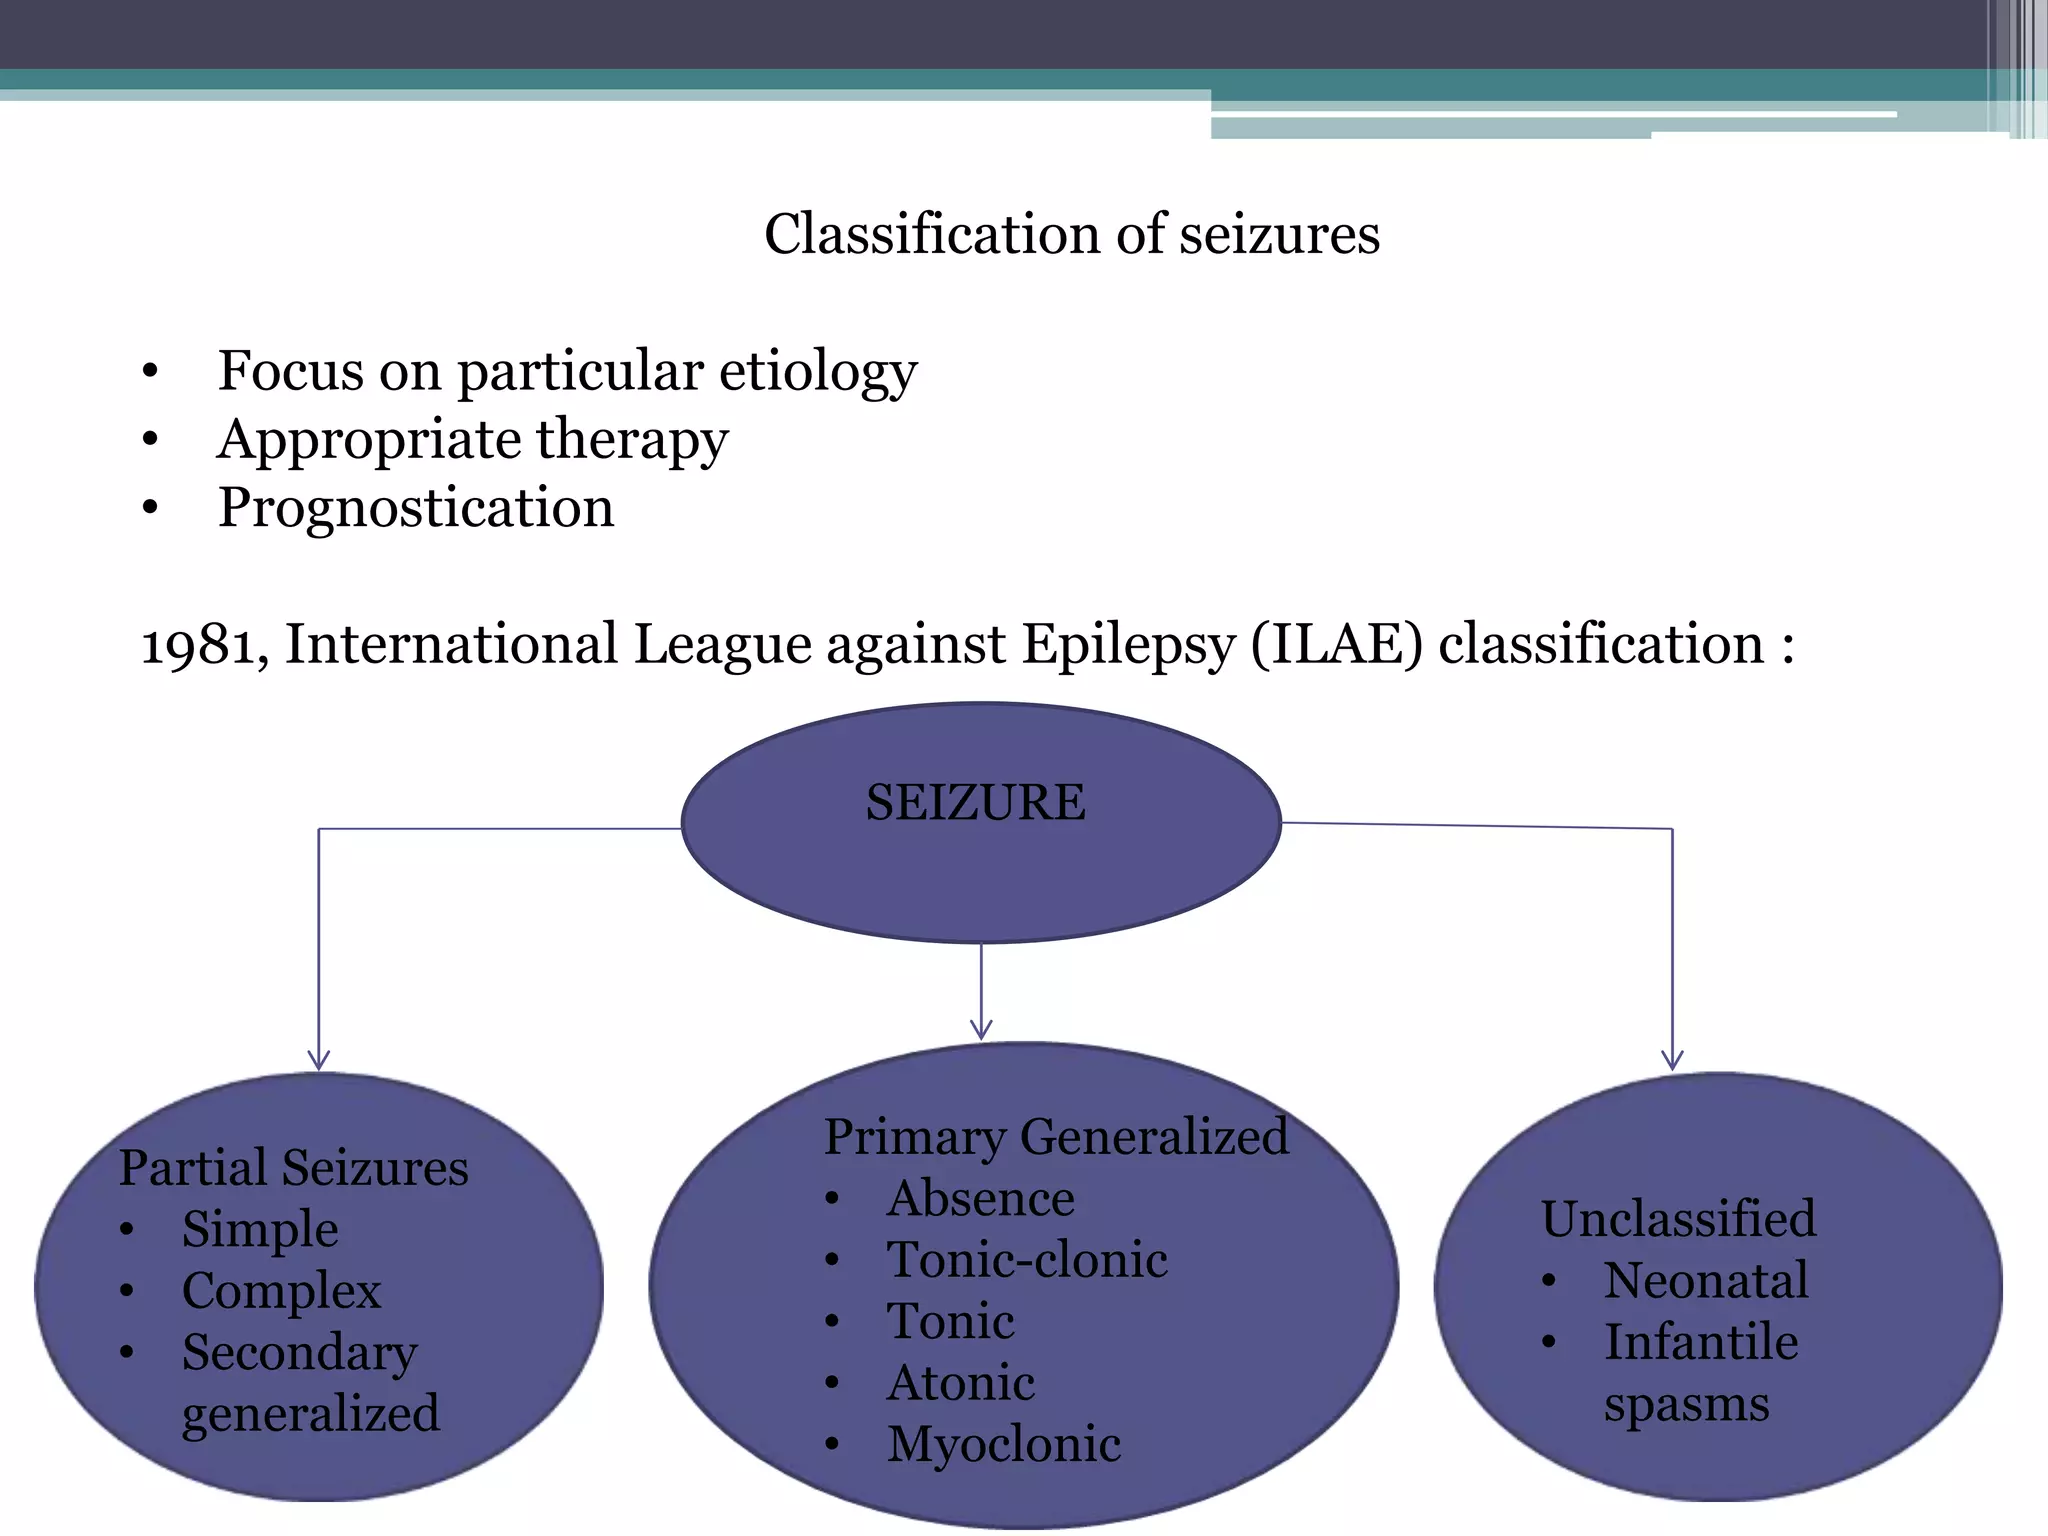
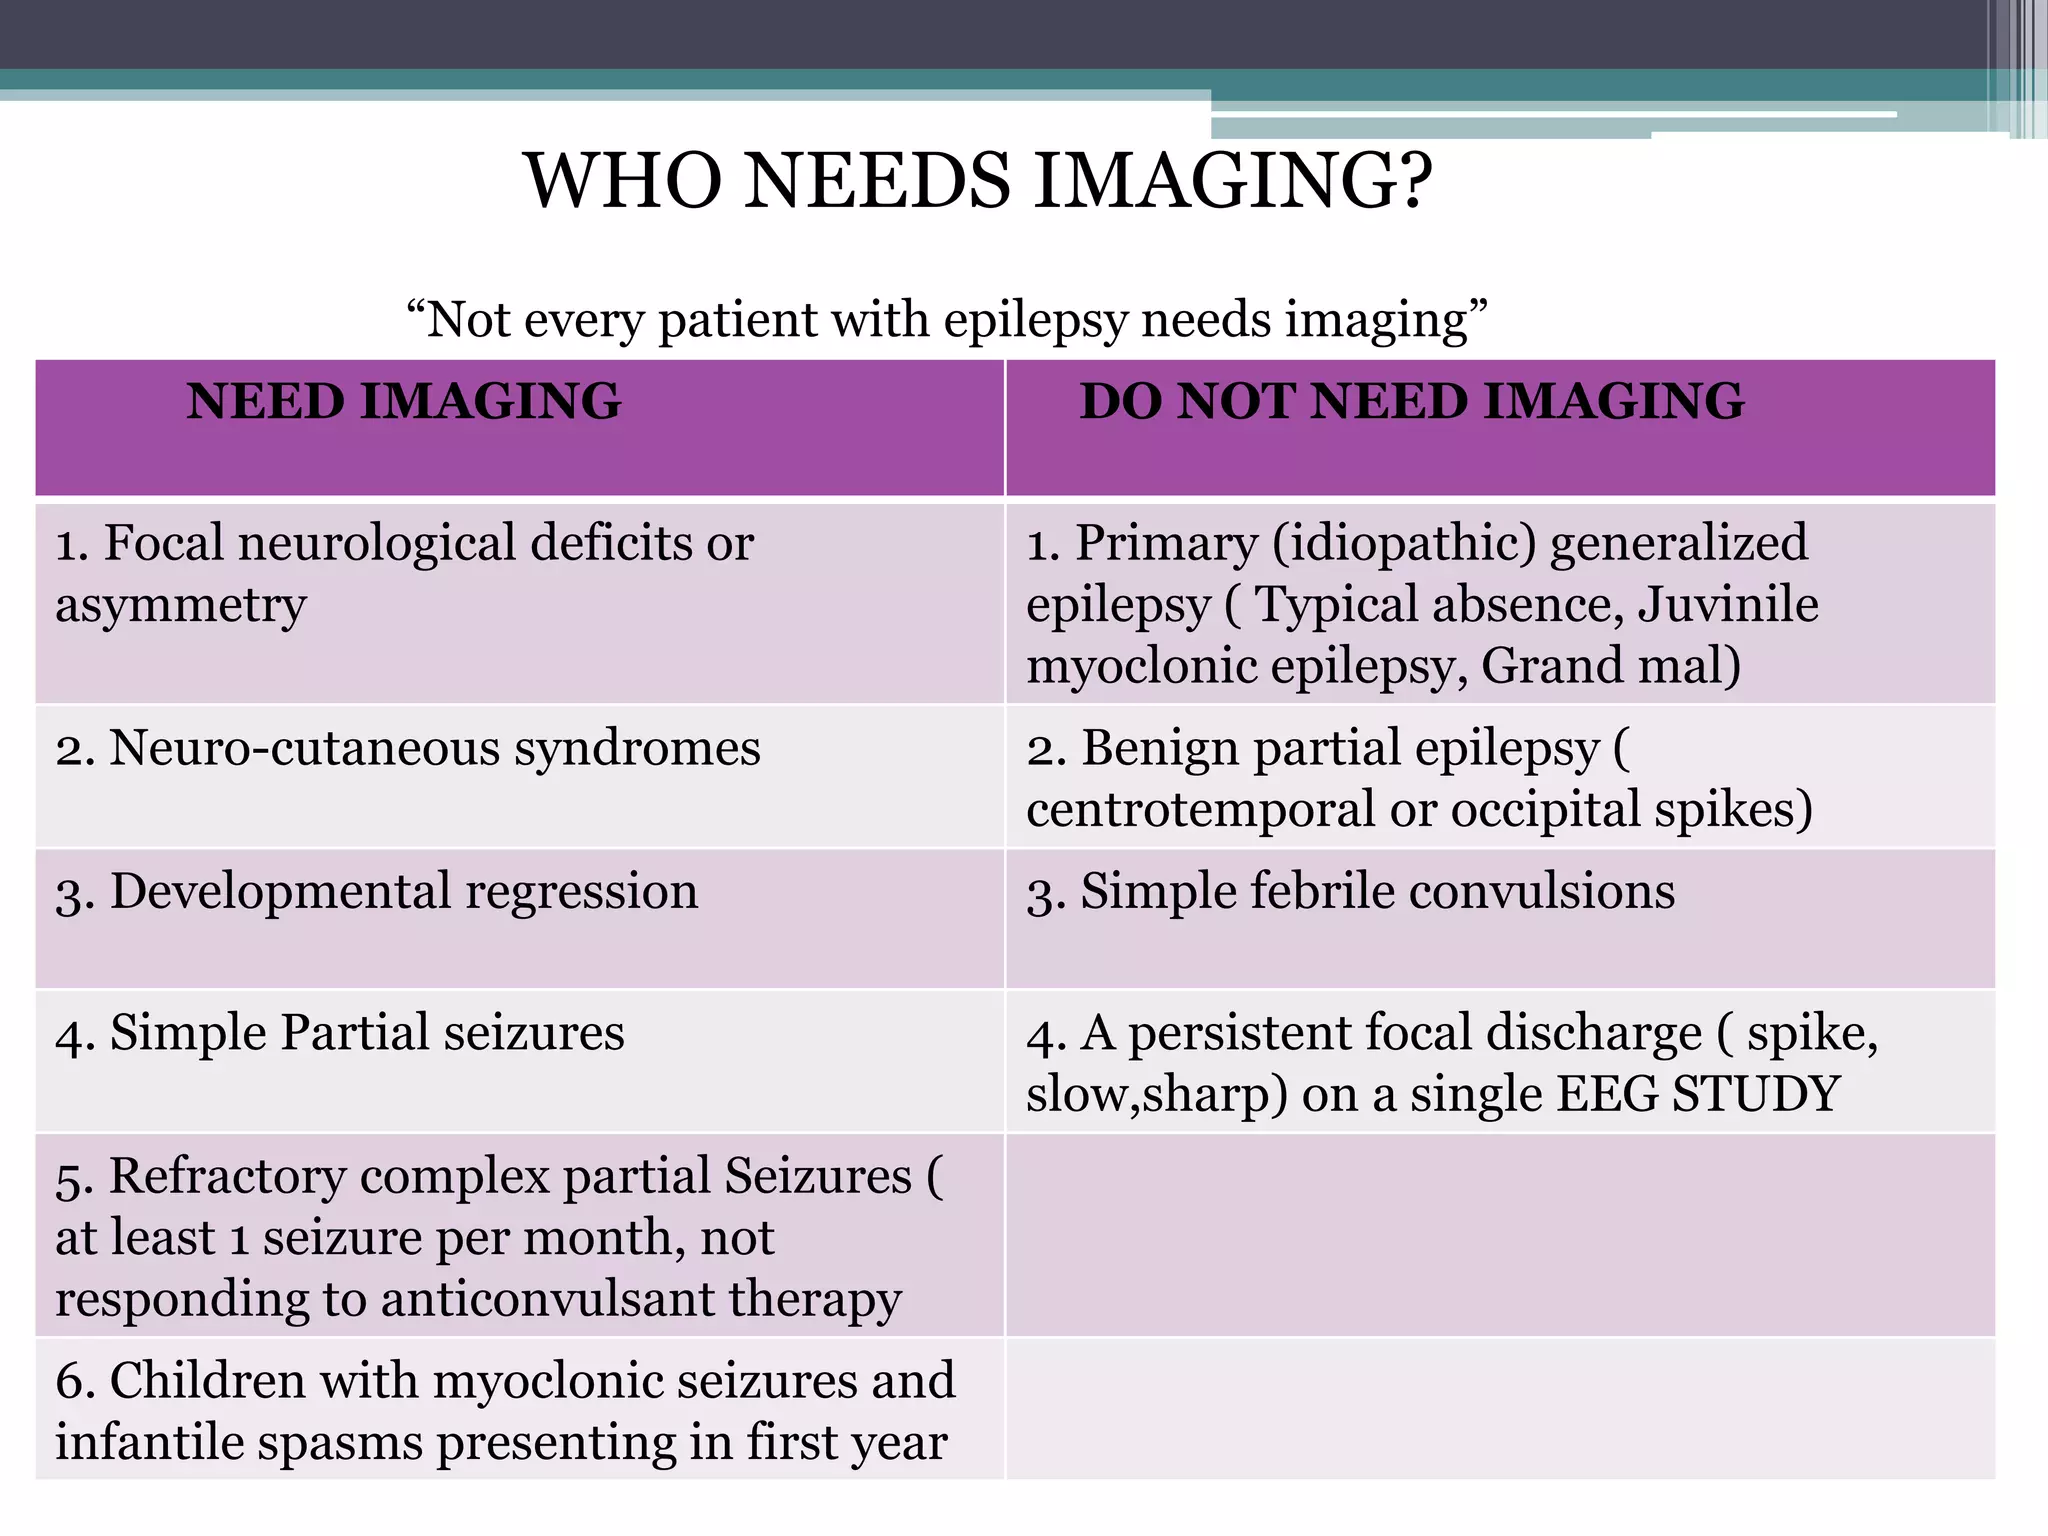
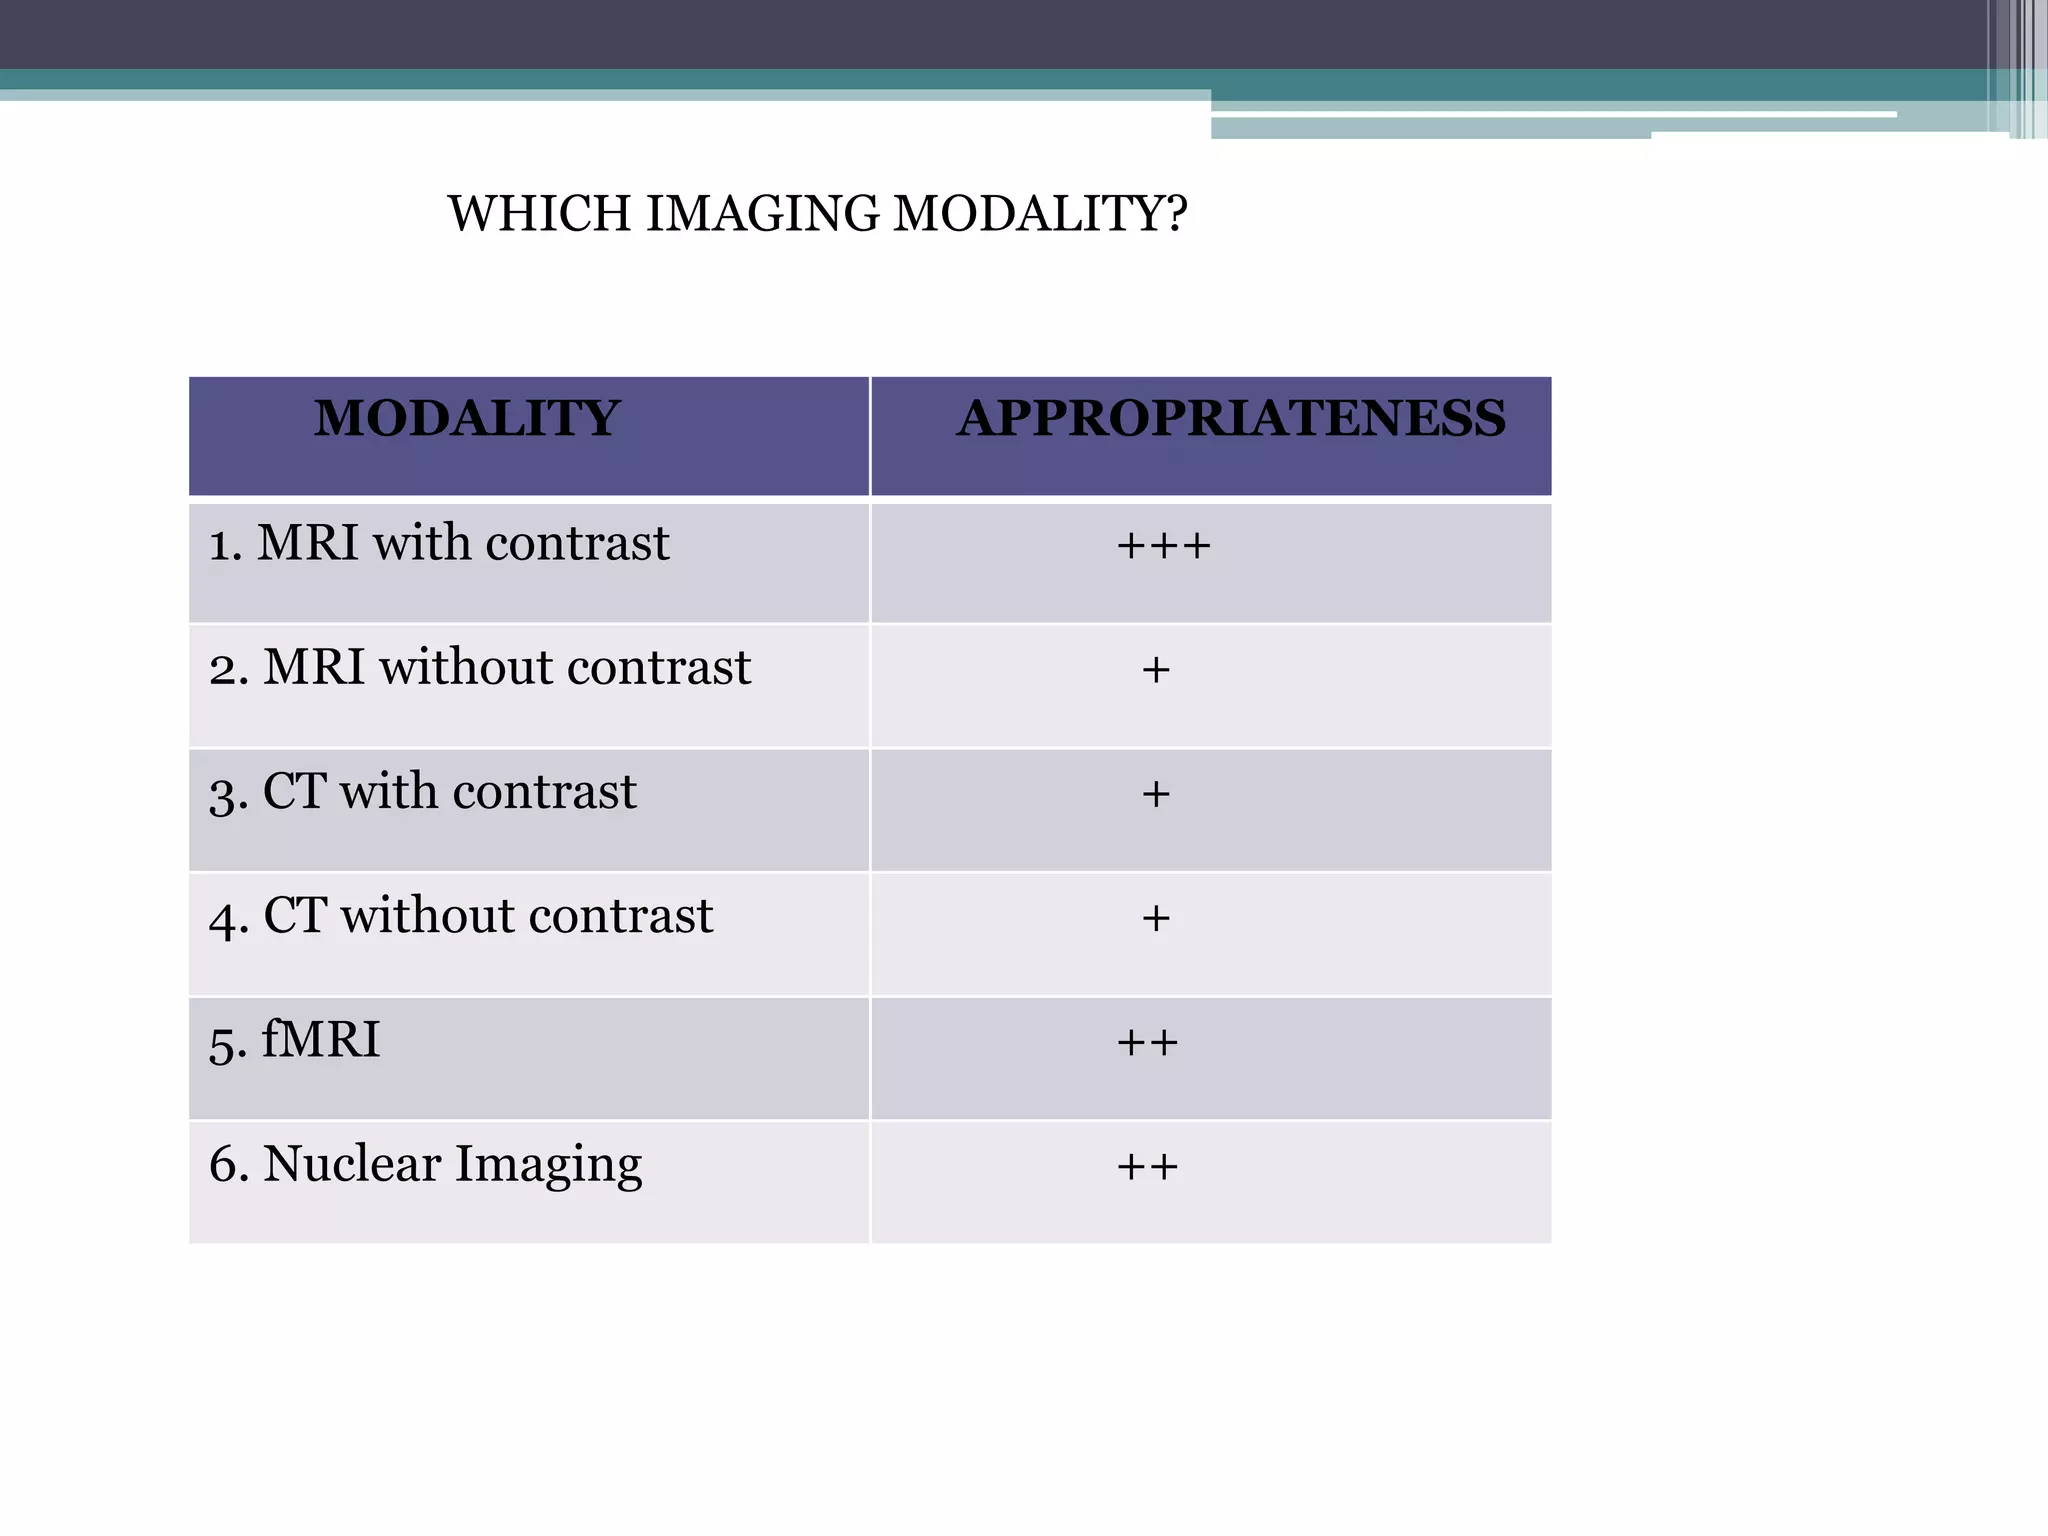
This document provides definitions and classifications of seizures and epilepsy. It discusses who needs neuroimaging for epilepsy and recommends MRI as the best imaging modality. It reviews common MRI protocols and discusses key imaging findings and features of various epilepsy etiologies. Recent advances in neuroimaging for epilepsy are also summarized, including quantitative MRI techniques like volumetry, voxel-based morphometry, and texture analysis as well as advanced techniques like diffusion tensor imaging, tractography, magnetic resonance spectroscopy, and functional MRI.


![Apporach to lung biopsy [Auto-saved].pptx latest](https://cdn.slidesharecdn.com/ss_thumbnails/apporachtolungbiopsyauto-saved-251211225655-93258539-thumbnail.jpg?width=640&height=640&fit=bounds)


