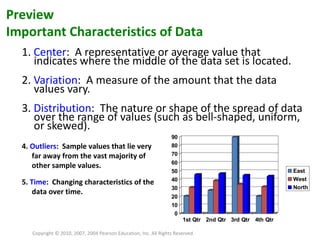
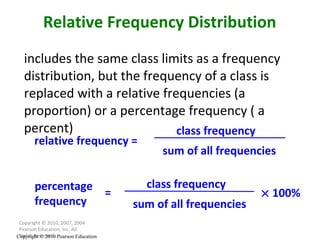
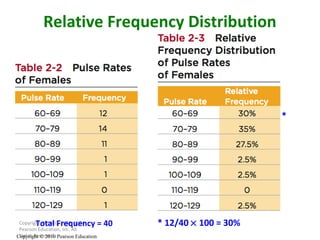
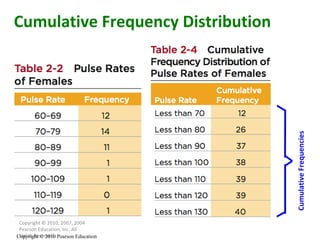
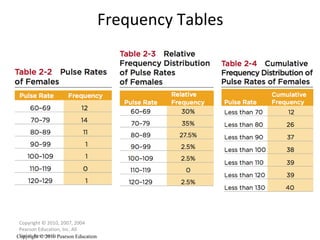
This document discusses summarizing and graphing data. It covers frequency distributions, histograms, and other statistical graphics. Frequency distributions organize large data sets into categories with frequencies. Histograms are a graphical representation of a frequency distribution, using bars to show frequencies for categories along the horizontal axis. Other topics include relative frequency distributions, cumulative frequencies, and interpreting these graphs to understand properties of the underlying data such as its shape and outliers.