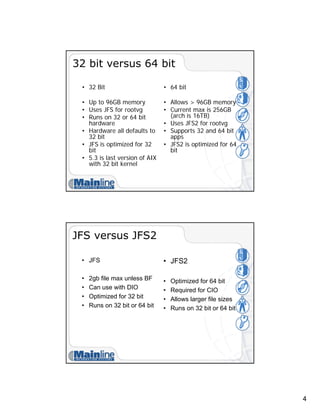
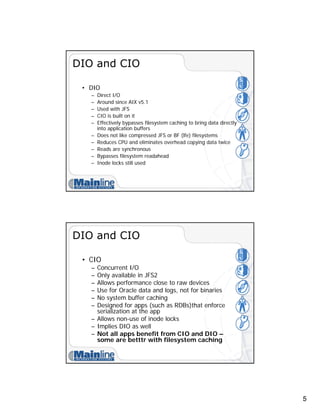
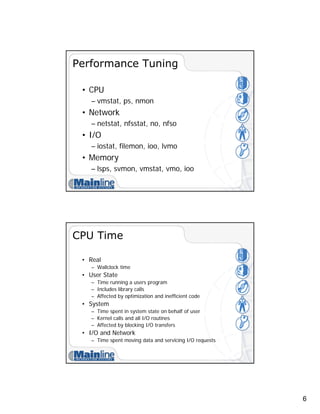
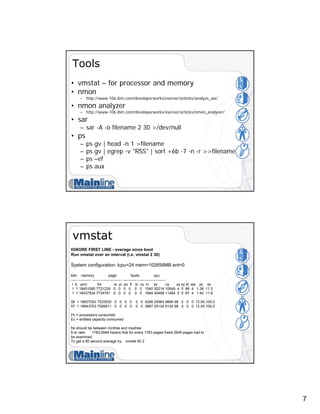
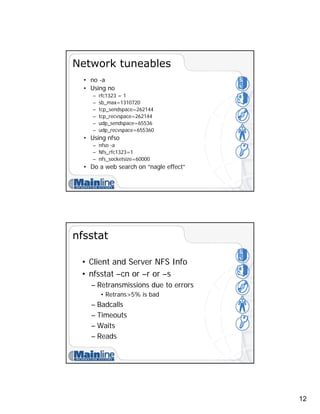
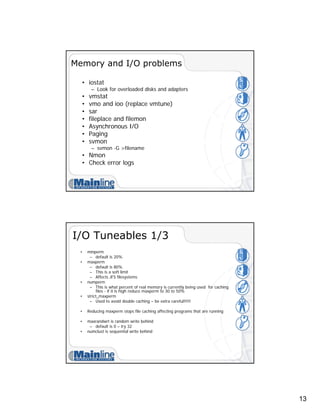
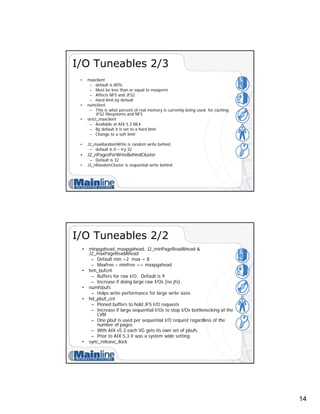
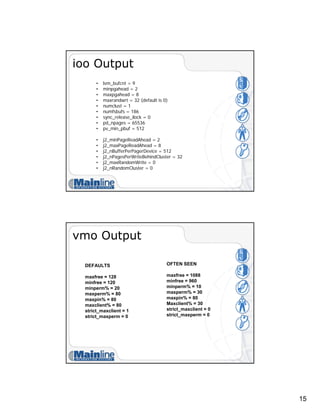
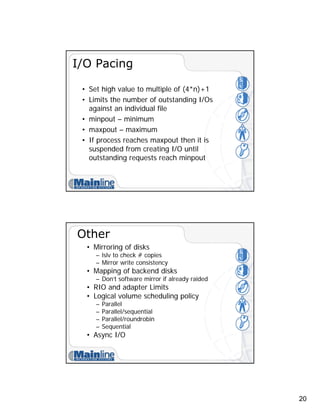
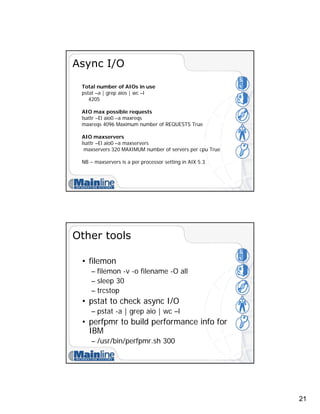
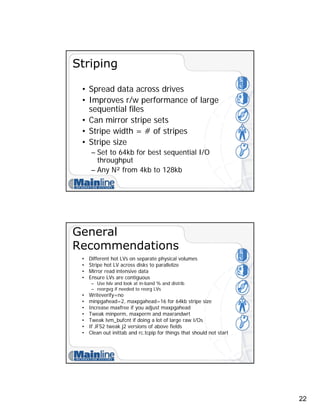
1
AIX Performance Tuning
Jaqui Lynch
Senior Systems Engineer
Mainline Information Systems
Userblue Session 6601
http://www.circle4.com/papers/s6601jla.pdf
Agenda
• AIX v5.2 versus AIX v5.3
• 32 bit versus 64 bit
• JFS versus JFS2
• DIO and CIO
• AIX Performance Tips
2
New in AIX 5.2
• P5 support
• JFS2
• Large Page support (16mb)
• Dynamic LPAR
• Small Memory Mode
– Better granularity in assignment of memory to LPARs
• CuOD
• xProfiler
• New Performance commands
– vmo, ioo, schedo replace schedtune and vmtune
• AIX 5.1 Status
– Will not run on p5 hardware
– Withdrawn from marketing end April 2005
– Support withdrawn April 2006
AIX 5.3
• New in 5.3
– With Power5 hardware
• SMT
• Virtual Ethernet
• With APV
– Shared Ethernet
– Virtual SCSI Adapter
– Micropartitioning
– PLM
3
AIX 5.3
• New in 5.3
– JFS2 Updates
• Improved journaling
• Extent based allocation
• 1tb filesystems and files with potential of 4PB
• Accounting
• Filesystem shrink
• Striped Columns
– Can extend striped LV if a disk fills up
• 1024 disk scalable volume group
– 1024 PVs, 4096 LVs, 2M pps/vg
• Quotas
• Each VG now has its own tunable pbuf pool
– Use lvmo command
AIX 5.3
• New in 5.3
– NFSv4 Changes
• ACLs
– NIM enhancements
• Security
• Highly available NIM
• Post install configuration of Etherchannel and Virtual IP
– SUMA patch tool
– Last version to support 32 bit kernel
– MP kernel even on a UP
– Most commands changed to support LPAR stats
4
32 bit versus 64 bit
• 32 Bit
• Up to 96GB memory
• Uses JFS for rootvg
• Runs on 32 or 64 bit
hardware
• Hardware all defaults to
32 bit
• JFS is optimized for 32
bit
• 5.3 is last version of AIX
with 32 bit kernel
• 64 bit
• Allows > 96GB memory
• Current max is 256GB
(arch is 16TB)
• Uses JFS2 for rootvg
• Supports 32 and 64 bit
apps
• JFS2 is optimized for 64
bit
JFS versus JFS2
• JFS
• 2gb file max unless BF
• Can use with DIO
• Optimized for 32 bit
• Runs on 32 bit or 64 bit
• JFS2
• Optimized for 64 bit
• Required for CIO
• Allows larger file sizes
• Runs on 32 bit or 64 bit
5
DIO and CIO
• DIO
– Direct I/O
– Around since AIX v5.1
– Used with JFS
– CIO is built on it
– Effectively bypasses filesystem caching to bring data directly
into application buffers
– Does not like compressed JFS or BF (lfe) filesystems
– Reduces CPU and eliminates overhead copying data twice
– Reads are synchronous
– Bypasses filesystem readahead
– Inode locks still used
DIO and CIO
• CIO
– Concurrent I/O
– Only available in JFS2
– Allows performance close to raw devices
– Use for Oracle data and logs, not for binaries
– No system buffer caching
– Designed for apps (such as RDBs)that enforce
serialization at the app
– Allows non-use of inode locks
– Implies DIO as well
– Not all apps benefit from CIO and DIO –
some are betttr with filesystem caching
6
Performance Tuning
• CPU
– vmstat, ps, nmon
• Network
– netstat, nfsstat, no, nfso
• I/O
– iostat, filemon, ioo, lvmo
• Memory
– lsps, svmon, vmstat, vmo, ioo
CPU Time
• Real
– Wallclock time
• User State
– Time running a users program
– Includes library calls
– Affected by optimization and inefficient code
• System
– Time spent in system state on behalf of user
– Kernel calls and all I/O routines
– Affected by blocking I/O transfers
• I/O and Network
– Time spent moving data and servicing I/O requests
7
Tools
• vmstat – for processor and memory
• nmon
– http://www-106.ibm.com/developerworks/eserver/articles/analyze_aix/
• nmon analyzer
– http://www-106.ibm.com/developerworks/eserver/articles/nmon_analyser/
• sar
– sar -A -o filename 2 30 >/dev/null
• ps
– ps gv | head -n 1 >filename
– ps gv | egrep -v "RSS" | sort +6b -7 -n -r >>filename
– ps –ef
– ps aux
vmstat
IGNORE FIRST LINE - average since boot
Run vmstat over an interval (i.e. vmstat 2 30)
System configuration: lcpu=24 mem=102656MB ent=0
kthr memory page faults cpu
----- ----------- ------------------------ ------------ -----------------------
r b avm fre re pi po fr sr cy in sy cs us sy id wa pc ec
1 1 18451085 7721230 0 0 0 0 0 0 1540 30214 10549 4 5 88 4 1.36 11.3
1 1 18437534 7734781 0 0 0 0 0 0 1684 30499 11484 5 5 87 4 1.40 11.6
56 1 18637043 7533530 0 0 0 0 0 0 4298 24564 9866 98 2 0 0 12.00 100.0
57 1 18643753 7526811 0 0 0 0 0 0 3867 25124 9130 98 2 0 0 12.00 100.0
Pc = processors consumed
Ec = entitled capacity consumed
fre should be between minfree and maxfree
fr:sr ratio 1783:2949 means that for every 1783 pages freed 2949 pages had to
be examined.
To get a 60 second average try: vmstat 60 2
8
vmstat -I
vmstat -I
System configuration: lcpu=24 mem=102656MB ent=0
kthr memory page faults cpu
-------- ----------- ------------------------ ------------ -----------------------
r b p avm fre fi fo pi po fr sr in sy cs us sy id wa pc ec
4 7 0 18437529 7734646 492 521 0 0 0 0 2839 34733 15805 7 1 87 6 1.01 8.4
System configuration: lcpu=24 mem=102656MB ent=0
kthr memory page faults cpu
-------- ----------- ------------------------ ------------ -----------------------
r b p avm fre fi fo pi po fr sr in sy cs us sy id wa pc ec
4 7 0 18644053 7526373 472 499 0 0 0 0 2836 34826 15801 7 1 99 99 1.06 8.8
vmstat -s
774400476 total address trans. faults
557108234 page ins
589044152 page outs
0 paging space page ins
0 paging space page outs
0 total reclaims
272954956 zero filled pages faults
45692 executable filled pages faults
0 pages examined by clock
0 revolutions of the clock hand Compare 2 snapshots 60 seconds apart
0 pages freed by the clock
394231320 backtracks
0 free frame waits
0 extend XPT waits
407266032 pending I/O waits
1146102449 start I/Os
812431131 iodones
18592774929 cpu context switches
3338223399 device interrupts
4351388859 software interrupts
1207868395 decrementer interrupts
699614 mpc-sent interrupts
699595 mpc-receive interrupts
92841048 phantom interrupts
0 traps
40977828143 syscalls
9
vmstat -v
• 26279936 memory pages
• 25220934 lruable pages
• 7508669 free pages
• 4 memory pools
• 3829840 pinned pages
• 80.0 maxpin percentage
• 20.0 minperm percentage
• 80.0 maxperm percentage
• 0.3 numperm percentage
• 89337 file pages
• 0.0 compressed percentage
• 0 compressed pages
• 0.1 numclient percentage
• 80.0 maxclient percentage
• 28905 client pages
• 0 remote pageouts scheduled
• 280354 pending disk I/Os blocked with no pbuf
• 0 paging space I/Os blocked with no psbuf
• 2938 filesystem I/Os blocked with no fsbuf
• 7911578 client filesystem I/Os blocked with no fsbuf
• 0 external pager filesystem I/Os blocked with no fsbuf
• Totals since boot so look at 2 snapshots 60 seconds apart
lparstat
lparstat -h
System Configuration: type=shared mode=Uncapped smt=On lcpu=4 mem=512 ent=5.0
%user %sys %wait %idle physc %entc lbusy app vcsw phint %hypv hcalls
0.0 0.5 0.0 99.5 0.00 1.0 0.0 - 1524 0 0.5 1542
16.0 76.3 0.0 7.7 0.30 100.0 90.5 - 321 1 0.9 259
Physc – physical processors consumed
Lbusy – logical processor utilization for system and user
Phint – phantom interrupts to other partitions
http://publib.boulder.ibm.com/infocenter/pseries/index.jsp?topic=/com.ibm.aix.doc/cmds/aixcmds3/lparstat.htm
10
lparstat -H
lparstat –H
Gives info per Hypervisor call type as follows:
Number of calls
Time spent on this types of calls
Hypervisor time spent on this type of call
Average call time
Max call time
http://publib.boulder.ibm.com/infocenter/pseries/index.jsp?topic=/com.ibm.aix.doc/cmds/aixcmds3/lparstat.htm
mpstat
mpstat –s
System configuration: lcpu=4 ent=0.5
Proc1 Proc0
0.27% 49.63%
cpu0 cpu2 cpu1 cpu3
0.17% 0.10% 3.14% 46.49%
Above shows how processor is distributed using SMT
11
Network
• Buffers
– Mbufs
• Kernel buffer using pinned memory
• thewall is max memory for mbufs
– TCP and UDP receive and send buffers
– Ethernet adapter attributes
– no and nfso commands
– nfsstat
– rfc1323 and nfs_rfc1323
netstat
• netstat –i
– Shows input and output packets and errors for
each adapter
– Also shows collisions
• netstat –ss
– Shows summary info such as udp packets dropped
due to no socket
• netstat –m
– Memory information
• netstat –v
– Statistical information on all adapters
12
Network tuneables
• no -a
• Using no
– rfc1323 = 1
– sb_max=1310720
– tcp_sendspace=262144
– tcp_recvspace=262144
– udp_sendspace=65536
– udp_recvspace=655360
• Using nfso
– nfso -a
– Nfs_rfc1323=1
– nfs_socketsize=60000
• Do a web search on “nagle effect”
nfsstat
• Client and Server NFS Info
• nfsstat –cn or –r or –s
– Retransmissions due to errors
• Retrans>5% is bad
– Badcalls
– Timeouts
– Waits
– Reads
13
Memory and I/O problems
• iostat
– Look for overloaded disks and adapters
• vmstat
• vmo and ioo (replace vmtune)
• sar
• fileplace and filemon
• Asynchronous I/O
• Paging
• svmon
– svmon -G >filename
• Nmon
• Check error logs
I/O Tuneables 1/3
• minperm
– default is 20%
• maxperm
– default is 80%
– This is a soft limit
– Affects JFS filesystems
• numperm
– This is what percent of real memory is currently being used for caching
files - if it is high reduce maxperm to 30 to 50%
• strict_maxperm
– Used to avoid double caching – be extra careful!!!!!
• Reducing maxperm stops file caching affecting programs that are running
• maxrandwrt is random write behind
– default is 0 – try 32
• numclust is sequential write behind
14
I/O Tuneables 2/3
• maxclient
– default is 80%
– Must be less than or equal to maxperm
– Affects NFS and JFS2
– Hard limit by default
• numclient
– This is what percent of real memory is currently being used for caching
JFS2 filesystems and NFS
• strict_maxclient
– Available at AIX 5.2 ML4
– By default it is set to a hard limit
– Change to a soft limit
• J2_maxRandomWrite is random write behind
– default is 0 – try 32
• J2_nPagesPerWriteBehindCluster
– Default is 32
• J2_nRandomCluster is sequential write behind
I/O Tuneables 2/2
• minpgahead, maxpgahead, J2_minPageReadAhead &
J2_maxPageReadAhead
– Default min =2 max = 8
– Maxfree – minfree >= maxpgahead
• lvm_bufcnt
– Buffers for raw I/O. Default is 9
– Increase if doing large raw I/Os (no jfs)
• numfsbufs
– Helps write performance for large write sizes
• hd_pbuf_cnt
– Pinned buffers to hold JFS I/O requests
– Increase if large sequential I/Os to stop I/Os bottlenecking at the
LVM
– One pbuf is used per sequential I/O request regardless of the
number of pages
– With AIX v5.3 each VG gets its own set of pbufs
– Prior to AIX 5.3 it was a system wide setting
• sync_release_ilock
15
ioo Output
• lvm_bufcnt = 9
• minpgahead = 2
• maxpgahead = 8
• maxrandwrt = 32 (default is 0)
• numclust = 1
• numfsbufs = 186
• sync_release_ilock = 0
• pd_npages = 65536
• pv_min_pbuf = 512
• j2_minPageReadAhead = 2
• j2_maxPageReadAhead = 8
• j2_nBufferPerPagerDevice = 512
• j2_nPagesPerWriteBehindCluster = 32
• j2_maxRandomWrite = 0
• j2_nRandomCluster = 0
vmo Output
DEFAULTS
maxfree = 128
minfree = 120
minperm% = 20
maxperm% = 80
maxpin% = 80
maxclient% = 80
strict_maxclient = 1
strict_maxperm = 0
OFTEN SEEN
maxfree = 1088
minfree = 960
minperm% = 10
maxperm% = 30
maxpin% = 80
Maxclient% = 30
strict_maxclient = 0
strict_maxperm = 0
16
iostat
IGNORE FIRST LINE - average since boot
Run iostat over an interval (i.e. iostat 2 30)
tty: tin tout avg-cpu: % user % sys % idle % iowait physc % entc
0.0 1406.0 93.1 6.9 0.0 0.0 12.0 100.0
Disks: % tm_act Kbps tps Kb_read Kb_wrtn
hdisk1 1.0 1.5 3.0 0 3
hdisk0 6.5 385.5 19.5 0 771
hdisk14 40.5 13004.0 3098.5 12744 13264
hdisk7 21.0 6926.0 271.0 440 13412
hdisk15 50.5 14486.0 3441.5 13936 15036
hdisk17 0.0 0.0 0.0 0 0
iostat –a Adapters
System configuration: lcpu=16 drives=15
tty: tin tout avg-cpu: % user % sys % idle % iowait
0.4 195.3 21.4 3.3 64.7 10.6
Adapter: Kbps tps Kb_read Kb_wrtn
fscsi1 5048.8 516.9 1044720428 167866596
Disks: % tm_act Kbps tps Kb_read Kb_wrtn
hdisk6 23.4 1846.1 195.2 381485286 61892408
hdisk9 13.9 1695.9 163.3 373163554 34143700
hdisk8 14.4 1373.3 144.6 283786186 46044360
hdisk7 1.1 133.5 13.8 6285402 25786128
Adapter: Kbps tps Kb_read Kb_wrtn
fscsi0 4438.6 467.6 980384452 85642468
Disks: % tm_act Kbps tps Kb_read Kb_wrtn
hdisk5 15.2 1387.4 143.8 304880506 28324064
hdisk2 15.5 1364.4 148.1 302734898 24950680
hdisk3 0.5 81.4 6.8 3515294 16043840
hdisk4 15.8 1605.4 168.8 369253754 16323884
17
iostat -D
Extended Drive Report
hdisk3 xfer: %tm_act bps tps bread bwrtn
0.5 29.7K 6.8 15.0K 14.8K
read: rps avgserv minserv maxserv timeouts fails
29.3 0.1 0.1 784.5 0 0
write: wps avgserv minserv maxserv timeouts fails
133.6 0.0 0.3 2.1S 0 0
wait: avgtime mintime maxtime avgqsz qfull
0.0 0.0 0.2 0.0 0
iostat Other
iostat -A async IO
System configuration: lcpu=16 drives=15
aio: avgc avfc maxg maif maxr avg-cpu: % user % sys % idle % iowait
150 0 5652 0 12288 21.4 3.3 64.7 10.6
Disks: % tm_act Kbps tps Kb_read Kb_wrtn
hdisk6 23.4 1846.1 195.2 381485298 61892856
hdisk5 15.2 1387.4 143.8 304880506 28324064
hdisk9 13.9 1695.9 163.3 373163558 34144512
iostat -m paths
System configuration: lcpu=16 drives=15
tty: tin tout avg-cpu: % user % sys % idle % iowait
0.4 195.3 21.4 3.3 64.7 10.6
Disks: % tm_act Kbps tps Kb_read Kb_wrtn
hdisk0 1.6 17.0 3.7 1190873 2893501
Paths: % tm_act Kbps tps Kb_read Kb_wrtn
Path0 1.6 17.0 3.7 1190873 2893501
18
lvmo
• lvmo output
•
• vgname = rootvg
• pv_pbuf_count = 256
• total_vg_pbufs = 512
• max_vg_pbuf_count = 8192
• pervg_blocked_io_count = 0
• global_pbuf_count = 512
• global_blocked_io_count = 46
lsps –a
(similar to pstat)
• Ensure all page datasets the same size
although hd6 can be bigger - ensure more
page space than memory
• Only includes pages allocated (default)
• Use lsps -s to get all pages (includes reserved
via early allocation (PSALLOC=early)
• Use multiple page datasets on multiple disks
19
lsps output
lsps -a
Page Space Physical Volume Volume Group Size %Used Active Auto Type
paging05 hdisk9 pagvg01 2072MB 1 yes yes lv
paging04 hdisk5 vgpaging01 504MB 1 yes yes lv
paging02 hdisk4 vgpaging02 168MB 1 yes yes lv
paging01 hdisk3 vgpagine03 168MB 1 yes yes lv
paging00 hdisk2 vgpaging04 168MB 1 yes yes lv
hd6 hdisk0 rootvg 512MB 1 yes yes lv
lsps -s
Total Paging Space Percent Used
3592MB 1%
Bad Layout above
Should be balanced
Make hd6 the biggest by one lp or the same size as the others
svmon -G
size inuse free pin virtual
memory 26279936 18778708 7501792 3830899 18669057
pg space 7995392 53026
work pers clnt lpage
pin 3830890 0 0 0
in use 18669611 80204 28893 0
In GB Equates to:
size inuse free pin virtual
memory 100.25 71.64 28.62 14.61 71.22
pg space 30.50 0.20
work pers clnt lpage
pin 14.61 0 0 0
in use 71.22 0.31 0.15 0
20
I/O Pacing
• Set high value to multiple of (4*n)+1
• Limits the number of outstanding I/Os
against an individual file
• minpout – minimum
• maxpout – maximum
• If process reaches maxpout then it is
suspended from creating I/O until
outstanding requests reach minpout
Other
• Mirroring of disks
– lslv to check # copies
– Mirror write consistency
• Mapping of backend disks
– Don’t software mirror if already raided
• RIO and adapter Limits
• Logical volume scheduling policy
– Parallel
– Parallel/sequential
– Parallel/roundrobin
– Sequential
• Async I/O
21
Async I/O
Total number of AIOs in use
pstat –a | grep aios | wc –l
4205
AIO max possible requests
lsattr –El aio0 –a maxreqs
maxreqs 4096 Maximum number of REQUESTS True
AIO maxservers
lsattr –El aio0 –a maxservers
maxservers 320 MAXIMUM number of servers per cpu True
NB – maxservers is a per processor setting in AIX 5.3
Other tools
• filemon
– filemon -v -o filename -O all
– sleep 30
– trcstop
• pstat to check async I/O
– pstat -a | grep aio | wc –l
• perfpmr to build performance info for
IBM
– /usr/bin/perfpmr.sh 300
22
Striping
• Spread data across drives
• Improves r/w performance of large
sequential files
• Can mirror stripe sets
• Stripe width = # of stripes
• Stripe size
– Set to 64kb for best sequential I/O
throughput
– Any N² from 4kb to 128kb
General
Recommendations
• Different hot LVs on separate physical volumes
• Stripe hot LV across disks to parallelize
• Mirror read intensive data
• Ensure LVs are contiguous
– Use lslv and look at in-band % and distrib
– reorgvg if needed to reorg LVs
• Writeverify=no
• minpgahead=2, maxpgahead=16 for 64kb stripe size
• Increase maxfree if you adjust maxpgahead
• Tweak minperm, maxperm and maxrandwrt
• Tweak lvm_bufcnt if doing a lot of large raw I/Os
• If JFS2 tweak j2 versions of above fields
• Clean out inittab and rc.tcpip for things that should not start
23
References
• IBM Redbooks
– SG24-7940 – Advanced Power Virtualization on IBM p5 servers –
Introduction and Basic Configuration
– The Complete Partitioning Guide for IBM eServer pSeries Servers
– pSeries – LPAR Planning Redpiece
– Logical Partition Security in the IBM eServer pSeries 690
– Technical Overview Redbooks for p520, p550 and p570, etc
– SG24-7039 - Partitioning Implementation on p5 and Openpower
Servers
• eServer Magazine and AiXtra
– http://www.eservercomputing.com/
• Search on Jaqui AND Lynch
• Articles on Tuning and Virtualization
• Find more on Mainline at:
– http://mainline.com/ebrochure
Questions?

Presentation aix performance tuning

  • 1.
    1 AIX Performance Tuning JaquiLynch Senior Systems Engineer Mainline Information Systems Userblue Session 6601 http://www.circle4.com/papers/s6601jla.pdf Agenda • AIX v5.2 versus AIX v5.3 • 32 bit versus 64 bit • JFS versus JFS2 • DIO and CIO • AIX Performance Tips
  • 2.
    2 New in AIX5.2 • P5 support • JFS2 • Large Page support (16mb) • Dynamic LPAR • Small Memory Mode – Better granularity in assignment of memory to LPARs • CuOD • xProfiler • New Performance commands – vmo, ioo, schedo replace schedtune and vmtune • AIX 5.1 Status – Will not run on p5 hardware – Withdrawn from marketing end April 2005 – Support withdrawn April 2006 AIX 5.3 • New in 5.3 – With Power5 hardware • SMT • Virtual Ethernet • With APV – Shared Ethernet – Virtual SCSI Adapter – Micropartitioning – PLM
  • 3.
    3 AIX 5.3 • Newin 5.3 – JFS2 Updates • Improved journaling • Extent based allocation • 1tb filesystems and files with potential of 4PB • Accounting • Filesystem shrink • Striped Columns – Can extend striped LV if a disk fills up • 1024 disk scalable volume group – 1024 PVs, 4096 LVs, 2M pps/vg • Quotas • Each VG now has its own tunable pbuf pool – Use lvmo command AIX 5.3 • New in 5.3 – NFSv4 Changes • ACLs – NIM enhancements • Security • Highly available NIM • Post install configuration of Etherchannel and Virtual IP – SUMA patch tool – Last version to support 32 bit kernel – MP kernel even on a UP – Most commands changed to support LPAR stats
  • 4.
    4 32 bit versus64 bit • 32 Bit • Up to 96GB memory • Uses JFS for rootvg • Runs on 32 or 64 bit hardware • Hardware all defaults to 32 bit • JFS is optimized for 32 bit • 5.3 is last version of AIX with 32 bit kernel • 64 bit • Allows > 96GB memory • Current max is 256GB (arch is 16TB) • Uses JFS2 for rootvg • Supports 32 and 64 bit apps • JFS2 is optimized for 64 bit JFS versus JFS2 • JFS • 2gb file max unless BF • Can use with DIO • Optimized for 32 bit • Runs on 32 bit or 64 bit • JFS2 • Optimized for 64 bit • Required for CIO • Allows larger file sizes • Runs on 32 bit or 64 bit
  • 5.
    5 DIO and CIO •DIO – Direct I/O – Around since AIX v5.1 – Used with JFS – CIO is built on it – Effectively bypasses filesystem caching to bring data directly into application buffers – Does not like compressed JFS or BF (lfe) filesystems – Reduces CPU and eliminates overhead copying data twice – Reads are synchronous – Bypasses filesystem readahead – Inode locks still used DIO and CIO • CIO – Concurrent I/O – Only available in JFS2 – Allows performance close to raw devices – Use for Oracle data and logs, not for binaries – No system buffer caching – Designed for apps (such as RDBs)that enforce serialization at the app – Allows non-use of inode locks – Implies DIO as well – Not all apps benefit from CIO and DIO – some are betttr with filesystem caching
  • 6.
    6 Performance Tuning • CPU –vmstat, ps, nmon • Network – netstat, nfsstat, no, nfso • I/O – iostat, filemon, ioo, lvmo • Memory – lsps, svmon, vmstat, vmo, ioo CPU Time • Real – Wallclock time • User State – Time running a users program – Includes library calls – Affected by optimization and inefficient code • System – Time spent in system state on behalf of user – Kernel calls and all I/O routines – Affected by blocking I/O transfers • I/O and Network – Time spent moving data and servicing I/O requests
  • 7.
    7 Tools • vmstat –for processor and memory • nmon – http://www-106.ibm.com/developerworks/eserver/articles/analyze_aix/ • nmon analyzer – http://www-106.ibm.com/developerworks/eserver/articles/nmon_analyser/ • sar – sar -A -o filename 2 30 >/dev/null • ps – ps gv | head -n 1 >filename – ps gv | egrep -v "RSS" | sort +6b -7 -n -r >>filename – ps –ef – ps aux vmstat IGNORE FIRST LINE - average since boot Run vmstat over an interval (i.e. vmstat 2 30) System configuration: lcpu=24 mem=102656MB ent=0 kthr memory page faults cpu ----- ----------- ------------------------ ------------ ----------------------- r b avm fre re pi po fr sr cy in sy cs us sy id wa pc ec 1 1 18451085 7721230 0 0 0 0 0 0 1540 30214 10549 4 5 88 4 1.36 11.3 1 1 18437534 7734781 0 0 0 0 0 0 1684 30499 11484 5 5 87 4 1.40 11.6 56 1 18637043 7533530 0 0 0 0 0 0 4298 24564 9866 98 2 0 0 12.00 100.0 57 1 18643753 7526811 0 0 0 0 0 0 3867 25124 9130 98 2 0 0 12.00 100.0 Pc = processors consumed Ec = entitled capacity consumed fre should be between minfree and maxfree fr:sr ratio 1783:2949 means that for every 1783 pages freed 2949 pages had to be examined. To get a 60 second average try: vmstat 60 2
  • 8.
    8 vmstat -I vmstat -I Systemconfiguration: lcpu=24 mem=102656MB ent=0 kthr memory page faults cpu -------- ----------- ------------------------ ------------ ----------------------- r b p avm fre fi fo pi po fr sr in sy cs us sy id wa pc ec 4 7 0 18437529 7734646 492 521 0 0 0 0 2839 34733 15805 7 1 87 6 1.01 8.4 System configuration: lcpu=24 mem=102656MB ent=0 kthr memory page faults cpu -------- ----------- ------------------------ ------------ ----------------------- r b p avm fre fi fo pi po fr sr in sy cs us sy id wa pc ec 4 7 0 18644053 7526373 472 499 0 0 0 0 2836 34826 15801 7 1 99 99 1.06 8.8 vmstat -s 774400476 total address trans. faults 557108234 page ins 589044152 page outs 0 paging space page ins 0 paging space page outs 0 total reclaims 272954956 zero filled pages faults 45692 executable filled pages faults 0 pages examined by clock 0 revolutions of the clock hand Compare 2 snapshots 60 seconds apart 0 pages freed by the clock 394231320 backtracks 0 free frame waits 0 extend XPT waits 407266032 pending I/O waits 1146102449 start I/Os 812431131 iodones 18592774929 cpu context switches 3338223399 device interrupts 4351388859 software interrupts 1207868395 decrementer interrupts 699614 mpc-sent interrupts 699595 mpc-receive interrupts 92841048 phantom interrupts 0 traps 40977828143 syscalls
  • 9.
    9 vmstat -v • 26279936memory pages • 25220934 lruable pages • 7508669 free pages • 4 memory pools • 3829840 pinned pages • 80.0 maxpin percentage • 20.0 minperm percentage • 80.0 maxperm percentage • 0.3 numperm percentage • 89337 file pages • 0.0 compressed percentage • 0 compressed pages • 0.1 numclient percentage • 80.0 maxclient percentage • 28905 client pages • 0 remote pageouts scheduled • 280354 pending disk I/Os blocked with no pbuf • 0 paging space I/Os blocked with no psbuf • 2938 filesystem I/Os blocked with no fsbuf • 7911578 client filesystem I/Os blocked with no fsbuf • 0 external pager filesystem I/Os blocked with no fsbuf • Totals since boot so look at 2 snapshots 60 seconds apart lparstat lparstat -h System Configuration: type=shared mode=Uncapped smt=On lcpu=4 mem=512 ent=5.0 %user %sys %wait %idle physc %entc lbusy app vcsw phint %hypv hcalls 0.0 0.5 0.0 99.5 0.00 1.0 0.0 - 1524 0 0.5 1542 16.0 76.3 0.0 7.7 0.30 100.0 90.5 - 321 1 0.9 259 Physc – physical processors consumed Lbusy – logical processor utilization for system and user Phint – phantom interrupts to other partitions http://publib.boulder.ibm.com/infocenter/pseries/index.jsp?topic=/com.ibm.aix.doc/cmds/aixcmds3/lparstat.htm
  • 10.
    10 lparstat -H lparstat –H Givesinfo per Hypervisor call type as follows: Number of calls Time spent on this types of calls Hypervisor time spent on this type of call Average call time Max call time http://publib.boulder.ibm.com/infocenter/pseries/index.jsp?topic=/com.ibm.aix.doc/cmds/aixcmds3/lparstat.htm mpstat mpstat –s System configuration: lcpu=4 ent=0.5 Proc1 Proc0 0.27% 49.63% cpu0 cpu2 cpu1 cpu3 0.17% 0.10% 3.14% 46.49% Above shows how processor is distributed using SMT
  • 11.
    11 Network • Buffers – Mbufs •Kernel buffer using pinned memory • thewall is max memory for mbufs – TCP and UDP receive and send buffers – Ethernet adapter attributes – no and nfso commands – nfsstat – rfc1323 and nfs_rfc1323 netstat • netstat –i – Shows input and output packets and errors for each adapter – Also shows collisions • netstat –ss – Shows summary info such as udp packets dropped due to no socket • netstat –m – Memory information • netstat –v – Statistical information on all adapters
  • 12.
    12 Network tuneables • no-a • Using no – rfc1323 = 1 – sb_max=1310720 – tcp_sendspace=262144 – tcp_recvspace=262144 – udp_sendspace=65536 – udp_recvspace=655360 • Using nfso – nfso -a – Nfs_rfc1323=1 – nfs_socketsize=60000 • Do a web search on “nagle effect” nfsstat • Client and Server NFS Info • nfsstat –cn or –r or –s – Retransmissions due to errors • Retrans>5% is bad – Badcalls – Timeouts – Waits – Reads
  • 13.
    13 Memory and I/Oproblems • iostat – Look for overloaded disks and adapters • vmstat • vmo and ioo (replace vmtune) • sar • fileplace and filemon • Asynchronous I/O • Paging • svmon – svmon -G >filename • Nmon • Check error logs I/O Tuneables 1/3 • minperm – default is 20% • maxperm – default is 80% – This is a soft limit – Affects JFS filesystems • numperm – This is what percent of real memory is currently being used for caching files - if it is high reduce maxperm to 30 to 50% • strict_maxperm – Used to avoid double caching – be extra careful!!!!! • Reducing maxperm stops file caching affecting programs that are running • maxrandwrt is random write behind – default is 0 – try 32 • numclust is sequential write behind
  • 14.
    14 I/O Tuneables 2/3 •maxclient – default is 80% – Must be less than or equal to maxperm – Affects NFS and JFS2 – Hard limit by default • numclient – This is what percent of real memory is currently being used for caching JFS2 filesystems and NFS • strict_maxclient – Available at AIX 5.2 ML4 – By default it is set to a hard limit – Change to a soft limit • J2_maxRandomWrite is random write behind – default is 0 – try 32 • J2_nPagesPerWriteBehindCluster – Default is 32 • J2_nRandomCluster is sequential write behind I/O Tuneables 2/2 • minpgahead, maxpgahead, J2_minPageReadAhead & J2_maxPageReadAhead – Default min =2 max = 8 – Maxfree – minfree >= maxpgahead • lvm_bufcnt – Buffers for raw I/O. Default is 9 – Increase if doing large raw I/Os (no jfs) • numfsbufs – Helps write performance for large write sizes • hd_pbuf_cnt – Pinned buffers to hold JFS I/O requests – Increase if large sequential I/Os to stop I/Os bottlenecking at the LVM – One pbuf is used per sequential I/O request regardless of the number of pages – With AIX v5.3 each VG gets its own set of pbufs – Prior to AIX 5.3 it was a system wide setting • sync_release_ilock
  • 15.
    15 ioo Output • lvm_bufcnt= 9 • minpgahead = 2 • maxpgahead = 8 • maxrandwrt = 32 (default is 0) • numclust = 1 • numfsbufs = 186 • sync_release_ilock = 0 • pd_npages = 65536 • pv_min_pbuf = 512 • j2_minPageReadAhead = 2 • j2_maxPageReadAhead = 8 • j2_nBufferPerPagerDevice = 512 • j2_nPagesPerWriteBehindCluster = 32 • j2_maxRandomWrite = 0 • j2_nRandomCluster = 0 vmo Output DEFAULTS maxfree = 128 minfree = 120 minperm% = 20 maxperm% = 80 maxpin% = 80 maxclient% = 80 strict_maxclient = 1 strict_maxperm = 0 OFTEN SEEN maxfree = 1088 minfree = 960 minperm% = 10 maxperm% = 30 maxpin% = 80 Maxclient% = 30 strict_maxclient = 0 strict_maxperm = 0
  • 16.
    16 iostat IGNORE FIRST LINE- average since boot Run iostat over an interval (i.e. iostat 2 30) tty: tin tout avg-cpu: % user % sys % idle % iowait physc % entc 0.0 1406.0 93.1 6.9 0.0 0.0 12.0 100.0 Disks: % tm_act Kbps tps Kb_read Kb_wrtn hdisk1 1.0 1.5 3.0 0 3 hdisk0 6.5 385.5 19.5 0 771 hdisk14 40.5 13004.0 3098.5 12744 13264 hdisk7 21.0 6926.0 271.0 440 13412 hdisk15 50.5 14486.0 3441.5 13936 15036 hdisk17 0.0 0.0 0.0 0 0 iostat –a Adapters System configuration: lcpu=16 drives=15 tty: tin tout avg-cpu: % user % sys % idle % iowait 0.4 195.3 21.4 3.3 64.7 10.6 Adapter: Kbps tps Kb_read Kb_wrtn fscsi1 5048.8 516.9 1044720428 167866596 Disks: % tm_act Kbps tps Kb_read Kb_wrtn hdisk6 23.4 1846.1 195.2 381485286 61892408 hdisk9 13.9 1695.9 163.3 373163554 34143700 hdisk8 14.4 1373.3 144.6 283786186 46044360 hdisk7 1.1 133.5 13.8 6285402 25786128 Adapter: Kbps tps Kb_read Kb_wrtn fscsi0 4438.6 467.6 980384452 85642468 Disks: % tm_act Kbps tps Kb_read Kb_wrtn hdisk5 15.2 1387.4 143.8 304880506 28324064 hdisk2 15.5 1364.4 148.1 302734898 24950680 hdisk3 0.5 81.4 6.8 3515294 16043840 hdisk4 15.8 1605.4 168.8 369253754 16323884
  • 17.
    17 iostat -D Extended DriveReport hdisk3 xfer: %tm_act bps tps bread bwrtn 0.5 29.7K 6.8 15.0K 14.8K read: rps avgserv minserv maxserv timeouts fails 29.3 0.1 0.1 784.5 0 0 write: wps avgserv minserv maxserv timeouts fails 133.6 0.0 0.3 2.1S 0 0 wait: avgtime mintime maxtime avgqsz qfull 0.0 0.0 0.2 0.0 0 iostat Other iostat -A async IO System configuration: lcpu=16 drives=15 aio: avgc avfc maxg maif maxr avg-cpu: % user % sys % idle % iowait 150 0 5652 0 12288 21.4 3.3 64.7 10.6 Disks: % tm_act Kbps tps Kb_read Kb_wrtn hdisk6 23.4 1846.1 195.2 381485298 61892856 hdisk5 15.2 1387.4 143.8 304880506 28324064 hdisk9 13.9 1695.9 163.3 373163558 34144512 iostat -m paths System configuration: lcpu=16 drives=15 tty: tin tout avg-cpu: % user % sys % idle % iowait 0.4 195.3 21.4 3.3 64.7 10.6 Disks: % tm_act Kbps tps Kb_read Kb_wrtn hdisk0 1.6 17.0 3.7 1190873 2893501 Paths: % tm_act Kbps tps Kb_read Kb_wrtn Path0 1.6 17.0 3.7 1190873 2893501
  • 18.
    18 lvmo • lvmo output • •vgname = rootvg • pv_pbuf_count = 256 • total_vg_pbufs = 512 • max_vg_pbuf_count = 8192 • pervg_blocked_io_count = 0 • global_pbuf_count = 512 • global_blocked_io_count = 46 lsps –a (similar to pstat) • Ensure all page datasets the same size although hd6 can be bigger - ensure more page space than memory • Only includes pages allocated (default) • Use lsps -s to get all pages (includes reserved via early allocation (PSALLOC=early) • Use multiple page datasets on multiple disks
  • 19.
    19 lsps output lsps -a PageSpace Physical Volume Volume Group Size %Used Active Auto Type paging05 hdisk9 pagvg01 2072MB 1 yes yes lv paging04 hdisk5 vgpaging01 504MB 1 yes yes lv paging02 hdisk4 vgpaging02 168MB 1 yes yes lv paging01 hdisk3 vgpagine03 168MB 1 yes yes lv paging00 hdisk2 vgpaging04 168MB 1 yes yes lv hd6 hdisk0 rootvg 512MB 1 yes yes lv lsps -s Total Paging Space Percent Used 3592MB 1% Bad Layout above Should be balanced Make hd6 the biggest by one lp or the same size as the others svmon -G size inuse free pin virtual memory 26279936 18778708 7501792 3830899 18669057 pg space 7995392 53026 work pers clnt lpage pin 3830890 0 0 0 in use 18669611 80204 28893 0 In GB Equates to: size inuse free pin virtual memory 100.25 71.64 28.62 14.61 71.22 pg space 30.50 0.20 work pers clnt lpage pin 14.61 0 0 0 in use 71.22 0.31 0.15 0
  • 20.
    20 I/O Pacing • Sethigh value to multiple of (4*n)+1 • Limits the number of outstanding I/Os against an individual file • minpout – minimum • maxpout – maximum • If process reaches maxpout then it is suspended from creating I/O until outstanding requests reach minpout Other • Mirroring of disks – lslv to check # copies – Mirror write consistency • Mapping of backend disks – Don’t software mirror if already raided • RIO and adapter Limits • Logical volume scheduling policy – Parallel – Parallel/sequential – Parallel/roundrobin – Sequential • Async I/O
  • 21.
    21 Async I/O Total numberof AIOs in use pstat –a | grep aios | wc –l 4205 AIO max possible requests lsattr –El aio0 –a maxreqs maxreqs 4096 Maximum number of REQUESTS True AIO maxservers lsattr –El aio0 –a maxservers maxservers 320 MAXIMUM number of servers per cpu True NB – maxservers is a per processor setting in AIX 5.3 Other tools • filemon – filemon -v -o filename -O all – sleep 30 – trcstop • pstat to check async I/O – pstat -a | grep aio | wc –l • perfpmr to build performance info for IBM – /usr/bin/perfpmr.sh 300
  • 22.
    22 Striping • Spread dataacross drives • Improves r/w performance of large sequential files • Can mirror stripe sets • Stripe width = # of stripes • Stripe size – Set to 64kb for best sequential I/O throughput – Any N² from 4kb to 128kb General Recommendations • Different hot LVs on separate physical volumes • Stripe hot LV across disks to parallelize • Mirror read intensive data • Ensure LVs are contiguous – Use lslv and look at in-band % and distrib – reorgvg if needed to reorg LVs • Writeverify=no • minpgahead=2, maxpgahead=16 for 64kb stripe size • Increase maxfree if you adjust maxpgahead • Tweak minperm, maxperm and maxrandwrt • Tweak lvm_bufcnt if doing a lot of large raw I/Os • If JFS2 tweak j2 versions of above fields • Clean out inittab and rc.tcpip for things that should not start
  • 23.
    23 References • IBM Redbooks –SG24-7940 – Advanced Power Virtualization on IBM p5 servers – Introduction and Basic Configuration – The Complete Partitioning Guide for IBM eServer pSeries Servers – pSeries – LPAR Planning Redpiece – Logical Partition Security in the IBM eServer pSeries 690 – Technical Overview Redbooks for p520, p550 and p570, etc – SG24-7039 - Partitioning Implementation on p5 and Openpower Servers • eServer Magazine and AiXtra – http://www.eservercomputing.com/ • Search on Jaqui AND Lynch • Articles on Tuning and Virtualization • Find more on Mainline at: – http://mainline.com/ebrochure Questions?