Download to read offline


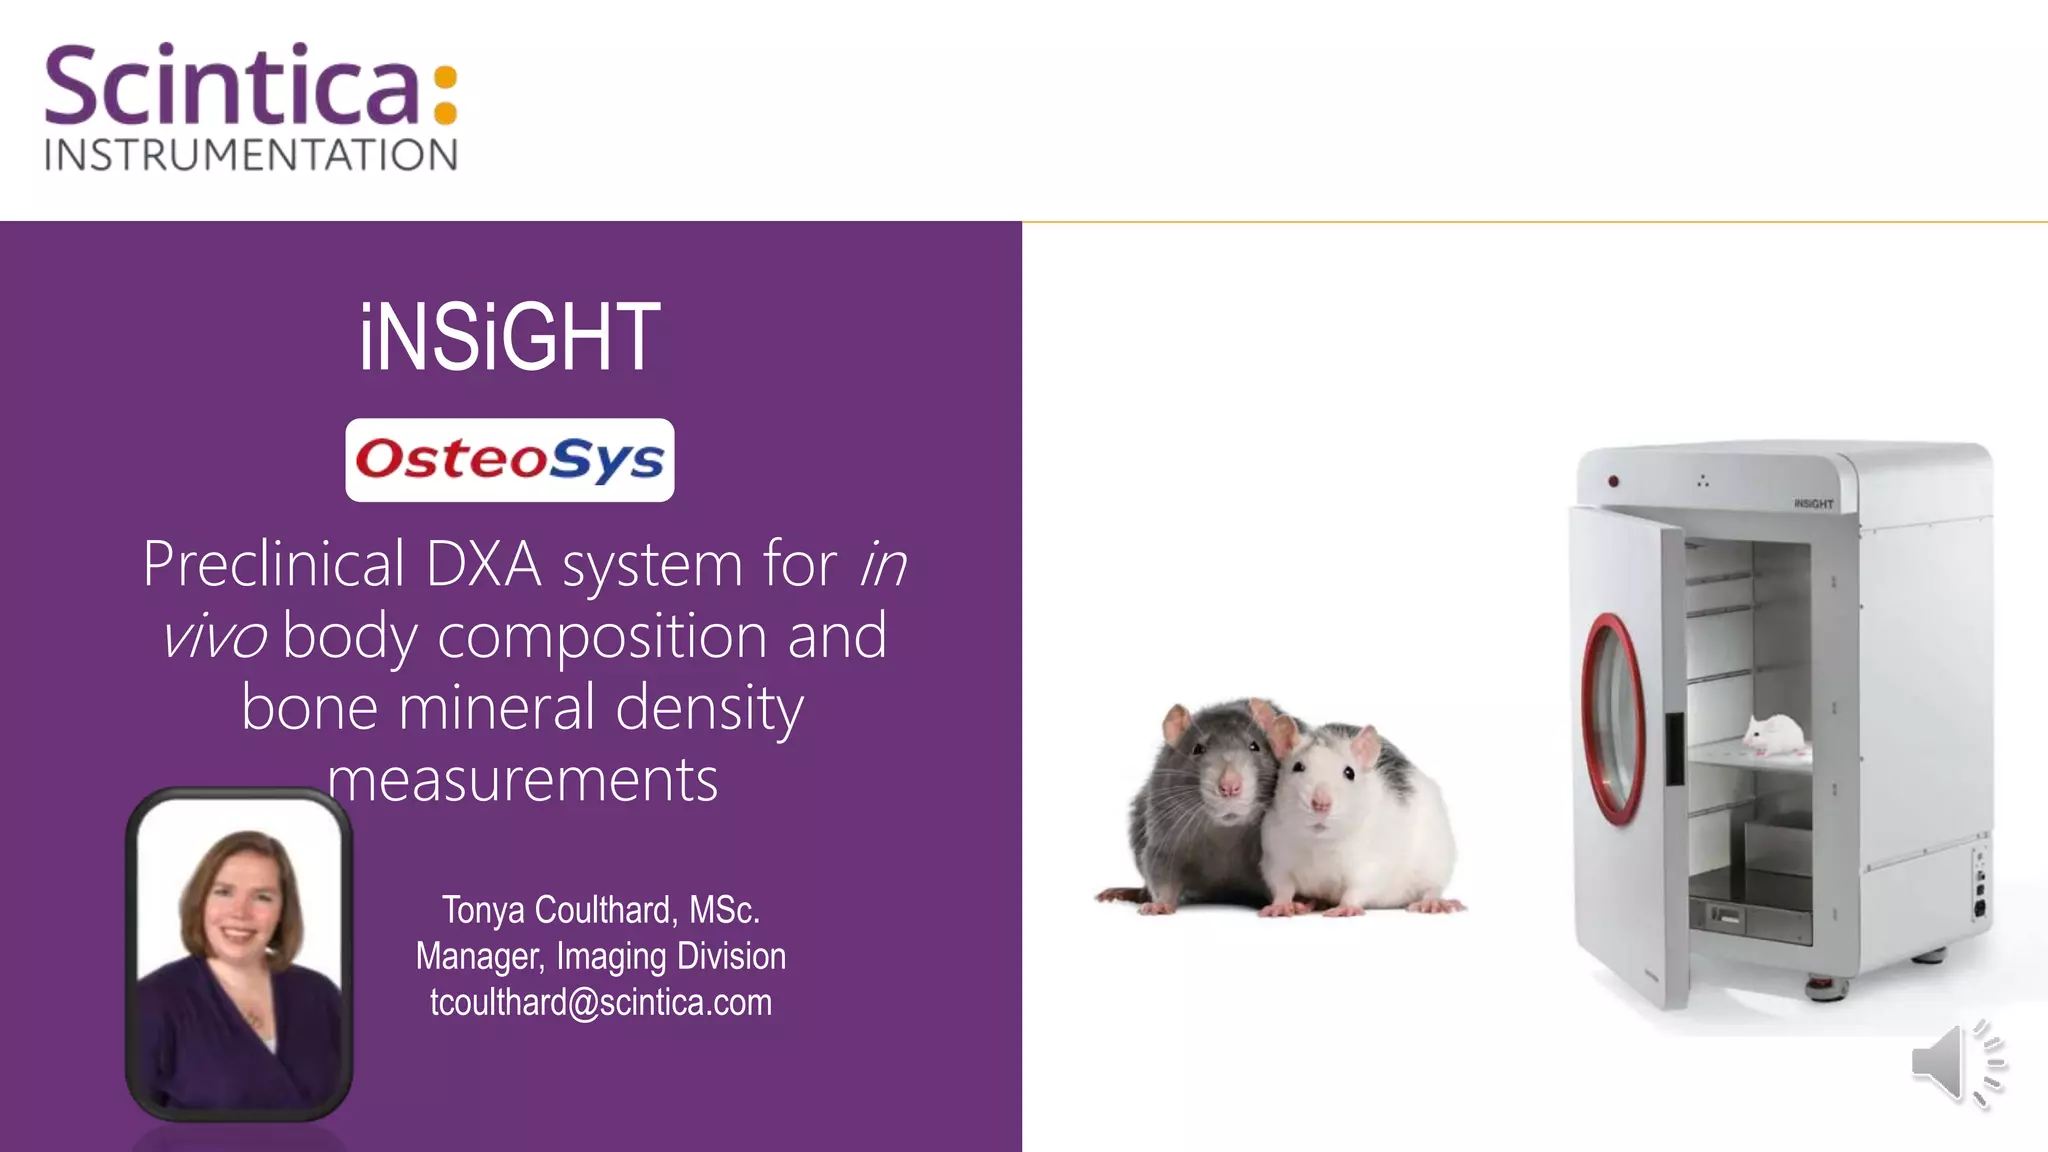
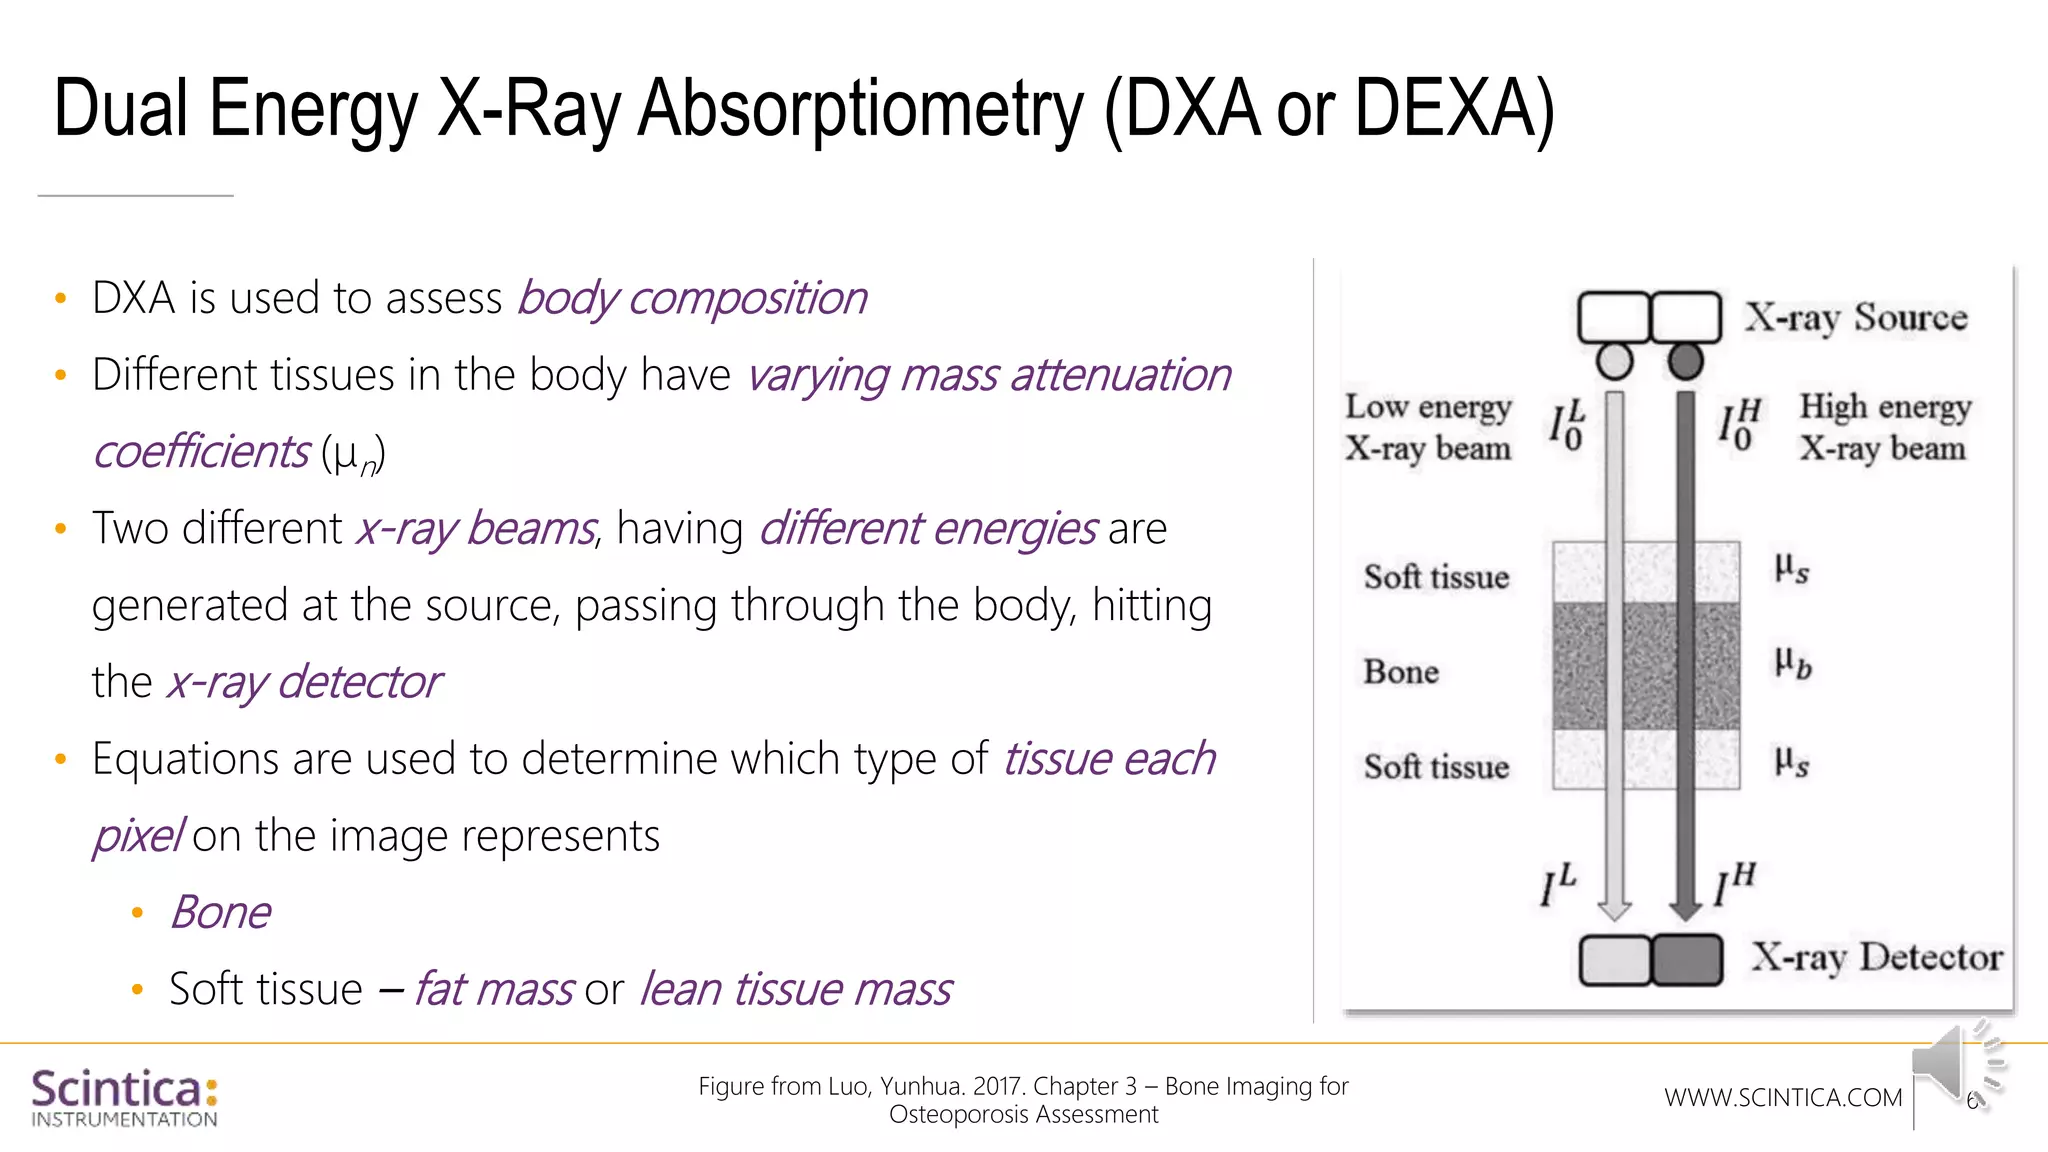
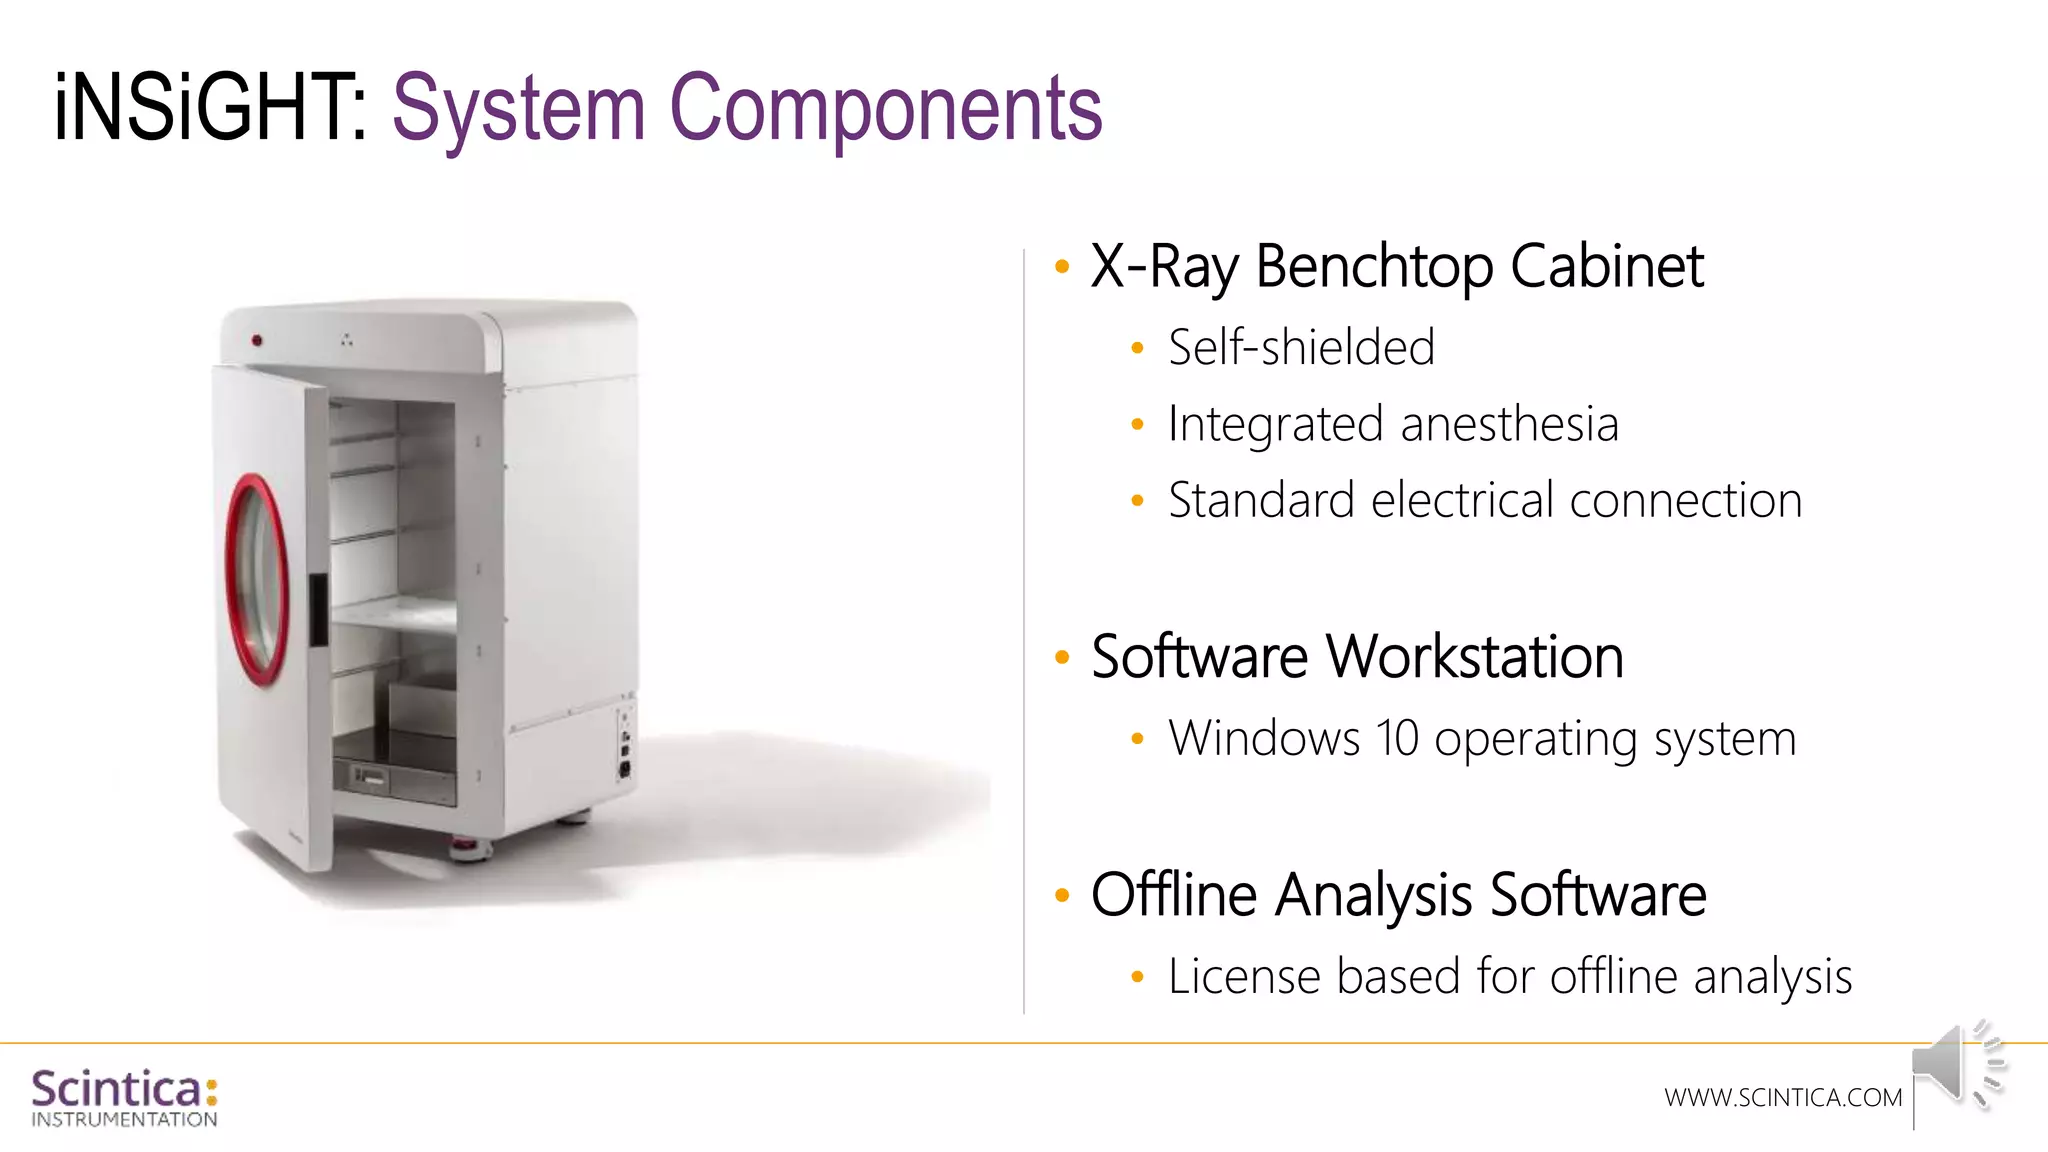
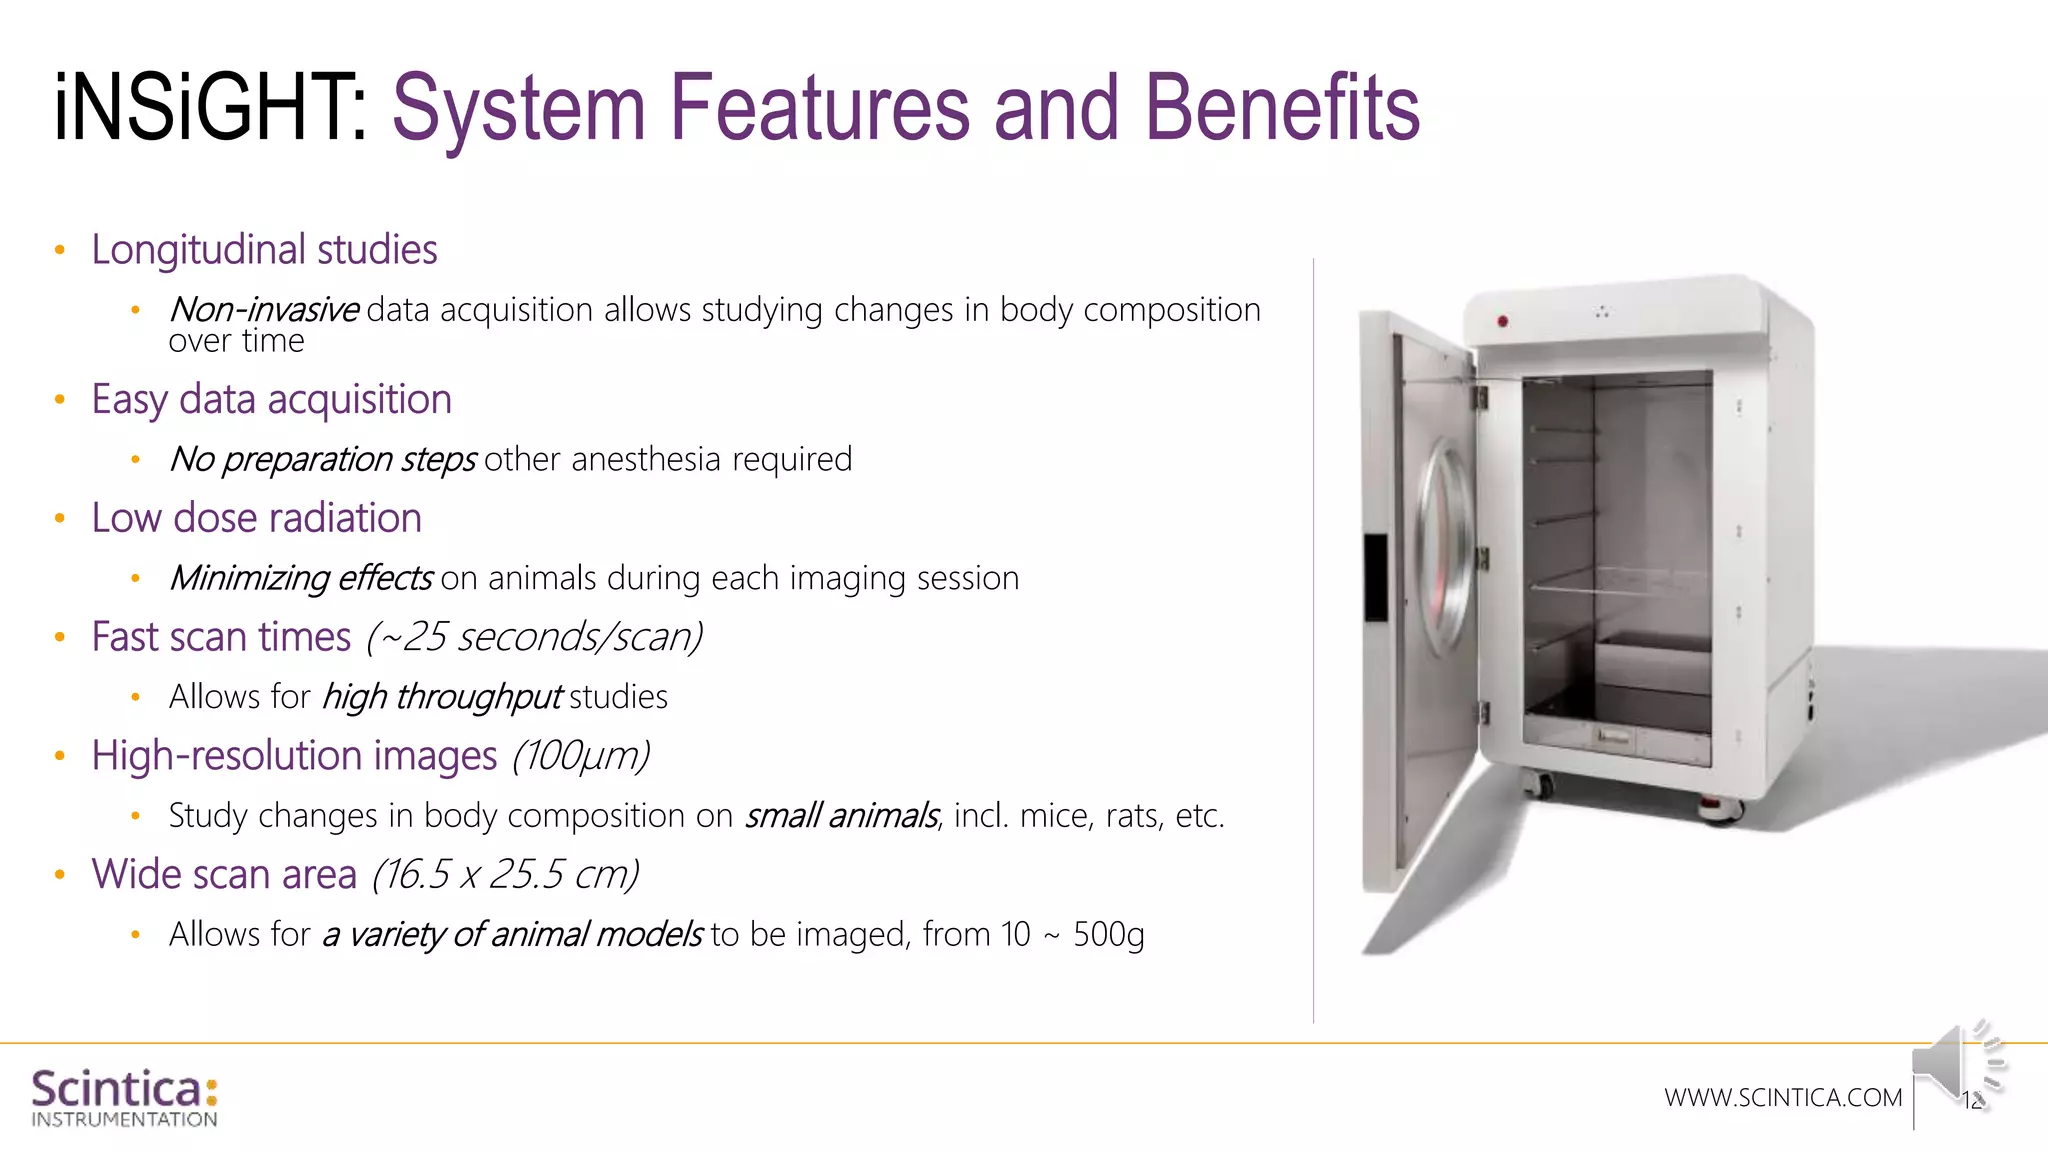
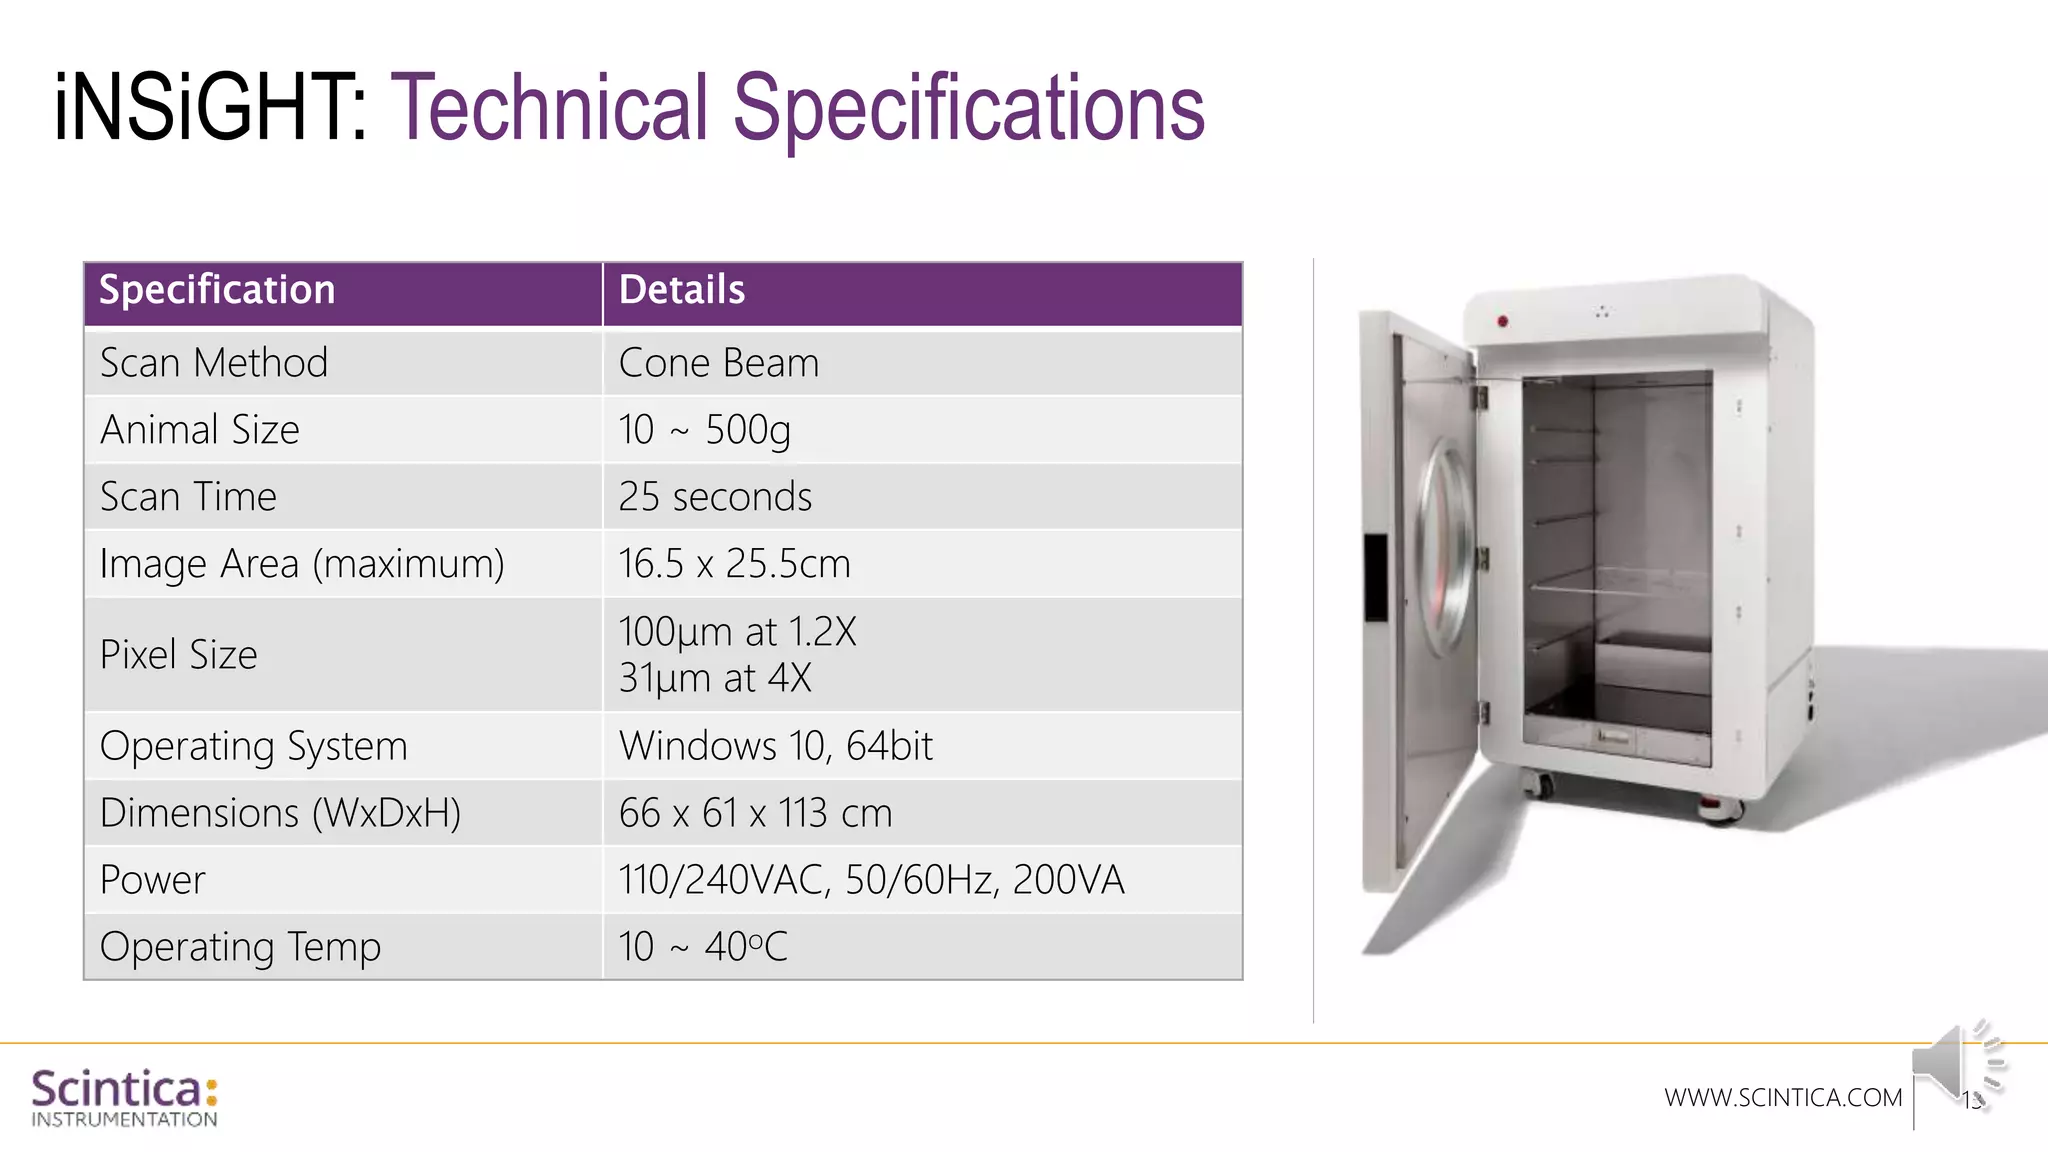
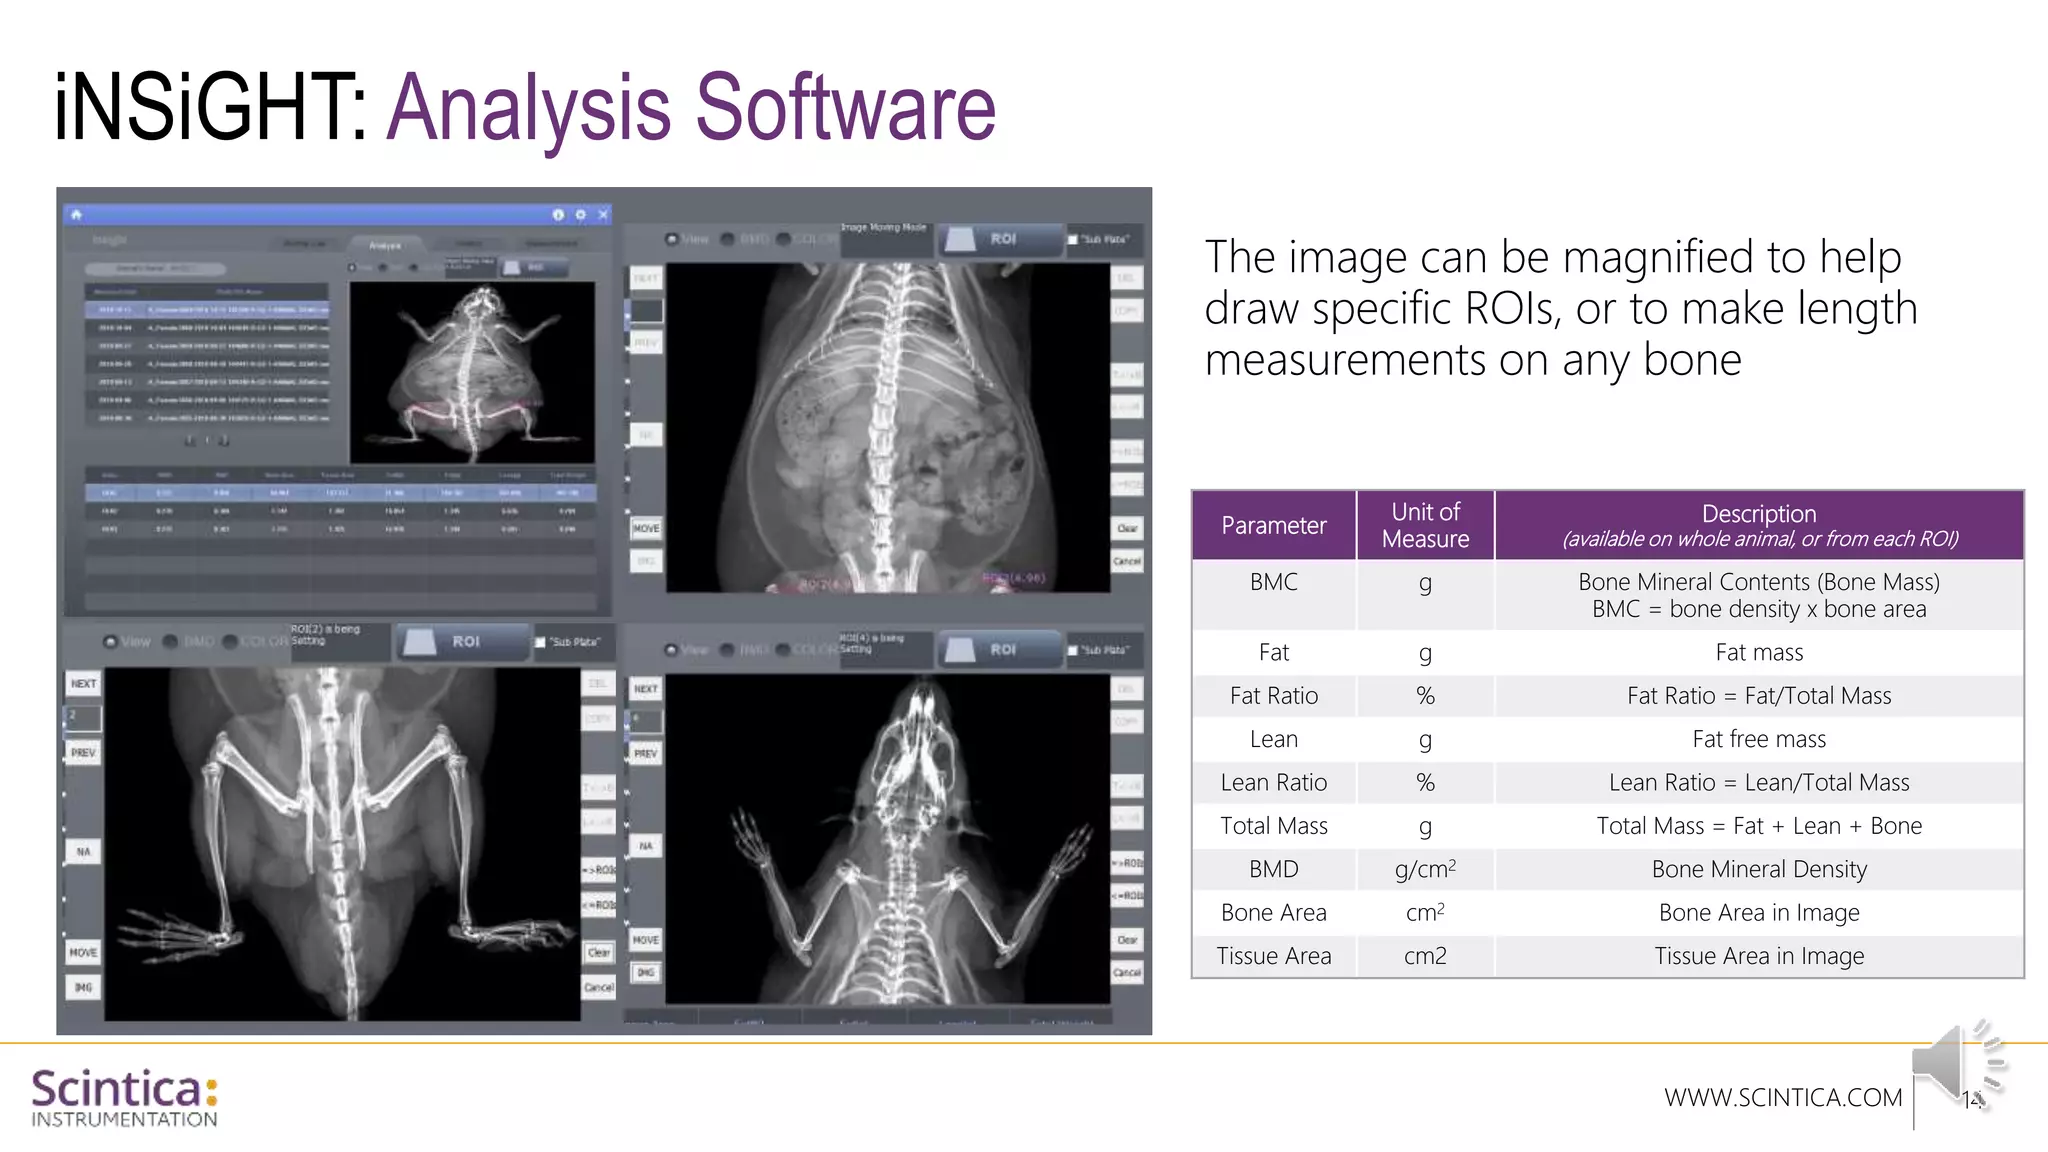
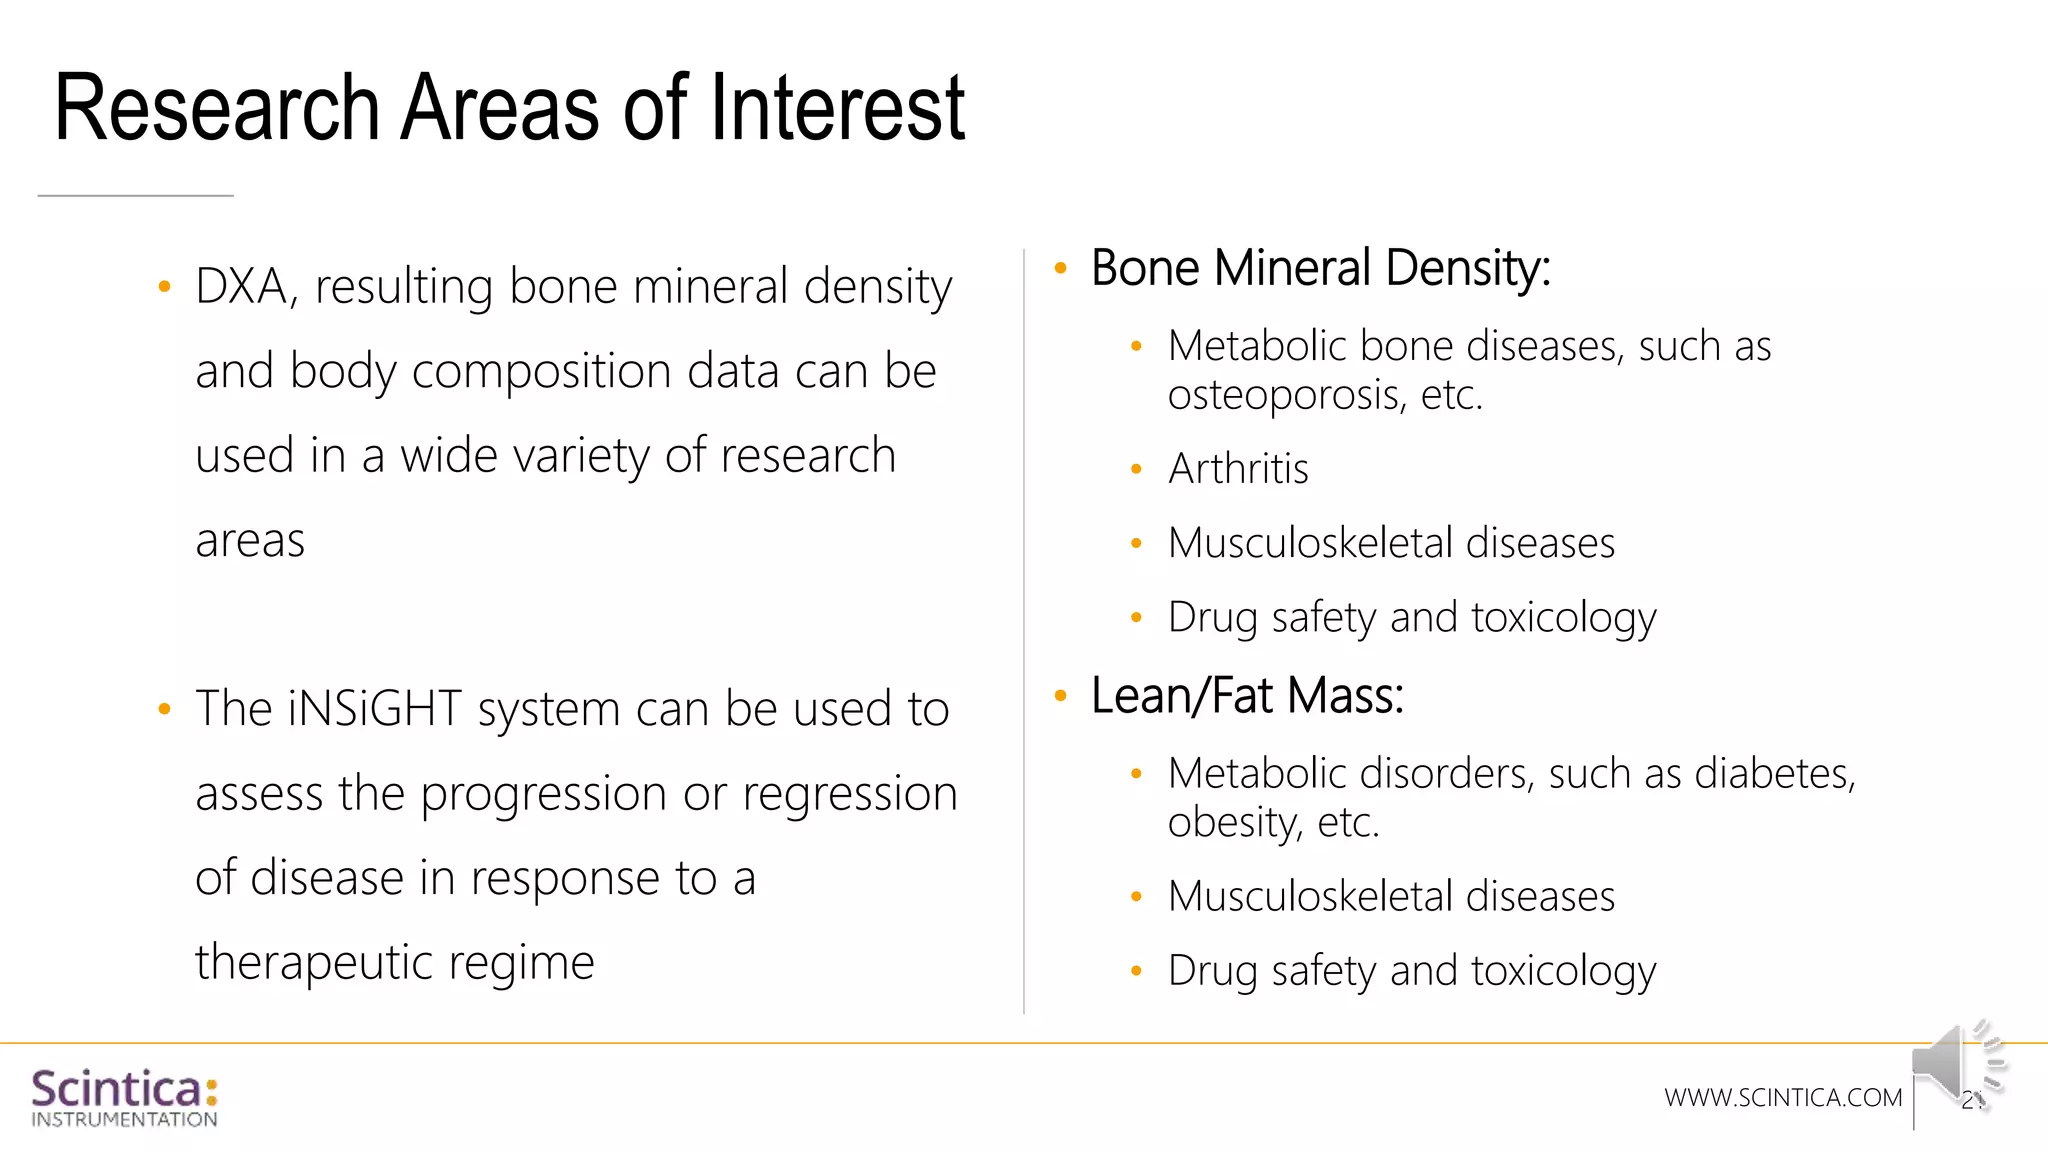
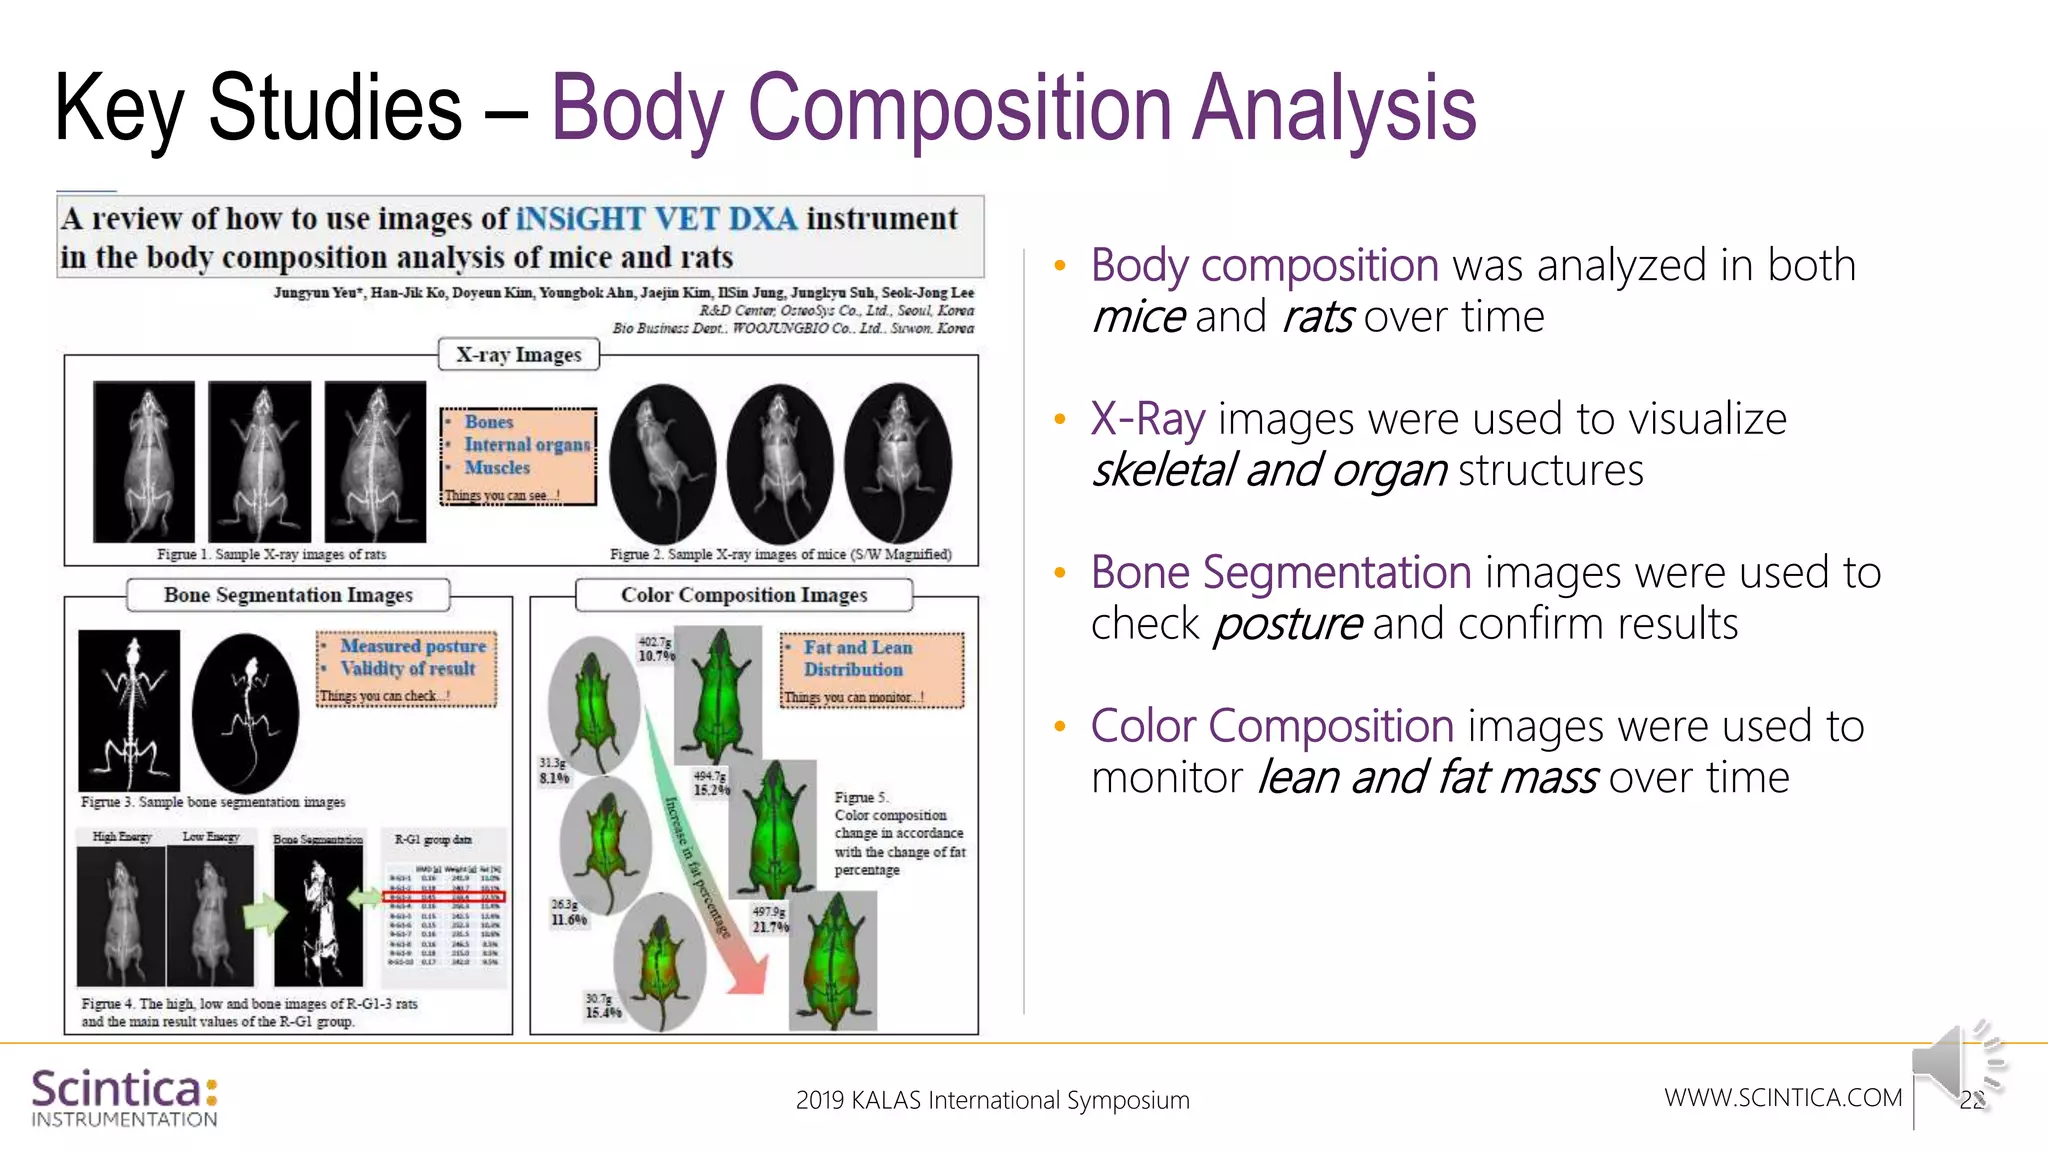


The document provides an overview of the Insight Preclinical DXA system designed for in vivo body composition and bone mineral density measurement, detailing how DXA works and its advantages over other techniques. It outlines the system components, features, measurement parameters, and key research applications, particularly in studying metabolic bone diseases and obesity. Additionally, it includes findings from various studies demonstrating the system's effectiveness and accuracy in body composition analysis.


