(June 9, 2021) Live Demonstration: iNSiGHT, DXA Imaging System For Body Composition Analysis
•Download as PPTX, PDF•
0 likes•113 views

Watch our hands-on demonstration of the iNSiGHT, DXA imaging system for body composition analysis. During this live demonstration, we showed the full imaging and measurement capabilities of the iNSiGHT system. These measurements included: Bone mineral density in g/cm2 Bone mineral content in g Bone area in cm2 Tissue area in cm2 Fat tissue as percentage and weight in % and g Lean tissue as percentage and weight in % and g Total weight g Additionally, specific bone length measurements can be drawn on the 2D x-ray image

Recommended
Recommended
More Related Content
What's hot
What's hot (14)
Similar to (June 9, 2021) Live Demonstration: iNSiGHT, DXA Imaging System For Body Composition Analysis
Similar to (June 9, 2021) Live Demonstration: iNSiGHT, DXA Imaging System For Body Composition Analysis (20)
More from Scintica Instrumentation
More from Scintica Instrumentation (20)
Recently uploaded
Recently uploaded (20)
(June 9, 2021) Live Demonstration: iNSiGHT, DXA Imaging System For Body Composition Analysis
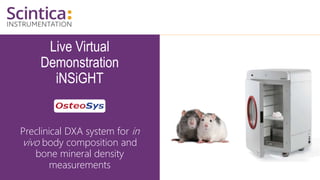
- 1. Live Virtual Demonstration iNSiGHT Preclinical DXA system for in vivo body composition and bone mineral density measurements
- 2. Tonya Coulthard, MSc Manager, Imaging Division Scintica Instrumentation Val Fajardo, PhD Canadian Research Chair – Tissue Remodeling and Plasticity Assistant Professor Brock University
- 3. WWW.SCINTICA.COM Topics of Discussion • What is DXA and How Does it Work • iNSiGHT System Overview • Live Virtual Demonstration – *animal change normal mice* • Acquiring Live Data, and data analysis review • Previously acquired data – discussion with Dr. Val Fajardo • Q&A Session 3
- 4. WWW.SCINTICA.COM What is DXA and How Does it Work • Dual Energy X-Ray Absorptiometry • Acquired Images • Available Measurements • Comparison to Other Techniques 4
- 5. WWW.SCINTICA.COM Dual Energy X-Ray Absorptiometry (DXA or DEXA) • DXA is used to assess body composition • Different tissues in the body have varying mass attenuation coefficients (µn) • Two different x-ray beams, having different energies are generated at the source, passing through the body, hitting the x-ray detector • Equations are used to determine which type of tissue each pixel on the image represents • Bone • Soft tissue – fat mass or lean tissue mass Figure from Luo, Yunhua. 2017. Chapter 3 – Bone Imaging for Osteoporosis Assessment 5
- 6. WWW.SCINTICA.COM Acquired Images Images acquired using the iNSiGHT DXA system 6 X-Ray Attenuation Image Bone Mineral Density Image Color Image Fat (Orange) and Lean (Green) Mass
- 7. WWW.SCINTICA.COM Available Measurements 7 Parameter Unit of Measure Description (available on whole animal, or from each ROI) BMC g Bone Mineral Contents (Bone Mass) BMC = bone density x bone area Fat g Fat mass Fat Ratio % Fat Ratio = Fat/Total Mass Lean g Fat free mass Lean Ratio % Lean Ratio = Lean/Total Mass Total Mass g Total Mass = Fat + Lean + Bone BMD g/cm2 Bone Mineral Density Bone Area cm2 Bone Area in Image Tissue Area cm2 Tissue Area in Image Images acquired using the iNSiGHT DXA system
- 8. WWW.SCINTICA.COM iNSiGHT System Overview • System Components • System Features and Benefits • Technical Specification • Analysis Software 8
- 9. WWW.SCINTICA.COM iNSiGHT: System Components • X-Ray Benchtop Cabinet • Self-shielded • Integrated anesthesia • Standard electrical connection • Software Workstation • Windows 10 operating system • Offline Analysis Software • License based for offline analysis
- 10. WWW.SCINTICA.COM iNSiGHT: System Features and Benefits 10 • Longitudinal studies • Non-invasive data acquisition allows studying changes in body composition over time • Easy data acquisition • No preparation steps other anesthesia required • Low dose radiation • Minimizing effects on animals during each imaging session • Fast scan times (~25 seconds/scan) • Allows for high throughput studies • High-resolution images (100µm) • Study changes in body composition on small animals, incl. mice, rats, etc. • Wide scan area (16.5 x 25.5 cm) • Allows for a variety of animal models to be imaged, from 10 ~ 500g
- 11. Hands On Demonstration of iNSiGHT DXA System
- 12. iNsiGHT Small Animal DXA Validation and Application Val Fajardo, June 9, 2021
- 13. Outline Validation CVs: repeated measures with and without repositioning the mouse or rat Application Low-dose lithium supplementation: an update from last webinar (May 19th, longitudinal body composition analyses) DBA/2J mdx mice body composition analyses (model of Duchenne muscular dystrophy) Ex vivo murine femur bone analyses (Collaboration with NASA) 13
- 14. Validation: CVs of female mouse 14
- 15. Validation: CVs of male mouse 15
- 16. Validation: CVs of male repositioned mouse Male mouse, measured 6x where the mouse was repositioned before each scan 16 Number of values Mean Std. Deviation Std. Error of Mean Coefficient of variation BMD (g/cm2) 6 0.06550 0.001049 0.0004282 1.601% BMC (g) 6 0.4985 0.01540 0.006286 3.089% Bone Area (cm2) 6 7.624 0.1570 0.06411 2.060% Tissue Area (cm2) 6 18.37 0.3475 0.1419 1.891% Fat (%) 6 15.60 0.1285 0.05245 0.8234% Fat (g) 6 4.630 0.05465 0.02231 1.180% Lean % 6 83.00 0.1595 0.06512 0.1922% Lean(g) 6 25.04 0.1133 0.04626 0.4525% Total Weight(g) 6 30.17 0.1593 0.06501 0.5279%
- 17. Validation: CVs of male rat (3-4 months old) 17 Non-repositioned CV RepositionedCV Number of values Mean Std. Deviation Std. Error of Mean Coefficient of variation BMD (g/cm2) 7 0.1799 0.0003780 0.0001429 0.2101% BMC (g) 7 5.463 0.01793 0.006777 0.3282% Bone Area (cm2) 7 30.36 0.1376 0.05199 0.4531% Tissue Area (cm2) 7 108.2 0.2582 0.09759 0.2386% Fat (%) 7 11.62 0.1153 0.04360 0.9929% Fat (g) 7 33.53 0.3294 0.1245 0.9825% Lean % 7 86.74 0.1110 0.04197 0.1280% Lean(g) 7 255.1 0.3781 0.1429 0.1482% Total Weight(g) 7 294.1 0.1301 0.04916 0.04423% Number of values Mean Std. Deviation Std. Error of Mean Coefficient of variation BMD (g/cm2) 7 0.1769 0.002035 0.0007693 1.151% BMC (g) 7 5.340 0.07211 0.02725 1.350% Bone Area (cm2) 7 30.18 0.1727 0.06529 0.5723% Tissue Area (cm2) 7 107.4 0.6508 0.2460 0.6062% Fat (%) 7 11.61 0.1119 0.04228 0.9634% Fat (g) 7 33.71 0.2540 0.09599 0.7535% Lean % 7 86.79 0.1206 0.04559 0.1390% Lean(g) 7 256.6 1.251 0.4728 0.4875% Total Weight(g) 7 295.6 1.118 0.4226 0.3782%
- 18. Application: low-dose lithium and body composition Project in collaboration with Dr. Rebecca MacPherson (Associate Professor, Dept. Health Sciences) Stimulate energy expenditure to combat combat obesity 18
- 19. Low-dose lithium ↑ energy expenditure 10 mg/kg/day (serum concentration of 0.02 mM) for 6-12 weeks Dose shown to reduce high-fat diet induced weight gain (Choi et al., 2010Vascular Pharmacology, 53: 264-272) 19 D ark Light D aily 0 1000 2000 3000 VO 2 (ml/kg body mass/min) * ** ** Control LiCl A 8 : 0 0 1 0 : 0 0 1 2 : 0 0 1 4 : 0 0 1 6 : 0 0 1 8 : 0 0 2 0 : 0 0 2 2 : 0 0 0 : 0 0 2 : 0 0 4 : 0 0 6 : 0 0 1500 2000 2500 3000 3500 4000 VO 2 (ml/kg body mass/min) Control LiCl Light Dark B Geromella et al., unpublished data
- 20. Does this translate to a change in body composition? 20 Geromella et al., unpublished data *non-invasive longitudinal studies 4 6 1 0 0 5 10 15 20 Weeks Fat (%) Time, p = 0.01 Treatment, p = 0.03 4 6 1 0 60 70 80 90 100 Weeks Lean (%) Time, p = 0.008 Treatment, p = 0.04 Control LiCl (0.02)
- 21. Energy expenditure relative to FFM Still elevated even after normalizing to FFM. What are the cellular mechanisms? 21 Geromella et al., unpublished data D a r k L i g h t D a i l y 0 1000 2000 3000 4000 VO 2 (ml/kg fat-free mass/min) * ** * Control LiCl A 8 : 0 0 1 0 : 0 0 1 2 : 0 0 1 4 : 0 0 1 6 : 0 0 1 8 : 0 0 2 0 : 0 0 2 2 : 0 0 0 : 0 0 2 : 0 0 4 : 0 0 6 : 0 0 2000 2500 3000 3500 4000 4500 VO 2 (ml/kg fat-free mass/min) Control LiCl Light Dark B
- 22. Duchenne muscular dystrophy Duchenne muscular dystrophy (DMD): a severe muscle wasting disease caused by the absence of a structural protein named dystrophin. No cure: studying novel interventions in the mdx mouse model is an important first step in discovering novel therapeutic strategies. D2 mdx mouse is a more severe and perhaps more clinically relevant mouse model vs the traditionalC57 mdx mouse model. We will use the iNSIGHT small animal DXA to track body composition longitudinally with without an intervention. 22
- 23. D2 mdx mouse body composition Lower body mass vs. wild-type Lower lean mass vs wild-type Lower fat mass vs wild-type Hypermetabolic/catabolic? 23 Cleverdon, Silvera, et al., unpublished data
- 24. Muscle and bone are connected Often muscle wasting is associated with bone loss… BMD and BMC are important outcome measures for us: Most common treatment for DMD (i.e., corticosteroids osteoporosis) 24 Silvera, et al., unpublished data
- 25. Spaceflight – if you don’t use it you lose it Without gravity, the loss of mechanical load leads to loss of bone and muscle mass. Need effective countermeasures for long-duration spaceflight (i.e. Mars). In collaboration with NASA, Dr. WendyWard (Professor, Dept. Kinesiology) and I are targeting glycogen synthase kinase 3. 25
- 26. NASA samples - femur bones from male mice flown in space ~30 days Ground control – housed on Earth in NASA flight cages Vivarium control – housed on Earth in standard lab cages Flight – housed aboard the ISS in NASA flight cages ↓ BMC ↓ BMD Ex vivo bone CV: BMC = 3.2%; BMD = 1.8% Is glycogen synthase kinase 3 involved in the bone and muscle 26 Silvera, et al., unpublished data
- 28. WWW.SCINTICA.COM Q&A Session WWW.SCINTICA.COM INFO@SCINTICA.COM Please enter your questions in the Q&A section Tonya Coulthard, MSc Manager, Imaging Division, Scintica Val Fajardo, PhD Canadian Research Chair – Tissue Remodeling and Plasticity Assistant Professor, Brock University
- 29. Globally linking scientists with precision tools for research through expertise in science, engineering and support