Downloaded 15 times

![2
+++++++++++++++++++++++++++++++++++++++++++++++++++++++
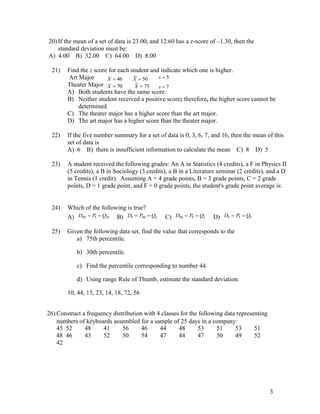
11) The following data gives the number of hours that a few employees at the GM factory
worked last week. 17, 38, 27, 14, 18, 34, 16, 42, 28, 24, 40, 20, 23, 31, 37, 21, 30, 25.
a) Find the mean
b) Find the Mode.
c) Find the Median.
d) Find the Midrange.
e) Find the Range.
f) Find the Variance
g) Find the Standard Deviation.
h) Find the Interquartile Range (IQR).
+++++++++++++++++++++++++++++++++++++++++++++++++++++++++++
12) I Q scores have a mean of 100 and a standard deviation of 15.
a) Find the Coefficient of Variance.
b) Use the Range Rule of Thumb to estimate the minimum and maximum ''Usual'' I
Q scores.
c) Using Chebyshev's Theorem, find what is the least percentage of those who will
have an I Q score of 70 to 130.
d) Using the Empirical Rule find the percentage of those who will have an I Q
score of 70 to 130.
13) Define a Parameter and a Statistic.
14) Define Random Sample and Simple Random Sample.
15) Define the following types of sampling: Systematic, Convenience, Stratified and
Cluster.
16) What are different Levels of Measurement of Data? Give examples.
17) What’s the difference between an Observational Study and an Experiment? Give
examples.
18) Given the following set of data: 32, 19, 14, 7, 15, 3, 4, 5, 9, 16, 15, 16, 19, , 50
a) Rank the data from smallest to largest.
b) Prepare a box-and-whisker plot. [Box plot]
c) Does this data set contain any outliers? [Make sure to show the lower and the upper
fences on your graph]
d) Are the data symmetric or skewed? [If skewed, are they skewed left or right?]
19) Draw the box-and-whisker plot for the following data set:
77, 79, 80, 86, 87, 87, 94, 99](https://image.slidesharecdn.com/practivetest1-190811093029/85/Practive-test-1-2-320.jpg)

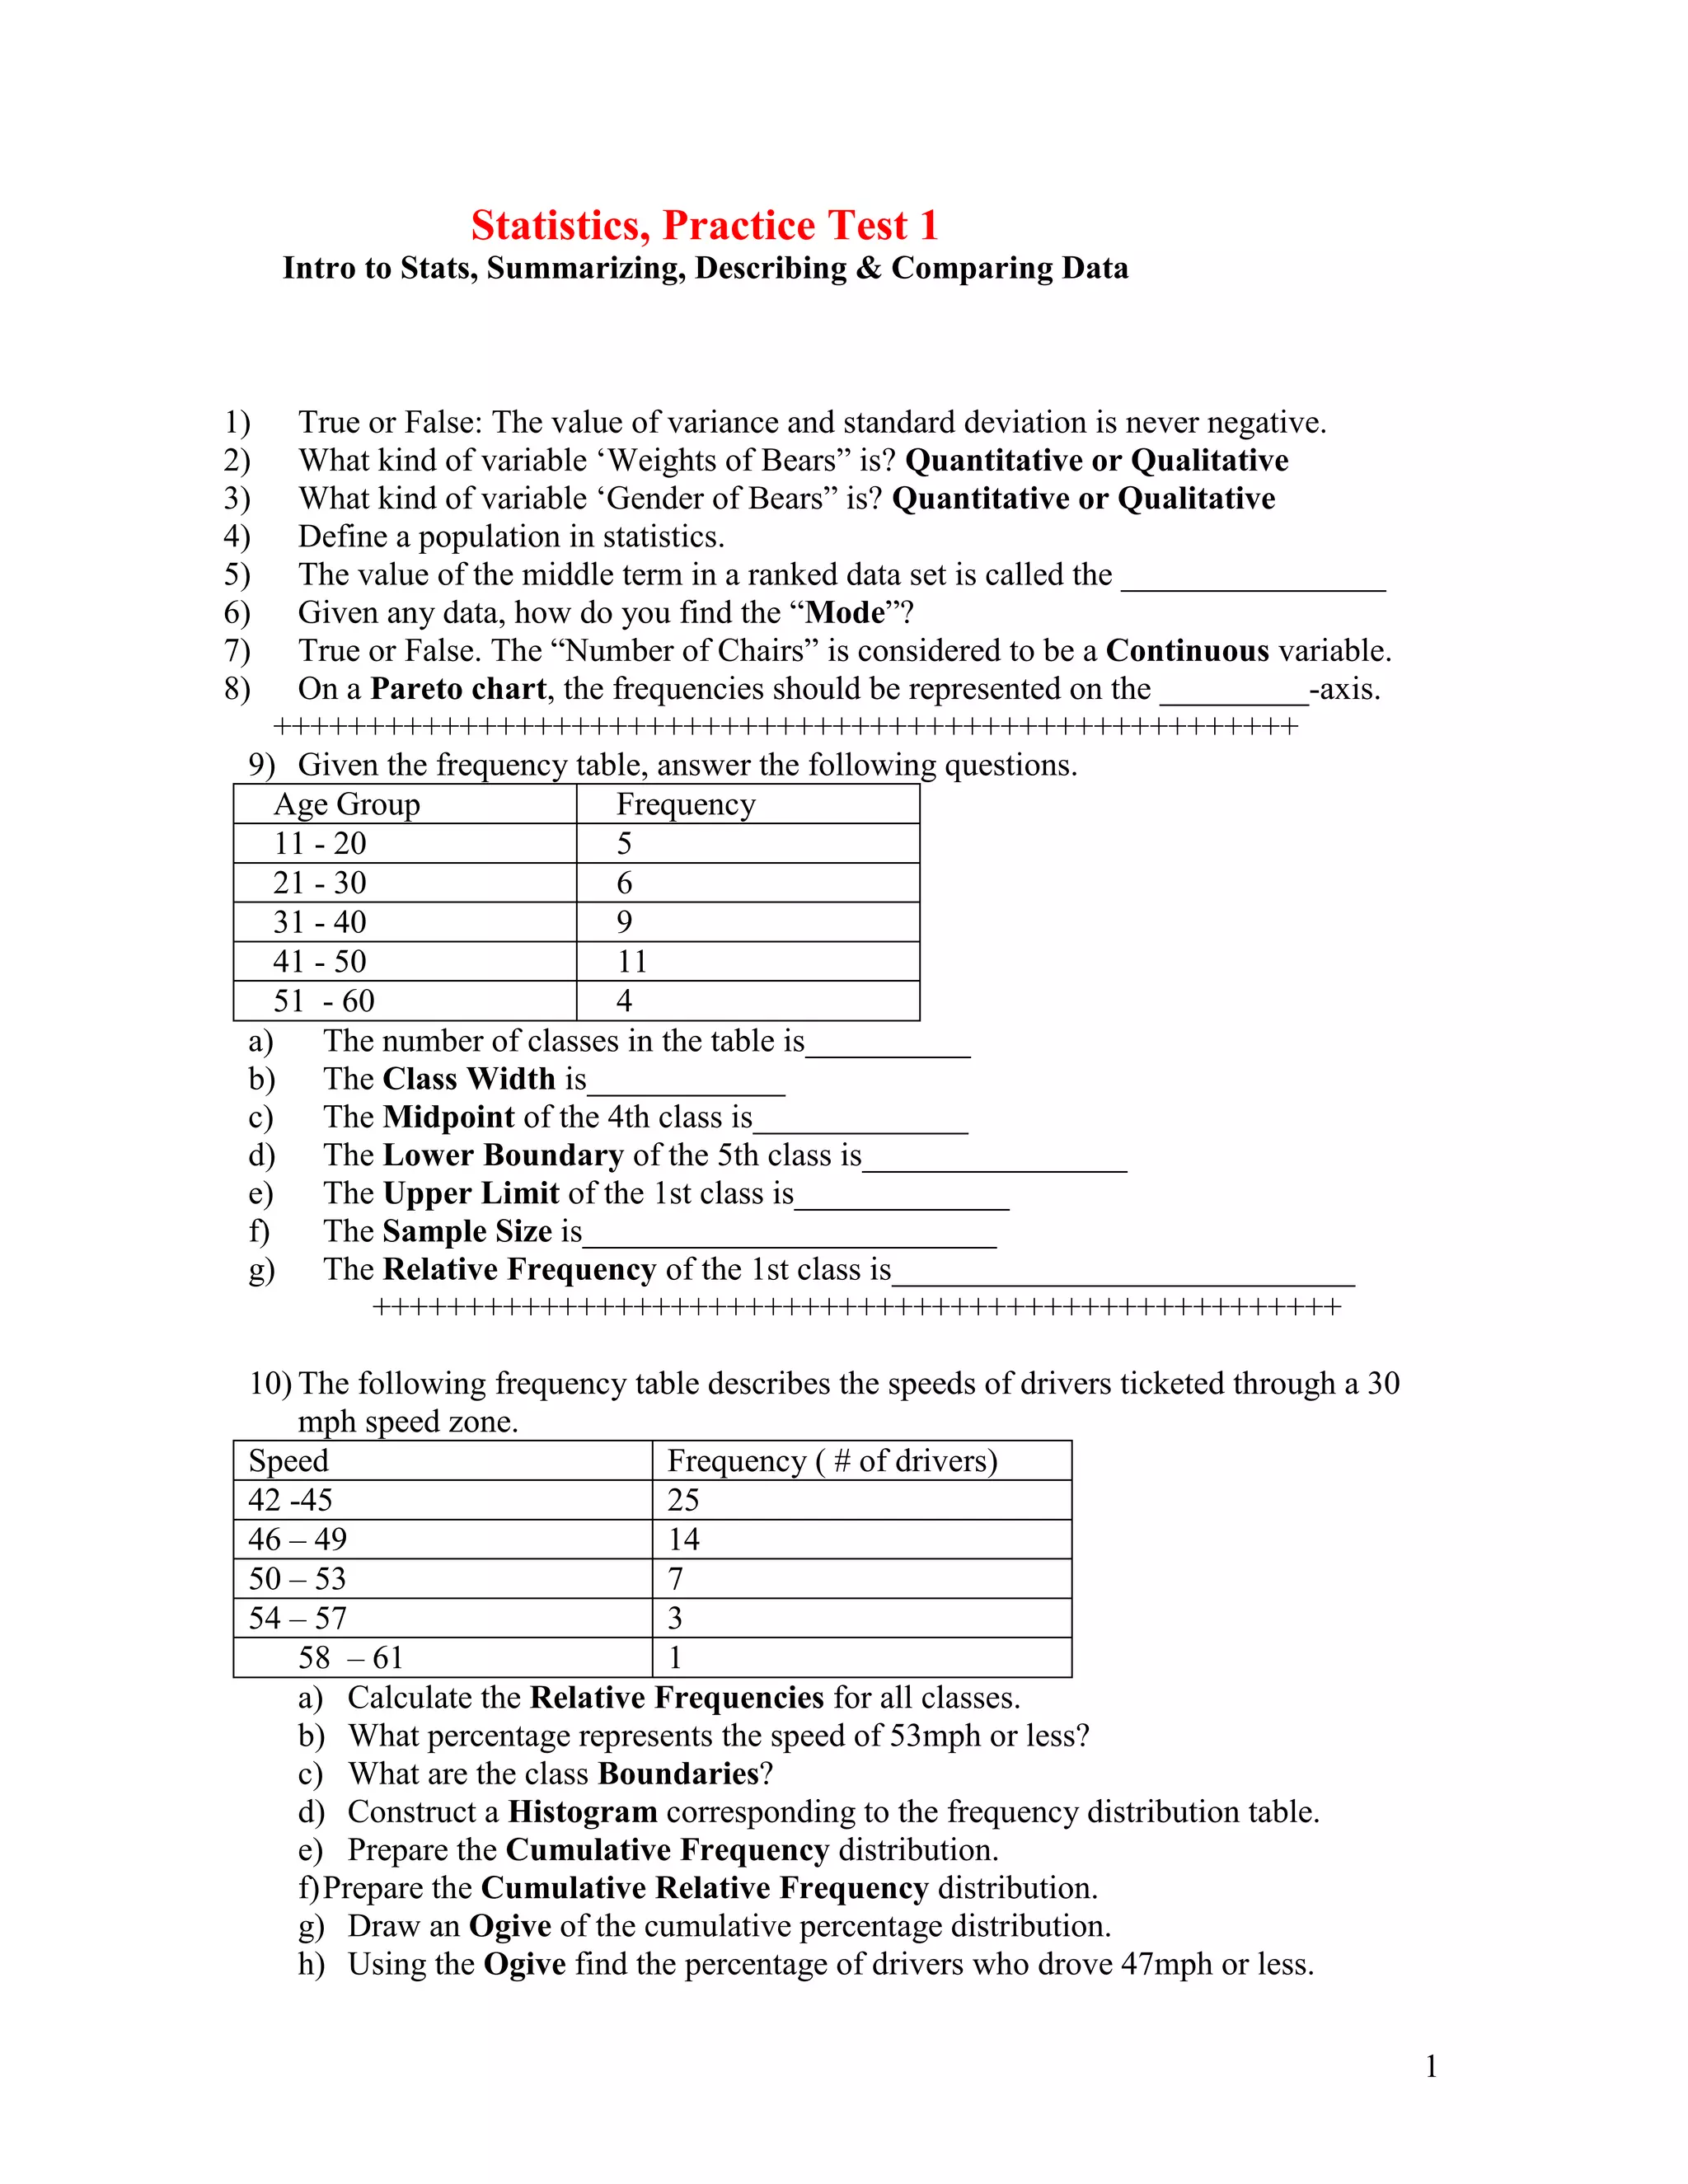
This document contains 26 multiple choice questions covering a variety of statistical concepts. These include questions about variables, measures of central tendency, percentiles, standard deviation, sampling, levels of measurement, and experimental design. The questions require calculating statistics like mean, median, mode, and standard deviation from data sets, interpreting graphs like histograms and box plots, and identifying properties of and relationships between statistical concepts.


![Prac ex'cises 3[1].5](https://cdn.slidesharecdn.com/ss_thumbnails/pracexcises31-5-130213071026-phpapp01-thumbnail.jpg?width=640&height=640&fit=bounds)


![Prac excises 3[1].5](https://cdn.slidesharecdn.com/ss_thumbnails/pracexcises31-150331131154-conversion-gate01-thumbnail.jpg?width=640&height=640&fit=bounds)


