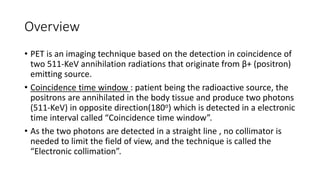
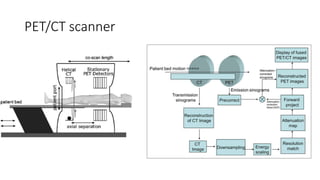
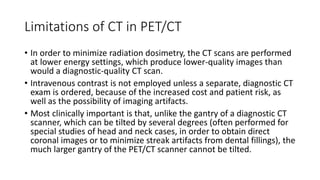
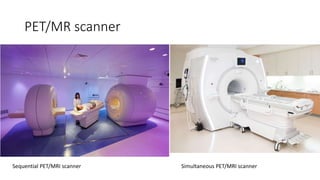
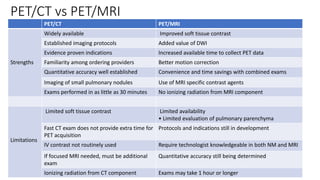
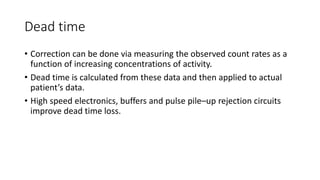
SlideShare a Scribd company logo
Positron Emission Tomography
(PET)
Dr. Pradeep Chaurasia
Overview
• PET is an imaging technique based on the detection in coincidence of
two 511-KeV annihilation radiations that originate from β+ (positron)
emitting source.
• Coincidence time window : patient being the radioactive source, the
positrons are annihilated in the body tissue and produce two photons
(511-KeV) in opposite direction(180o) which is detected in a electronic
time interval called “Coincidence time window”.
• As the two photons are detected in a straight line , no collimator is
needed to limit the field of view, and the technique is called the
“Electronic collimation”.
PET Radiopharmaceuticals
• Only 18F, 13N, 11C, 82Rb are used commonly,
Radiopharmaceuticals and its uses
RP Used for
82Rb RbCl and 13N ammonia Myocardial perfusion imaging
18F fluorodeoxyglucose (FDG) Metabolic imaging of heart and brain
18F fluorodopa Parkinson disease and Neuroendocrine tumors
18F fluorothymidine Tumor imaging
18F fluoromisonidazole (FMISO) and 18F-HX4 Hypoxic tumor imaging
11C choline Colon cancer
18F fluorbetapir Amyloid plaque imaging in Alzheimer disease
Characteristics of PET radionuclides
Radionuclides Half-life Mode of decay(%) MeV
11C 20.4 min. β+(100) 0.970
13N 10 min. β+(100) 1.2
15O 2 min. β+(100) 1.74
18F 110 min. β+(97)
EC (3)
0.64
68Ga 68 min. β+(89)
EC (11)
1.9
82Rb 75 s β+(95)
EC (5)
3.15
124I 4.2 d β+(23)
EC (77)
2.14
Detectors in PET scanners
• Most commercial PET manufacturers use BGO, LSO and LYSO.
NaI(Tl) BaF2 BGO LSO GSO LYSO LaBr3 LFS LuAP LuI3
Effective atomic no. (Z) 51 54 74 66 59 60 47 63 65 60
Linear attenuation
coeff. (cm
−1
)
0.34 0.44 0.92 0.87 0.62 0.86 0.47 0.82 0.9 ~0.56
Density (gm cm
−3
) 3.67 4.89 7.13 7.4 6.7 7.1 5.3 7.3 8.34 5.6
Index of refraction 1.85 – 2.15 1.82 1.85 1.81 1.88 1.78 1.95
Light yield (% NaI(Tl)) 100 5 15 75 30 80 160 77 16 190
Peak wavelength (nm) 410 220 480 420 430 420 370 430 365 470
Decay constant (ns) 230 0.8 300 40 65 41 25 35 18 30
Hygroscopic Yes Slight No No No
Fragile
No No No No Yes
• The role of the detector is to stop an emitted gamma ray and produce a signal
that the downstream electronics can utilize.
• Ideal detector : would have
1. high stopping power (high probability that a 511 keV gamma ray will be
totally absorbed by the detector),
2. have high spatial resolution (ability to determine the interaction location of
the gamma ray in the detector to a small spatial volume),
3. have very good energy resolution (to reject scattered events),
4. have very high timing resolution and
5. be inexpensive to produce.
• However no ideal detector exists in the current time period.
• LSO and LYSO have shorter scintillation decay time and higher light output
than BGO
• but poor energy resolution due to the intrinsic property of a naturally
occurring radioisotope 176-Lu (2.6% abundance) with half life of 3.8×10⁸
years.
• The radionuclide decays by β- decay and x-rays of 88-400 KeV.
• As the activity is low enough , it does not cause a major problem in PET
imaging.
Semiconductor detector
• Currently not used in clinical PET imaging due to poor detection
efficiency.
• Ge(Li), Si(Li), Cadmium-zinc-tellurium(CZT) are some examples.
• These detectors do not require any PMT for amplification of pulses as
some electron multiplication is done via high voltage application.
• CZT has high energy resolution (~5%) and low noise in images.
PMT’s and PHA’s
• PMT convert light photons arising from the interaction of charged γ-
rays in detectors to pulses, which are used to determine the X-,Y-
positions of the two detectors that detect the two 511 KeV photons.
• PHA is used to check if the pulse height is within acceptable range
(350-650 KeV for 511 KeV annihilation photopeak).
PET scanner design
• Consists of multiple block detectors each connected to a PMT
arranged in a circular, hexagonal or orthogonal rings.
• Each block detector is typically 3 cm deep and grooved into 6×8, 7 ×8
or 8 ×8 elements (small detector, size 3-6.5mm, Spatial resolution) of
varying depths by partial cuts through a saw at the front surface.
• Deepest cut is at the edge of a block .
• The cuts are filled with opaque reflective materials to prevent
spillover of light between elements.
Block detector schematic
Coincidence timing window/ Timing
resolution
• Ideally the two annihilation photons should be detected at the same time
but in reality one photon may arrive earlier at one detector.
• This uncertainty in detection time is called as timing resolution.
• Typically it is set at 6-20 ns in conventional PET scanner.
• Coincident events: any event occurring within the CTW is counted as
coincidence.
• Angle of acceptance: Each detector element is connected by a coincidence
circuit with a time window to a set of opposite detector elements.
Depending on the number of opposite detectors connected, each detector
element has a number of projections called as angle of acceptance.
PET/CT scanner
Advantages of PET/CT scanner
1. Overall accuracy of diagnosis increases by 20-25% than either modality
alone.
2. Overall decreased scan time.
3. Better localization of activity to normal vs abnormal structures.
4. Better identification of inflammatory lesions.
5. CT visualization of PET-negative lesions (especially bone lesions).
6. Discovery of serendipitous abnormalities: The “serendipity factor” of PET
is very high, meaning that unsuspected malignancies are detected on PET
studies performed for assessment of other malignancies.
7. Confirmation of unusual or abnormal sites, and improved localization for
biopsy or radiotherapy.
Disadvantages of PET/CT over PET
Claustrophobia
Radiation dosimetry: In general, the radiation from a typical PET scan is
equivalent to about 3 to 5 times as much as a person would receive in 1 year
from the naturally occurring “background” radiation exposure from our
surroundings and from cosmic rays penetrating the atmosphere; depending
on the technique used, radiation from a PET/CT often can be 5 to 10 times
greater than annual background radiation.
Disadvantages of PET/CT over PET
Technical difficulties: because the scanner comprises two very complicated
machines.
CT-based attenuation correction of emission PET images limits some of the
techniques that can be used. For example, the use of intravenous contrast for
the CT scan: can cause artifacts in the reconstruction of the PET images. This is
because the iodine component of intravenous contrast absorbs the lower-
energy CT x-rays much more efficiently than the high-energy, 511 keV photons
emitted during PET imaging.This leads to an “overadjustment” for photon
attenuation in the regions where dense contrast is present, resulting in an
overestimation of the activity level at these sites when the PET images are
reconstructed.
Disadvantages of PET/CT over PET
Motion artifacts can be amplified with PET/CT. A specific and important facet of this is
respiratory motion. As a general rule, the CT images are best performed at end-tidal
respiration, since that is close to the position that the diaphragm occupies for about 75% of
the time during normal tidal breathing.
Misregistration: For example, in one recent paper, the accuracy of staging lung cancer was
actually lower with PET/CT than with PET alone, even though the confidence of the correct
interpretations was higher.
Limitations of CT in PET/CT
• In order to minimize radiation dosimetry, the CT scans are performed
at lower energy settings, which produce lower-quality images than
would a diagnostic-quality CT scan.
• Intravenous contrast is not employed unless a separate, diagnostic CT
exam is ordered, because of the increased cost and patient risk, as
well as the possibility of imaging artifacts.
• Most clinically important is that, unlike the gantry of a diagnostic CT
scanner, which can be tilted by several degrees (often performed for
special studies of head and neck cases, in order to obtain direct
coronal images or to minimize streak artifacts from dental fillings), the
much larger gantry of the PET/CT scanner cannot be tilted.
PET/MR scanner
Sequential PET/MRI scanner Simultaneous PET/MRI scanner
PET/MR
• Hybrid imaging technology which combines molecular and functional
information of PET with the soft tissue contrast of MRI.
• FDA approval given in June of 2011.
• Types :
a. Sequential
b. Simultaneous
PET/CT vs PET/MRI
PET/CT PET/MRI
Strengths
Widely available Improved soft tissue contrast
Established imaging protocols Added value of DWI
Evidence proven indications Increased available time to collect PET data
Familiarity among ordering providers Better motion correction
Quantitative accuracy well established Convenience and time savings with combined exams
Imaging of small pulmonary nodules Use of MRI specific contrast agents
Exams performed in as little as 30 minutes No ionizing radiation from MRI component
Limitations
Limited soft tissue contrast Limited availability
• Limited evaluation of pulmonary parenchyma
Fast CT exam does not provide extra time for
PET acquisition
Protocols and indications still in development
IV contrast not routinely used Require technologist knowledgeable in both NM and MRI
If focused MRI needed, must be additional
exam
Quantitative accuracy still being determined
Ionizing radiation from CT component Exams may take 1 hour or longer
Principles of MR imaging
• Based on the magnetic property of atomic nuclei.
• Nuclei containing odd number of protons or neutrons possess a net
magnetic moment with magnitude and direction and behave like
magnets. E.g. H+ proton in the form of water in the body.
• Free protons spin randomly and their magnetic moments cancel each
other, with a residual momentum due to an unpaired proton, if any.
• When an external magnetic field, B0, is applied, the protons orient
themselves in either parallel or antiparallel direction to the field B0.
• The number of parallel protons are slightly larger than antiparallel ones,
thus creating a net magnetic moment in the direction of B0.
• The energy difference between the two groups is ΔE.
• Normally a greater spin exists in parallel direction which increases with
increase in magnetic field strength and results in a net magnetization(Mz)
with measurable magnetic moment parallel to the B0 and is at equilibrium
in Z direction.
• When a radiofrequency pulse (RF), B1, is applied to the MZ
(longitudinal magnetization) in the presence of B0, MZ flips towards
the transverse plane ( X–Y) plane at different angles depending on
the strength of B1.
• RF pulse that causes 90° flipping produces maximum transverse
magnetization Mxy- commonly used in MRI.
• Mxy induces a current or a sinusoidal MR signal in the receiver
coil(placed Ʇ to B0) according to “Faraday’s law of induction”.
• This signal is called “Free induction decay” and is proportional to B0
and B1.
• If RF (B1) is switched off, FID signal decays causing return to original
state termed “Relaxation” of the nuclei.
• Three types of relaxation: T1, T2 and both.
T1 Relaxation
• Following a 90° RF pulse, longitudinal
magnetization MZ is converted to zero at X–Y
plane, but returns to equilibrium
exponentially.
• It occurs through spin-lattice interaction with
a relaxation constant T1, which is the time
when 63 % of MZ is recovered.
• Depends on vibrational frequencies(physical
characteristics such as solid/liquid or
stationary/moving).
• Fat = short T1 = Bright
Fluid = long T1= Dark
T2 Relaxation
• Following a 90° RF pulse, MZ flips to X–Y plane (Mxy),
which loses phase coherence due to spin-spin
interaction (random collision) in tissues and
inhomogeneity of the external field.
• The FID signal decays exponentially with a time constant
T2, during which the signal decays to 37 %.
• Blood = long T2 = Mobile/moving
Bone = short T2 = Stationary/non-moving
Pulse sequence
• MR signals depend upon: a) T1 and T2 relaxation time constant
b) Proton density of different tissues
• To obtain sufficient contrast between tissues tailoring is done to the
parameters of B1 and B0 termed as pulse sequence.
• Parameters are :
a. Timing
b. Order
c. Polarity
d. Repetition frequency
Types of pulse sequence
• Three major types:
1. Spin echo (SE)
2. Inversion recovery (IRE)
3. Gradient recall echo (GRE)
• A given pulse sequence is chosen on the basis of tissue characteristics
defined by the T1 and T2 relaxation times and proton density.
Spin echo (SE)
• A 90⁰ pulse is applied to cause transverse magnetization f/b a 180⁰ pulse to
reverse it to longitudinal magnetization.
• When all spins are rephased, an RF “Echo”(measurable MR signal) is produced.
• Time between the 90⁰ pulse and peak of echo is c/a the ‘Time of echo’(TE).
• Time between two successive 90⁰ pulses is c/a the Repetition time(TR).
• A SE sequence of short TR and TE is c/a “T1-Weighting”. Useful for anatomical
delineation.
• A SE sequence of long TR and TE is c/a “T2-Weighting”.
Inversion recovery (IR)
• An 180° pulse is applied causing net longitudinal magnetization along
the −Z direction that moves towards equilibrium along the +Z
direction due to spin-lattice interaction.
• But a 90° pulse is applied before reaching equilibrium whereby the
longitudinal magnetization flips to the X–Y plane ultimately producing
a FID signal.
• This technique is used to generate contrast between tissues with very
different T1 values by adjusting the inversion recovery time (the time
between the inversion 180° pulse and the 90° pulse).
Gradient recalled echo (GRE)
• Small angle RF pulses (typically 20–60°) are applied in rapid
succession to tissues.
• Useful in eliminating the artifacts arising from respiratory motion by
having a breath-hold acquisition.
MR Scanner
• Made up of coils of special metal alloys
in a cylindrical bore and cooled by liquid
helium.
• Electric current is applied through the coils
which induces a constant magnetic field along the bore.
• An RF coil is used to perturb the magnetization of the atomic nuclei.
• Two types :
a. Open type- used for claustrophobic patients. Maximum field strength is
1.2 T
b. Closed type – Maximum field strength available for clinical MR is 7.0 T
Benefits of PET/MR Integration
• Saving time. Compared to separate PET and MRI examinations, the
simultaneous procedure takes about 30 minutes instead of 60-90.
• Imaging the most complex cases. PET/MRI can be used for advanced
diagnostics in oncology, neurology and cardiology.
• Saving space. The 2-in-1 system helps to optimize room utilization within
the healthcare organization, while providers definitely need two separate
rooms for PET and MRI devices.
• Improving registration. Due to the same patient position throughout the
examination in simultaneous PET/MRI scanning, a health specialist will
have a synergetic image with a better quality compared to separate PET
and MRI.
PET/MR integration challenges
• PMT’s are sensitive to RF of the magnetic field causing artifacts in PET images, so
they are replaced by Magnetic field-insensitive avalanche photodiodes.
• Compact PET detectors are needed. Among the various scintillation materials,
bismuth germanium oxide (BGO) and lutetium oxyorthosilicate (LSO) are suitable
for PET/MRI applications because these crystals have magnetic susceptibility
close to human tissue.
• On the other hand, gadolinium oxyorthosilicate (GSO) is not suitable for the
PET/MRI because magnetic susceptibility of GSO is more than 1000 times greater
than that of LSO or BGO due to gadolinium contained in GSO, and as a result, it
leads to significant artifact and distortion in the MR image.
• PET detector and electronics located inside the MRI should be shielded with
conductive material to minimize the mutual interference between these PET
components and MRI field generated by the RF coil. Currently done by carbon
fibre.
Mobile PET/CT
• Due to low patient volume and high cost, many hospitals cannot
afford but can take advantage of Mobile PET/CT.
• Scanner and other necessary accessories are installed in a sturdy van
and moved to different clients on scheduled date and well
coordinated with nuclear pharmacy facilities.
• Must have a license and a letter of agreement.
• Must meet the Dept. of Transportation’s overload regulations and the
rules and regulations of fire safety and security of local authorities.
Micro-PET
• For research animal imaging(e.g. drug
evaluation).
• Large bore gives poor spatial resolution
hence small sized PET scanner with
small bore have been developed.
Gamma cameras as PET
• Can be used as PET cameras by connecting it with a coincidence circuit and
removing the collimators.
• The typical timing window is ~12 ns for dual head and ~10 ns for triple
head cameras.
• Not used nowadays.
• Advantage: low cost
• Disadvantage:
a. Low sensitivity- due to low detection efficiency of NaI(Tl) crystal
b. Poor spatial resolution
c. Significant camera dead time loss
d. Pulse pile up of counts due to low number of detectors
Data Acquisition
• Three steps:
1. Location of the coincident event
2. Analyses of pulse to see if they are within the energy window set
for 511 KeV.
3. Position of LOR is determined in polar coordinates to store the data
in computer memory as sinogram.
Sinogram
• Represents a single slice of data for a transverse FOV obtained from a
single ring of the PET scanner.
• For data storage each LOR is defined by the distance of LOR from the
centre of the gantry (r) and the angle of orientation of the LOR(φ).
• A matrix of appropriate size is chosen defined by r, φ coordinates and
counts are stored in the corresponding pixel in the matrix.
• When r is plotted in X-axis and φ in Y-axis it results in a shaded area
c/a Sinogram.
Time of flight PET
• TOF-PET is based on the measurement of time difference in the arrival of
the two 511 KeV annihilation photons at the detectors.
• Given by the formula; Δ𝑡 = 2
Δ𝑥
𝑐
where Δ𝑡 is the difference in arrival of the two photons at the two
detectors, Δ𝑥 position of the annihilated photon from CFOV, c is the speed of
light i.e. 3 × 1010 cm/sec
• Special Components needed such as
• a) Sufficiently fast scintillator (and preferably sufficiently high stopping
power). The current available scintillators are LSO, LYSO, and LaBr3. LuI3 and
LuAG (Ce or Pr) are new scintillators.
• b) fast PMT with fast rise time, low transit-time spread (TTS), and high
quantum efficiency (QE) at the wavelength of the emitted photoelectrons.
Advantages of TOF-PET
PET performance Image reconstruction Image quality Clinical performance
Reduced effect of
randoms
Reduced impact of small errors
in data correction
i.e. Inconsistent normalization,
absence of scatter correction,
and mismatched attenuation
correction (e.g., due to motion)
Reduced image noise Reduced acquisition
time or dose
Higher NEC Better algorithm convergence Higher SNR
(especially in heavy
patients)
Gain in heavy patients
Better convergence uniformity Better small lesions
quantitative accuracy
Improved lesion
detectability
Better overall image
quality
More accurate
quantification
2-D data acquisition
• Annular septa made up of tungsten or lead are inserted between
rings in multiring PET scanners which acts as parallel hole collimators.
• It mostly allows direct coincidence events to be recorded and
prevents random and scatter from other rings. This mode of data
acquisition is c/a 2-D acquisition.
• It reduces the contribution of scattered photons from 30-40%
(without septa) to 10-15%.
• Overall sensitivity is max. 2-3%.
3-D data acquisition
• Septa is not included.
• All events in coincidence are recorded including random and scatter
events.
• Sensitivity is 4-8× over 2-D acquisition.
• Reduction of scatter and random is done via smaller angle of
acceptance i.e. a detector is connected to fewer number of other
detectors.
Image reconstruction for 2-D data
• Via filtered backprojection and iterative method
• The LOR’s in a sinogram are backprojected by fourier method or
• By iterative method, the projections are estimated by determining the
weighted sum of the activities in all pixels along a LOR across the
estimated image, and then compared with the measured projection.
Image reconstruction of 3-D data
• Very large data volume so direct FBP and Iterative method is difficult
to apply.
• So first the 3-D sinogram data is first rebinned into a set of 2-D
equivalent projections and then FBP and Iterative is applied.
• Single slice rebinning method (SSRB):Via assigning axially tilted LOR’s
to Transaxial planes intersecting them at axial midpoints.
• Fourier rebinning method (FORE): Fourier method is applied to each
oblique sinogram in the frequency domain.
• FORE is more accurate than SSRB in determining source axial location.
Factors affecting data acquisition
1. Variation in detection efficiency of the detectors
2. Photon attenuation
3. Scatter coincidences
4. Random coincidences
5. Partial volume effect
6. Dead time
7. Parallax error (radial elongation)
Uniformity correction/Normalisation
• Due to variation in the Gain of PMT’s and location of the detector in the
block, there is non-uniformity of PMT’s.
• Data is made uniformly corrected by a factor c/a Normalisation.
• The normalisation factors are calculated for individual pixels as
𝐹ᵢ = Amean / Aᵢ
Amean is mean of all pixel counts, Aᵢ is counts in 𝑖 𝑡ℎ
pixel
• Normalised count in 𝑖 𝑡ℎ pixel is given by C 𝑛𝑜𝑟𝑚, ᵢ= Cᵢ × Fᵢ
Where Cᵢ is observed count in 𝑖 𝑡ℎ pixel from the patient
• Normalisation data collection requires long time (6-8 h)and is done
overnight in a weekly or monthly pattern.
Photon attenuation correction
• Methods are:
1. Chang method
2. Transmission scan method
3. CT transmission scan method
Chang method
• When two annihilation photons traverse through different thickness
of tissues , they are attenuated to a certain degree before detection
by detector.
• To correct for attenuation, assumption is made that there is uniform
density of tissue and constant μ for 511-KeV photons in tissue.
Where μ is linear attenuation coefficient in the tissue.
• Attenuation correction in each pixel is given by P = 𝑒−Σn
i=1μᵢ𝐷ᵢ
where D is the total thickness of the organ
• Used to correct for attenuation in brain PET imaging.
Transmission scan method
• Was used before the advent of PET/CT
• Ist a blank scan is obtained without any object or patient
• Next a transmission scan is obtained for each patient.
• Then the ratios of counts in each pixel between the blank scan and
the transmission scan are calculated for each patient.
• Then the emission scan is taken similar to transmission scan and each
pixel (each LOR) is corrected for attenuation by applying the
corresponding ratio.
• Normally transmission scan takes 20-40 minutes for acquisition.
CT transmission scan method
• Similar to Transmission scan method however CT transmission data is used
instead for PET and is done within minutes.
• Ratio of blank scan to CT transmission scan is used to generate
“attenuation correction map”.
• Factors from attenuation correction map is applied to each patient’s
emission scan.
• As the CT data is from ~70KeV x-ray, it is scaled up to match the 511-KeV
photons by applying a “scaling factor”.
• Scaling factor is assumed to be same for all tissues except Bone as it has
higher mass attenuation coefficient.
• Respiratory motion of the thorax and IV contrast agents affect the CT
attenuation factors.
Attenuation correction in PET/MR
• Two methods :
1. Segmentation method
2. Atlas based method
• In segmentation method, a transmission scan is obtained using
rotating 68Ge source or a CT scan to generate an attenuation map.
• This is then coregistered with MR images( commonly T₁W as it is best
for delineating anatomy).
• Then the MR image is segmented into different types of tissues and
appropriate linear attenuation coefficient (μ) is then applied to these
tissues.
• In Atlas based method, a ‘Template MR image’ is generated from the
average of co-registered MR images from multiple subjects(atlas).
• This template MR image is then coregistered with the MR image of a
patient , a patient specific attenuation map is obtained.
• Useful in correction in brain images.
Random coincidence correction
• Random events increase with increasing pulse-height window, coincidence
time window, and activity.
1.Correction can be made by Rc=2τR1R2
where R1 & R2 is single count rates of a radioactive source at each of the
detector pair, τ is the coincidence timing window
2.Another method is via taking a very high radioactive source and scanning
it over a time till the radioactivity is reduced to such low level that no
random event is recorded. Then the random event is calculated by
subtracting the low activity count from the high activity count.
3. By subtracting the standard coincidence timing window count from the
delayed timing window count.
Scatter coincidences
• High energy(511 KeV) annihilation photons may undergo Compton
scattering while passing through the body tissue without much loss of
energy. May also occur in detector itself.
• Scattering increases with density and depth of the tissue, density of the
detector material, the activity and the pulse height window. Causes
increased background and decreased image contrast.
• Correction can be done via:
a. Two energy window method
b. Theoretical model of scatter events
c. Convolution method
d. Monte carlo calculation
e. Narrowing the pulse height window
Dead time
• Correction can be done via measuring the observed count rates as a
function of increasing concentrations of activity.
• Dead time is calculated from these data and then applied to actual
patient’s data.
• High speed electronics, buffers and pulse pile–up rejection circuits
improve dead time loss.
Radial elongation/Parallax error/Radial
astigmatism
• Causes blurring of image.
• Here an off centre event strikes the back of the detector pair
tangentially .
• The X-,Y- positioning of the detectors is a distance away from the
actual location of annihilation.
• Increases with thicker detector and LOR’s distance from CFOV.
• Using large diameter ring improves this effect.
Performance measures of PET
• These include:
a. Spatial resolution
b. Sensitivity
c. Noise equivalent count rate (NECR)
d. Scatter fraction
e. Energy resolution at 511 KeV
Spatial resolution
• Represents the ability to disentangle two close point sources.
• Defined by several factors such as:
Detector size: determines intrinsic resolution(Ri), most imp. factor is
crystal width(d).
Spatial resolution
Positron range (Rp): distance between location of positron emission
and annihilation event. It increases with positron energy and
decreases with tissue density.
Results in blurring of image.
0.2 mm for 18F in tissue.
Non-collinearity(Ra): the two annihilation photons are not emitted
exactly at 180o (LOR). Maximum deviation is +
- 0.25o.
Spatial resolution
Reconstruction method: FBP filter degrades it, Kr is around 1.2-1.5
Location of the Detector(Rl) : Block detector cause error in
positioning(X,Y) of detector pair more than single detectors.
• Combining all these factors, the spatial resolution of PET is given by
𝑅 = 𝐾𝑟 × 𝑅𝑖2 + 𝑅𝑝2 + 𝑅𝑎2 + 𝑅𝑙2
• Transverse spatial resolution ranges from 4-5 mm at 1 cm and is best
at CFOV.
• Axial spatial resolution from 5-6 mm at 1 cm.
Sensitivity
• Defined as number of counts per unit time for each unit of activity.
Given as cps/MBq or cps/μCi.
• Depends on :
a. Geometric efficiency
b. Detection efficiency of the detector
c. Pulse height window
d. Dead time of the detector
• Sensitivity increases with number of rings in scanner.
• Sensitivity in 3-D acquisition >> 2-D acquisition.
Sensitivity
• Sensitivity (S) of a single ring detector is given by
𝑆 =
𝐴⋅ ε2⋅е−μt⋅3.7×10⁴
π𝐷2 (cps/μCi)
• A=detector area seen by a point source to be imaged, ε= detector
efficiency, μ= linear attenuation coefficient of 511 KeV photons in
detector material, t = thickness of the detector, D= diameter of the
ring
Noise equivalent count rate
• Noise degrades image quality and is primarily due to statistical
variation in count rates. It is given by
1
N
, where N is the count
density.
• To minimize Noise, NECR is to be maximized.
𝑁𝐸𝐶𝑅 =
𝑇2
𝑇+𝑆+𝑅
where T,S &R are the True, Scatter and Random coincidences.
Quality control in PET
Daily Weekly Quarterly Annually
PMT baseline check and
gain adjustment
Uniformity check Preventive maintenance NEMA NU-2 testing:
• Spatial resolution
• Sensitivity
• Intrinsic scatter
fraction
• Scatter correction
• Count rate
performance
Blank adjustment Well counter calibration
check
Detector
efficiency/Normalization
scan
Update of normalization
factors and well counter
calibration
Uniform cylinder or point
source scan (Sinogram)
Coincidence timing check Cross calibration
Energy window
calibration
Sinogram check
• Done daily before the patient study.
• Done using a standard 20 cm long 68Ge source placed in the CFOV
both vertically and horizontally so that uniform exposure of radiation
occurs to all the detectors. Carried out via software.
• This daily sinogram is compared (via “average variance”)to the
reference blank scan obtained during the last setup of scanner.
• If average variance >2.5, Recalibration is needed.
• And if it exceeds >5.0, manufacturers service is warranted.
Quality control in MR Scanner
• These are performed using a specifically designed phantom c/a ACR phantom.
• This phantom is filled with water solution of various paramagnetic ions such as
Manganese, Nickel & Copper and is positioned at the centre of the magnet.
• Scanning is done with preset scanning parameters such as :
a. Pulse sequence
b. Timing parameters (TR,TI & TE)
c. Flip angle
d. Matrix size
e. Field of view
f. RF power setting
g. Slice thickness
h. Number of acquisition
Accreditation of nuclear medicine facilities
• Given by two major organizations in US:
The American college of radiology(ACR)
Intersocietal commission on Accreditation for nuclear medicine
laboratories(ICANL)
• In india accreditation is given by Atomic energy regulatory
board(AERB) and National Accreditation Board for Testing and
Calibration Laboratories (NABL)

More Related Content

What's hot

PET/CT for Referring Physician
PET/CT for Referring PhysicianPET/CT for Referring Physician
PET/CT for Referring Physician
ELITE IMAGING
 
PET-CT Scan(Principles and Basics)
PET-CT Scan(Principles and Basics)PET-CT Scan(Principles and Basics)
PET-CT Scan(Principles and Basics)
abdulkader helwan
 
Ct Basics
Ct BasicsCt Basics
Ct Basics
Pramod Krishnan
 
Pet positron emission tomography (pet)
Pet positron emission tomography (pet)Pet positron emission tomography (pet)
Pet positron emission tomography (pet)Khizra Sammad
 
Positron Emissions Tomography (PET SCAN)
Positron Emissions Tomography (PET SCAN)Positron Emissions Tomography (PET SCAN)
Positron Emissions Tomography (PET SCAN)
D.A.B.M
 
Pet ct and its benefit vs risk
Pet ct and its benefit vs riskPet ct and its benefit vs risk
Pet ct and its benefit vs risk
VibhaJoshi12
 
Gamma Camera
Gamma CameraGamma Camera
Gamma Camera
Muhammad Musaddiq
 
Clinacal applications of PET/CT vs PET/MRI
Clinacal applications of PET/CT vs PET/MRIClinacal applications of PET/CT vs PET/MRI
Clinacal applications of PET/CT vs PET/MRI
Walid Rezk
 
P.e.t
P.e.tP.e.t
20.pet scan in oncology
20.pet scan in oncology20.pet scan in oncology
20.pet scan in oncologyArnab Bose
 
Helical and Multislice CT
Helical and Multislice CTHelical and Multislice CT
Helical and Multislice CT
Manojzz Bhatta
 
Fat suppression techniques in MRI
Fat suppression techniques in MRIFat suppression techniques in MRI
Fat suppression techniques in MRI
SakshamKumar30
 
Pet scanning.pptx
Pet scanning.pptxPet scanning.pptx
Pet scanning.pptx
christichristi3
 
Positron emission tomographic scan
Positron emission tomographic scanPositron emission tomographic scan
Positron emission tomographic scanPrashant Makhija
 
Mri image quality gamal mahdaly
Mri image quality gamal mahdalyMri image quality gamal mahdaly
Mri image quality gamal mahdaly
Gamal Mahdaly
 
Hybrid imaging ashik sctimst
Hybrid imaging ashik sctimstHybrid imaging ashik sctimst
Hybrid imaging ashik sctimst
ASHIK E H
 
Image reconstruction in nuclear medicine
Image reconstruction in nuclear medicineImage reconstruction in nuclear medicine
Image reconstruction in nuclear medicine
shokoofeh mousavi
 
computed Tomography
computed Tomographycomputed Tomography
PET-CT in Oncology
PET-CT in OncologyPET-CT in Oncology
PET-CT in Oncology
Assoc Prof Fathinul Fikri AS
 
SPECT
SPECTSPECT

What's hot (20)

PET/CT for Referring Physician
PET/CT for Referring PhysicianPET/CT for Referring Physician
PET/CT for Referring Physician
 
PET-CT Scan(Principles and Basics)
PET-CT Scan(Principles and Basics)PET-CT Scan(Principles and Basics)
PET-CT Scan(Principles and Basics)
 
Ct Basics
Ct BasicsCt Basics
Ct Basics
 
Pet positron emission tomography (pet)
Pet positron emission tomography (pet)Pet positron emission tomography (pet)
Pet positron emission tomography (pet)
 
Positron Emissions Tomography (PET SCAN)
Positron Emissions Tomography (PET SCAN)Positron Emissions Tomography (PET SCAN)
Positron Emissions Tomography (PET SCAN)
 
Pet ct and its benefit vs risk
Pet ct and its benefit vs riskPet ct and its benefit vs risk
Pet ct and its benefit vs risk
 
Gamma Camera
Gamma CameraGamma Camera
Gamma Camera
 
Clinacal applications of PET/CT vs PET/MRI
Clinacal applications of PET/CT vs PET/MRIClinacal applications of PET/CT vs PET/MRI
Clinacal applications of PET/CT vs PET/MRI
 
P.e.t
P.e.tP.e.t
P.e.t
 
20.pet scan in oncology
20.pet scan in oncology20.pet scan in oncology
20.pet scan in oncology
 
Helical and Multislice CT
Helical and Multislice CTHelical and Multislice CT
Helical and Multislice CT
 
Fat suppression techniques in MRI
Fat suppression techniques in MRIFat suppression techniques in MRI
Fat suppression techniques in MRI
 
Pet scanning.pptx
Pet scanning.pptxPet scanning.pptx
Pet scanning.pptx
 
Positron emission tomographic scan
Positron emission tomographic scanPositron emission tomographic scan
Positron emission tomographic scan
 
Mri image quality gamal mahdaly
Mri image quality gamal mahdalyMri image quality gamal mahdaly
Mri image quality gamal mahdaly
 
Hybrid imaging ashik sctimst
Hybrid imaging ashik sctimstHybrid imaging ashik sctimst
Hybrid imaging ashik sctimst
 
Image reconstruction in nuclear medicine
Image reconstruction in nuclear medicineImage reconstruction in nuclear medicine
Image reconstruction in nuclear medicine
 
computed Tomography
computed Tomographycomputed Tomography
computed Tomography
 
PET-CT in Oncology
PET-CT in OncologyPET-CT in Oncology
PET-CT in Oncology
 
SPECT
SPECTSPECT
SPECT
 

Similar to Positron emission tomography

PET SCANNING.pptx
PET SCANNING.pptxPET SCANNING.pptx
PET SCANNING.pptx
rohanjohnjacob
 
Physics of Nuclear Medicine, SPECT and PET.ppt
Physics of Nuclear Medicine, SPECT and PET.pptPhysics of Nuclear Medicine, SPECT and PET.ppt
Physics of Nuclear Medicine, SPECT and PET.ppt
Hassan Chattha
 
Pet
PetPet
Positron emission tomography
Positron emission tomographyPositron emission tomography
Positron emission tomography
Rohit Roy
 
FUSION IMAGING
FUSION IMAGINGFUSION IMAGING
FUSION IMAGING
Vibhuti Kaul
 
CT Dose Issues.pptx on the factors to be considered on radiation protection
CT Dose Issues.pptx on the factors to be considered on radiation protectionCT Dose Issues.pptx on the factors to be considered on radiation protection
CT Dose Issues.pptx on the factors to be considered on radiation protection
sanyengere
 
Medical imaging summary 1
Medical imaging summary 1Medical imaging summary 1
Medical imaging summary 1
sirrainbow
 
Pet appilcation[1]
Pet  appilcation[1]Pet  appilcation[1]
Pet appilcation[1]
SanzzuTimilsina
 
LCU RDG 402 PRINCIPLES OF COMPUTED TOMOGRAPHY.pptx
LCU RDG 402  PRINCIPLES OF COMPUTED TOMOGRAPHY.pptxLCU RDG 402  PRINCIPLES OF COMPUTED TOMOGRAPHY.pptx
LCU RDG 402 PRINCIPLES OF COMPUTED TOMOGRAPHY.pptx
EmmanuelOluseyi1
 
Nuclear imaging in dentistry
Nuclear imaging in dentistryNuclear imaging in dentistry
Nuclear imaging in dentistry
Dr Jinki Singha
 
CT dose reduction
CT dose reductionCT dose reduction
CT dose reduction
ssuserb330ef1
 
spect .pptx
spect .pptxspect .pptx
Clinical pet and pet ct
Clinical pet and pet ctClinical pet and pet ct
Clinical pet and pet ctSpringer
 
positronemissiontomographypetscananditsapplications_210225164330.pptx
positronemissiontomographypetscananditsapplications_210225164330.pptxpositronemissiontomographypetscananditsapplications_210225164330.pptx
positronemissiontomographypetscananditsapplications_210225164330.pptx
KareemElsharkawy6
 
Pet scan
Pet scanPet scan
Pet scan
Dr. sreeremya S
 
Computed Tomography
Computed TomographyComputed Tomography
Computed Tomography
Sujan Poudel
 
COMPUTED TOMOGRAPHY SCAN
COMPUTED TOMOGRAPHY SCANCOMPUTED TOMOGRAPHY SCAN
COMPUTED TOMOGRAPHY SCANShounak Nandi
 
Proton Computed Tomography.pptx
Proton Computed Tomography.pptxProton Computed Tomography.pptx
Proton Computed Tomography.pptxNicole Hoffmann
 
Basics of Nuclear Medicine 2.pptxmmmmmmmmm
Basics of Nuclear Medicine 2.pptxmmmmmmmmmBasics of Nuclear Medicine 2.pptxmmmmmmmmm
Basics of Nuclear Medicine 2.pptxmmmmmmmmm
IbrahemIssacGaied
 

Similar to Positron emission tomography (20)

PET SCANNING.pptx
PET SCANNING.pptxPET SCANNING.pptx
PET SCANNING.pptx
 
Physics of Nuclear Medicine, SPECT and PET.ppt
Physics of Nuclear Medicine, SPECT and PET.pptPhysics of Nuclear Medicine, SPECT and PET.ppt
Physics of Nuclear Medicine, SPECT and PET.ppt
 
Pet
PetPet
Pet
 
Positron emission tomography
Positron emission tomographyPositron emission tomography
Positron emission tomography
 
FUSION IMAGING
FUSION IMAGINGFUSION IMAGING
FUSION IMAGING
 
CT Dose Issues.pptx on the factors to be considered on radiation protection
CT Dose Issues.pptx on the factors to be considered on radiation protectionCT Dose Issues.pptx on the factors to be considered on radiation protection
CT Dose Issues.pptx on the factors to be considered on radiation protection
 
PET Poster Jeena
PET Poster JeenaPET Poster Jeena
PET Poster Jeena
 
Medical imaging summary 1
Medical imaging summary 1Medical imaging summary 1
Medical imaging summary 1
 
Pet appilcation[1]
Pet  appilcation[1]Pet  appilcation[1]
Pet appilcation[1]
 
LCU RDG 402 PRINCIPLES OF COMPUTED TOMOGRAPHY.pptx
LCU RDG 402  PRINCIPLES OF COMPUTED TOMOGRAPHY.pptxLCU RDG 402  PRINCIPLES OF COMPUTED TOMOGRAPHY.pptx
LCU RDG 402 PRINCIPLES OF COMPUTED TOMOGRAPHY.pptx
 
Nuclear imaging in dentistry
Nuclear imaging in dentistryNuclear imaging in dentistry
Nuclear imaging in dentistry
 
CT dose reduction
CT dose reductionCT dose reduction
CT dose reduction
 
spect .pptx
spect .pptxspect .pptx
spect .pptx
 
Clinical pet and pet ct
Clinical pet and pet ctClinical pet and pet ct
Clinical pet and pet ct
 
positronemissiontomographypetscananditsapplications_210225164330.pptx
positronemissiontomographypetscananditsapplications_210225164330.pptxpositronemissiontomographypetscananditsapplications_210225164330.pptx
positronemissiontomographypetscananditsapplications_210225164330.pptx
 
Pet scan
Pet scanPet scan
Pet scan
 
Computed Tomography
Computed TomographyComputed Tomography
Computed Tomography
 
COMPUTED TOMOGRAPHY SCAN
COMPUTED TOMOGRAPHY SCANCOMPUTED TOMOGRAPHY SCAN
COMPUTED TOMOGRAPHY SCAN
 
Proton Computed Tomography.pptx
Proton Computed Tomography.pptxProton Computed Tomography.pptx
Proton Computed Tomography.pptx
 
Basics of Nuclear Medicine 2.pptxmmmmmmmmm
Basics of Nuclear Medicine 2.pptxmmmmmmmmmBasics of Nuclear Medicine 2.pptxmmmmmmmmm
Basics of Nuclear Medicine 2.pptxmmmmmmmmm
 

Recently uploaded

Tom Selleck Health: A Comprehensive Look at the Iconic Actor’s Wellness Journey
Tom Selleck Health: A Comprehensive Look at the Iconic Actor’s Wellness JourneyTom Selleck Health: A Comprehensive Look at the Iconic Actor’s Wellness Journey
Tom Selleck Health: A Comprehensive Look at the Iconic Actor’s Wellness Journey
greendigital
 
micro teaching on communication m.sc nursing.pdf
micro teaching on communication m.sc nursing.pdfmicro teaching on communication m.sc nursing.pdf
micro teaching on communication m.sc nursing.pdf
Anurag Sharma
 
Ophthalmology Clinical Tests for OSCE exam
Ophthalmology Clinical Tests for OSCE examOphthalmology Clinical Tests for OSCE exam
Ophthalmology Clinical Tests for OSCE exam
KafrELShiekh University
 
Ocular injury ppt Upendra pal optometrist upums saifai etawah
Ocular injury  ppt  Upendra pal  optometrist upums saifai etawahOcular injury  ppt  Upendra pal  optometrist upums saifai etawah
Ocular injury ppt Upendra pal optometrist upums saifai etawah
pal078100
 
Lung Cancer: Artificial Intelligence, Synergetics, Complex System Analysis, S...
Lung Cancer: Artificial Intelligence, Synergetics, Complex System Analysis, S...Lung Cancer: Artificial Intelligence, Synergetics, Complex System Analysis, S...
Lung Cancer: Artificial Intelligence, Synergetics, Complex System Analysis, S...
Oleg Kshivets
 
NVBDCP.pptx Nation vector borne disease control program
NVBDCP.pptx Nation vector borne disease control programNVBDCP.pptx Nation vector borne disease control program
NVBDCP.pptx Nation vector borne disease control program
Sapna Thakur
 
Maxilla, Mandible & Hyoid Bone & Clinical Correlations by Dr. RIG.pptx
Maxilla, Mandible & Hyoid Bone & Clinical Correlations by Dr. RIG.pptxMaxilla, Mandible & Hyoid Bone & Clinical Correlations by Dr. RIG.pptx
Maxilla, Mandible & Hyoid Bone & Clinical Correlations by Dr. RIG.pptx
Dr. Rabia Inam Gandapore
 
Hemodialysis: Chapter 3, Dialysis Water Unit - Dr.Gawad
Hemodialysis: Chapter 3, Dialysis Water Unit - Dr.GawadHemodialysis: Chapter 3, Dialysis Water Unit - Dr.Gawad
Hemodialysis: Chapter 3, Dialysis Water Unit - Dr.Gawad
NephroTube - Dr.Gawad
 
basicmodesofventilation2022-220313203758.pdf
basicmodesofventilation2022-220313203758.pdfbasicmodesofventilation2022-220313203758.pdf
basicmodesofventilation2022-220313203758.pdf
aljamhori teaching hospital
 
Pulmonary Thromboembolism - etilogy, types, medical- Surgical and nursing man...
Pulmonary Thromboembolism - etilogy, types, medical- Surgical and nursing man...Pulmonary Thromboembolism - etilogy, types, medical- Surgical and nursing man...
Pulmonary Thromboembolism - etilogy, types, medical- Surgical and nursing man...
VarunMahajani
 
263778731218 Abortion Clinic /Pills In Harare ,
263778731218 Abortion Clinic /Pills In Harare ,263778731218 Abortion Clinic /Pills In Harare ,
263778731218 Abortion Clinic /Pills In Harare ,
sisternakatoto
 
Charaka Samhita Sutra sthana Chapter 15 Upakalpaniyaadhyaya
Charaka Samhita Sutra sthana Chapter 15 UpakalpaniyaadhyayaCharaka Samhita Sutra sthana Chapter 15 Upakalpaniyaadhyaya
Charaka Samhita Sutra sthana Chapter 15 Upakalpaniyaadhyaya
Dr KHALID B.M
 
Triangles of Neck and Clinical Correlation by Dr. RIG.pptx
Triangles of Neck and Clinical Correlation by Dr. RIG.pptxTriangles of Neck and Clinical Correlation by Dr. RIG.pptx
Triangles of Neck and Clinical Correlation by Dr. RIG.pptx
Dr. Rabia Inam Gandapore
 
Superficial & Deep Fascia of the NECK.pptx
Superficial & Deep Fascia of the NECK.pptxSuperficial & Deep Fascia of the NECK.pptx
Superficial & Deep Fascia of the NECK.pptx
Dr. Rabia Inam Gandapore
 
New Directions in Targeted Therapeutic Approaches for Older Adults With Mantl...
New Directions in Targeted Therapeutic Approaches for Older Adults With Mantl...New Directions in Targeted Therapeutic Approaches for Older Adults With Mantl...
New Directions in Targeted Therapeutic Approaches for Older Adults With Mantl...
i3 Health
 
TEST BANK for Operations Management, 14th Edition by William J. Stevenson, Ve...
TEST BANK for Operations Management, 14th Edition by William J. Stevenson, Ve...TEST BANK for Operations Management, 14th Edition by William J. Stevenson, Ve...
TEST BANK for Operations Management, 14th Edition by William J. Stevenson, Ve...
kevinkariuki227
 
POST OPERATIVE OLIGURIA and its management
POST OPERATIVE OLIGURIA and its managementPOST OPERATIVE OLIGURIA and its management
POST OPERATIVE OLIGURIA and its management
touseefaziz1
 
Report Back from SGO 2024: What’s the Latest in Cervical Cancer?
Report Back from SGO 2024: What’s the Latest in Cervical Cancer?Report Back from SGO 2024: What’s the Latest in Cervical Cancer?
Report Back from SGO 2024: What’s the Latest in Cervical Cancer?
bkling
 
Are There Any Natural Remedies To Treat Syphilis.pdf
Are There Any Natural Remedies To Treat Syphilis.pdfAre There Any Natural Remedies To Treat Syphilis.pdf
Are There Any Natural Remedies To Treat Syphilis.pdf
Little Cross Family Clinic
 
Alcohol_Dr. Jeenal Mistry MD Pharmacology.pdf
Alcohol_Dr. Jeenal Mistry MD Pharmacology.pdfAlcohol_Dr. Jeenal Mistry MD Pharmacology.pdf
Alcohol_Dr. Jeenal Mistry MD Pharmacology.pdf
Dr Jeenal Mistry
 

Recently uploaded (20)

Tom Selleck Health: A Comprehensive Look at the Iconic Actor’s Wellness Journey
Tom Selleck Health: A Comprehensive Look at the Iconic Actor’s Wellness JourneyTom Selleck Health: A Comprehensive Look at the Iconic Actor’s Wellness Journey
Tom Selleck Health: A Comprehensive Look at the Iconic Actor’s Wellness Journey
 
micro teaching on communication m.sc nursing.pdf
micro teaching on communication m.sc nursing.pdfmicro teaching on communication m.sc nursing.pdf
micro teaching on communication m.sc nursing.pdf
 
Ophthalmology Clinical Tests for OSCE exam
Ophthalmology Clinical Tests for OSCE examOphthalmology Clinical Tests for OSCE exam
Ophthalmology Clinical Tests for OSCE exam
 
Ocular injury ppt Upendra pal optometrist upums saifai etawah
Ocular injury  ppt  Upendra pal  optometrist upums saifai etawahOcular injury  ppt  Upendra pal  optometrist upums saifai etawah
Ocular injury ppt Upendra pal optometrist upums saifai etawah
 
Lung Cancer: Artificial Intelligence, Synergetics, Complex System Analysis, S...
Lung Cancer: Artificial Intelligence, Synergetics, Complex System Analysis, S...Lung Cancer: Artificial Intelligence, Synergetics, Complex System Analysis, S...
Lung Cancer: Artificial Intelligence, Synergetics, Complex System Analysis, S...
 
NVBDCP.pptx Nation vector borne disease control program
NVBDCP.pptx Nation vector borne disease control programNVBDCP.pptx Nation vector borne disease control program
NVBDCP.pptx Nation vector borne disease control program
 
Maxilla, Mandible & Hyoid Bone & Clinical Correlations by Dr. RIG.pptx
Maxilla, Mandible & Hyoid Bone & Clinical Correlations by Dr. RIG.pptxMaxilla, Mandible & Hyoid Bone & Clinical Correlations by Dr. RIG.pptx
Maxilla, Mandible & Hyoid Bone & Clinical Correlations by Dr. RIG.pptx
 
Hemodialysis: Chapter 3, Dialysis Water Unit - Dr.Gawad
Hemodialysis: Chapter 3, Dialysis Water Unit - Dr.GawadHemodialysis: Chapter 3, Dialysis Water Unit - Dr.Gawad
Hemodialysis: Chapter 3, Dialysis Water Unit - Dr.Gawad
 
basicmodesofventilation2022-220313203758.pdf
basicmodesofventilation2022-220313203758.pdfbasicmodesofventilation2022-220313203758.pdf
basicmodesofventilation2022-220313203758.pdf
 
Pulmonary Thromboembolism - etilogy, types, medical- Surgical and nursing man...
Pulmonary Thromboembolism - etilogy, types, medical- Surgical and nursing man...Pulmonary Thromboembolism - etilogy, types, medical- Surgical and nursing man...
Pulmonary Thromboembolism - etilogy, types, medical- Surgical and nursing man...
 
263778731218 Abortion Clinic /Pills In Harare ,
263778731218 Abortion Clinic /Pills In Harare ,263778731218 Abortion Clinic /Pills In Harare ,
263778731218 Abortion Clinic /Pills In Harare ,
 
Charaka Samhita Sutra sthana Chapter 15 Upakalpaniyaadhyaya
Charaka Samhita Sutra sthana Chapter 15 UpakalpaniyaadhyayaCharaka Samhita Sutra sthana Chapter 15 Upakalpaniyaadhyaya
Charaka Samhita Sutra sthana Chapter 15 Upakalpaniyaadhyaya
 
Triangles of Neck and Clinical Correlation by Dr. RIG.pptx
Triangles of Neck and Clinical Correlation by Dr. RIG.pptxTriangles of Neck and Clinical Correlation by Dr. RIG.pptx
Triangles of Neck and Clinical Correlation by Dr. RIG.pptx
 
Superficial & Deep Fascia of the NECK.pptx
Superficial & Deep Fascia of the NECK.pptxSuperficial & Deep Fascia of the NECK.pptx
Superficial & Deep Fascia of the NECK.pptx
 
New Directions in Targeted Therapeutic Approaches for Older Adults With Mantl...
New Directions in Targeted Therapeutic Approaches for Older Adults With Mantl...New Directions in Targeted Therapeutic Approaches for Older Adults With Mantl...
New Directions in Targeted Therapeutic Approaches for Older Adults With Mantl...
 
TEST BANK for Operations Management, 14th Edition by William J. Stevenson, Ve...
TEST BANK for Operations Management, 14th Edition by William J. Stevenson, Ve...TEST BANK for Operations Management, 14th Edition by William J. Stevenson, Ve...
TEST BANK for Operations Management, 14th Edition by William J. Stevenson, Ve...
 
POST OPERATIVE OLIGURIA and its management
POST OPERATIVE OLIGURIA and its managementPOST OPERATIVE OLIGURIA and its management
POST OPERATIVE OLIGURIA and its management
 
Report Back from SGO 2024: What’s the Latest in Cervical Cancer?
Report Back from SGO 2024: What’s the Latest in Cervical Cancer?Report Back from SGO 2024: What’s the Latest in Cervical Cancer?
Report Back from SGO 2024: What’s the Latest in Cervical Cancer?
 
Are There Any Natural Remedies To Treat Syphilis.pdf
Are There Any Natural Remedies To Treat Syphilis.pdfAre There Any Natural Remedies To Treat Syphilis.pdf
Are There Any Natural Remedies To Treat Syphilis.pdf
 
Alcohol_Dr. Jeenal Mistry MD Pharmacology.pdf
Alcohol_Dr. Jeenal Mistry MD Pharmacology.pdfAlcohol_Dr. Jeenal Mistry MD Pharmacology.pdf
Alcohol_Dr. Jeenal Mistry MD Pharmacology.pdf
 

Positron emission tomography

  • 2. Overview • PET is an imaging technique based on the detection in coincidence of two 511-KeV annihilation radiations that originate from β+ (positron) emitting source. • Coincidence time window : patient being the radioactive source, the positrons are annihilated in the body tissue and produce two photons (511-KeV) in opposite direction(180o) which is detected in a electronic time interval called “Coincidence time window”. • As the two photons are detected in a straight line , no collimator is needed to limit the field of view, and the technique is called the “Electronic collimation”.
  • 3.
  • 4. PET Radiopharmaceuticals • Only 18F, 13N, 11C, 82Rb are used commonly,
  • 5. Radiopharmaceuticals and its uses RP Used for 82Rb RbCl and 13N ammonia Myocardial perfusion imaging 18F fluorodeoxyglucose (FDG) Metabolic imaging of heart and brain 18F fluorodopa Parkinson disease and Neuroendocrine tumors 18F fluorothymidine Tumor imaging 18F fluoromisonidazole (FMISO) and 18F-HX4 Hypoxic tumor imaging 11C choline Colon cancer 18F fluorbetapir Amyloid plaque imaging in Alzheimer disease
  • 6. Characteristics of PET radionuclides Radionuclides Half-life Mode of decay(%) MeV 11C 20.4 min. β+(100) 0.970 13N 10 min. β+(100) 1.2 15O 2 min. β+(100) 1.74 18F 110 min. β+(97) EC (3) 0.64 68Ga 68 min. β+(89) EC (11) 1.9 82Rb 75 s β+(95) EC (5) 3.15 124I 4.2 d β+(23) EC (77) 2.14
  • 7. Detectors in PET scanners • Most commercial PET manufacturers use BGO, LSO and LYSO. NaI(Tl) BaF2 BGO LSO GSO LYSO LaBr3 LFS LuAP LuI3 Effective atomic no. (Z) 51 54 74 66 59 60 47 63 65 60 Linear attenuation coeff. (cm −1 ) 0.34 0.44 0.92 0.87 0.62 0.86 0.47 0.82 0.9 ~0.56 Density (gm cm −3 ) 3.67 4.89 7.13 7.4 6.7 7.1 5.3 7.3 8.34 5.6 Index of refraction 1.85 – 2.15 1.82 1.85 1.81 1.88 1.78 1.95 Light yield (% NaI(Tl)) 100 5 15 75 30 80 160 77 16 190 Peak wavelength (nm) 410 220 480 420 430 420 370 430 365 470 Decay constant (ns) 230 0.8 300 40 65 41 25 35 18 30 Hygroscopic Yes Slight No No No Fragile No No No No Yes
  • 8. • The role of the detector is to stop an emitted gamma ray and produce a signal that the downstream electronics can utilize. • Ideal detector : would have 1. high stopping power (high probability that a 511 keV gamma ray will be totally absorbed by the detector), 2. have high spatial resolution (ability to determine the interaction location of the gamma ray in the detector to a small spatial volume), 3. have very good energy resolution (to reject scattered events), 4. have very high timing resolution and 5. be inexpensive to produce. • However no ideal detector exists in the current time period.
  • 9. • LSO and LYSO have shorter scintillation decay time and higher light output than BGO • but poor energy resolution due to the intrinsic property of a naturally occurring radioisotope 176-Lu (2.6% abundance) with half life of 3.8×10⁸ years. • The radionuclide decays by β- decay and x-rays of 88-400 KeV. • As the activity is low enough , it does not cause a major problem in PET imaging.
  • 10. Semiconductor detector • Currently not used in clinical PET imaging due to poor detection efficiency. • Ge(Li), Si(Li), Cadmium-zinc-tellurium(CZT) are some examples. • These detectors do not require any PMT for amplification of pulses as some electron multiplication is done via high voltage application. • CZT has high energy resolution (~5%) and low noise in images.
  • 11. PMT’s and PHA’s • PMT convert light photons arising from the interaction of charged γ- rays in detectors to pulses, which are used to determine the X-,Y- positions of the two detectors that detect the two 511 KeV photons. • PHA is used to check if the pulse height is within acceptable range (350-650 KeV for 511 KeV annihilation photopeak).
  • 12. PET scanner design • Consists of multiple block detectors each connected to a PMT arranged in a circular, hexagonal or orthogonal rings. • Each block detector is typically 3 cm deep and grooved into 6×8, 7 ×8 or 8 ×8 elements (small detector, size 3-6.5mm, Spatial resolution) of varying depths by partial cuts through a saw at the front surface. • Deepest cut is at the edge of a block . • The cuts are filled with opaque reflective materials to prevent spillover of light between elements.
  • 14. Coincidence timing window/ Timing resolution • Ideally the two annihilation photons should be detected at the same time but in reality one photon may arrive earlier at one detector. • This uncertainty in detection time is called as timing resolution. • Typically it is set at 6-20 ns in conventional PET scanner. • Coincident events: any event occurring within the CTW is counted as coincidence. • Angle of acceptance: Each detector element is connected by a coincidence circuit with a time window to a set of opposite detector elements. Depending on the number of opposite detectors connected, each detector element has a number of projections called as angle of acceptance.
  • 15.
  • 17. Advantages of PET/CT scanner 1. Overall accuracy of diagnosis increases by 20-25% than either modality alone. 2. Overall decreased scan time. 3. Better localization of activity to normal vs abnormal structures. 4. Better identification of inflammatory lesions. 5. CT visualization of PET-negative lesions (especially bone lesions). 6. Discovery of serendipitous abnormalities: The “serendipity factor” of PET is very high, meaning that unsuspected malignancies are detected on PET studies performed for assessment of other malignancies. 7. Confirmation of unusual or abnormal sites, and improved localization for biopsy or radiotherapy.
  • 18. Disadvantages of PET/CT over PET Claustrophobia Radiation dosimetry: In general, the radiation from a typical PET scan is equivalent to about 3 to 5 times as much as a person would receive in 1 year from the naturally occurring “background” radiation exposure from our surroundings and from cosmic rays penetrating the atmosphere; depending on the technique used, radiation from a PET/CT often can be 5 to 10 times greater than annual background radiation.
  • 19. Disadvantages of PET/CT over PET Technical difficulties: because the scanner comprises two very complicated machines. CT-based attenuation correction of emission PET images limits some of the techniques that can be used. For example, the use of intravenous contrast for the CT scan: can cause artifacts in the reconstruction of the PET images. This is because the iodine component of intravenous contrast absorbs the lower- energy CT x-rays much more efficiently than the high-energy, 511 keV photons emitted during PET imaging.This leads to an “overadjustment” for photon attenuation in the regions where dense contrast is present, resulting in an overestimation of the activity level at these sites when the PET images are reconstructed.
  • 20. Disadvantages of PET/CT over PET Motion artifacts can be amplified with PET/CT. A specific and important facet of this is respiratory motion. As a general rule, the CT images are best performed at end-tidal respiration, since that is close to the position that the diaphragm occupies for about 75% of the time during normal tidal breathing. Misregistration: For example, in one recent paper, the accuracy of staging lung cancer was actually lower with PET/CT than with PET alone, even though the confidence of the correct interpretations was higher.
  • 21. Limitations of CT in PET/CT • In order to minimize radiation dosimetry, the CT scans are performed at lower energy settings, which produce lower-quality images than would a diagnostic-quality CT scan. • Intravenous contrast is not employed unless a separate, diagnostic CT exam is ordered, because of the increased cost and patient risk, as well as the possibility of imaging artifacts. • Most clinically important is that, unlike the gantry of a diagnostic CT scanner, which can be tilted by several degrees (often performed for special studies of head and neck cases, in order to obtain direct coronal images or to minimize streak artifacts from dental fillings), the much larger gantry of the PET/CT scanner cannot be tilted.
  • 22. PET/MR scanner Sequential PET/MRI scanner Simultaneous PET/MRI scanner
  • 23. PET/MR • Hybrid imaging technology which combines molecular and functional information of PET with the soft tissue contrast of MRI. • FDA approval given in June of 2011. • Types : a. Sequential b. Simultaneous
  • 24. PET/CT vs PET/MRI PET/CT PET/MRI Strengths Widely available Improved soft tissue contrast Established imaging protocols Added value of DWI Evidence proven indications Increased available time to collect PET data Familiarity among ordering providers Better motion correction Quantitative accuracy well established Convenience and time savings with combined exams Imaging of small pulmonary nodules Use of MRI specific contrast agents Exams performed in as little as 30 minutes No ionizing radiation from MRI component Limitations Limited soft tissue contrast Limited availability • Limited evaluation of pulmonary parenchyma Fast CT exam does not provide extra time for PET acquisition Protocols and indications still in development IV contrast not routinely used Require technologist knowledgeable in both NM and MRI If focused MRI needed, must be additional exam Quantitative accuracy still being determined Ionizing radiation from CT component Exams may take 1 hour or longer
  • 25. Principles of MR imaging • Based on the magnetic property of atomic nuclei. • Nuclei containing odd number of protons or neutrons possess a net magnetic moment with magnitude and direction and behave like magnets. E.g. H+ proton in the form of water in the body.
  • 26. • Free protons spin randomly and their magnetic moments cancel each other, with a residual momentum due to an unpaired proton, if any. • When an external magnetic field, B0, is applied, the protons orient themselves in either parallel or antiparallel direction to the field B0. • The number of parallel protons are slightly larger than antiparallel ones, thus creating a net magnetic moment in the direction of B0. • The energy difference between the two groups is ΔE.
  • 27. • Normally a greater spin exists in parallel direction which increases with increase in magnetic field strength and results in a net magnetization(Mz) with measurable magnetic moment parallel to the B0 and is at equilibrium in Z direction. • When a radiofrequency pulse (RF), B1, is applied to the MZ (longitudinal magnetization) in the presence of B0, MZ flips towards the transverse plane ( X–Y) plane at different angles depending on the strength of B1. • RF pulse that causes 90° flipping produces maximum transverse magnetization Mxy- commonly used in MRI.
  • 28. • Mxy induces a current or a sinusoidal MR signal in the receiver coil(placed Ʇ to B0) according to “Faraday’s law of induction”. • This signal is called “Free induction decay” and is proportional to B0 and B1. • If RF (B1) is switched off, FID signal decays causing return to original state termed “Relaxation” of the nuclei. • Three types of relaxation: T1, T2 and both.
  • 29. T1 Relaxation • Following a 90° RF pulse, longitudinal magnetization MZ is converted to zero at X–Y plane, but returns to equilibrium exponentially. • It occurs through spin-lattice interaction with a relaxation constant T1, which is the time when 63 % of MZ is recovered. • Depends on vibrational frequencies(physical characteristics such as solid/liquid or stationary/moving). • Fat = short T1 = Bright Fluid = long T1= Dark
  • 30. T2 Relaxation • Following a 90° RF pulse, MZ flips to X–Y plane (Mxy), which loses phase coherence due to spin-spin interaction (random collision) in tissues and inhomogeneity of the external field. • The FID signal decays exponentially with a time constant T2, during which the signal decays to 37 %. • Blood = long T2 = Mobile/moving Bone = short T2 = Stationary/non-moving
  • 31. Pulse sequence • MR signals depend upon: a) T1 and T2 relaxation time constant b) Proton density of different tissues • To obtain sufficient contrast between tissues tailoring is done to the parameters of B1 and B0 termed as pulse sequence. • Parameters are : a. Timing b. Order c. Polarity d. Repetition frequency
  • 32. Types of pulse sequence • Three major types: 1. Spin echo (SE) 2. Inversion recovery (IRE) 3. Gradient recall echo (GRE) • A given pulse sequence is chosen on the basis of tissue characteristics defined by the T1 and T2 relaxation times and proton density.
  • 33. Spin echo (SE) • A 90⁰ pulse is applied to cause transverse magnetization f/b a 180⁰ pulse to reverse it to longitudinal magnetization. • When all spins are rephased, an RF “Echo”(measurable MR signal) is produced. • Time between the 90⁰ pulse and peak of echo is c/a the ‘Time of echo’(TE). • Time between two successive 90⁰ pulses is c/a the Repetition time(TR). • A SE sequence of short TR and TE is c/a “T1-Weighting”. Useful for anatomical delineation. • A SE sequence of long TR and TE is c/a “T2-Weighting”.
  • 34. Inversion recovery (IR) • An 180° pulse is applied causing net longitudinal magnetization along the −Z direction that moves towards equilibrium along the +Z direction due to spin-lattice interaction. • But a 90° pulse is applied before reaching equilibrium whereby the longitudinal magnetization flips to the X–Y plane ultimately producing a FID signal. • This technique is used to generate contrast between tissues with very different T1 values by adjusting the inversion recovery time (the time between the inversion 180° pulse and the 90° pulse).
  • 35.
  • 36. Gradient recalled echo (GRE) • Small angle RF pulses (typically 20–60°) are applied in rapid succession to tissues. • Useful in eliminating the artifacts arising from respiratory motion by having a breath-hold acquisition.
  • 37. MR Scanner • Made up of coils of special metal alloys in a cylindrical bore and cooled by liquid helium. • Electric current is applied through the coils which induces a constant magnetic field along the bore. • An RF coil is used to perturb the magnetization of the atomic nuclei. • Two types : a. Open type- used for claustrophobic patients. Maximum field strength is 1.2 T b. Closed type – Maximum field strength available for clinical MR is 7.0 T
  • 38.
  • 39. Benefits of PET/MR Integration • Saving time. Compared to separate PET and MRI examinations, the simultaneous procedure takes about 30 minutes instead of 60-90. • Imaging the most complex cases. PET/MRI can be used for advanced diagnostics in oncology, neurology and cardiology. • Saving space. The 2-in-1 system helps to optimize room utilization within the healthcare organization, while providers definitely need two separate rooms for PET and MRI devices. • Improving registration. Due to the same patient position throughout the examination in simultaneous PET/MRI scanning, a health specialist will have a synergetic image with a better quality compared to separate PET and MRI.
  • 40. PET/MR integration challenges • PMT’s are sensitive to RF of the magnetic field causing artifacts in PET images, so they are replaced by Magnetic field-insensitive avalanche photodiodes. • Compact PET detectors are needed. Among the various scintillation materials, bismuth germanium oxide (BGO) and lutetium oxyorthosilicate (LSO) are suitable for PET/MRI applications because these crystals have magnetic susceptibility close to human tissue. • On the other hand, gadolinium oxyorthosilicate (GSO) is not suitable for the PET/MRI because magnetic susceptibility of GSO is more than 1000 times greater than that of LSO or BGO due to gadolinium contained in GSO, and as a result, it leads to significant artifact and distortion in the MR image. • PET detector and electronics located inside the MRI should be shielded with conductive material to minimize the mutual interference between these PET components and MRI field generated by the RF coil. Currently done by carbon fibre.
  • 41. Mobile PET/CT • Due to low patient volume and high cost, many hospitals cannot afford but can take advantage of Mobile PET/CT. • Scanner and other necessary accessories are installed in a sturdy van and moved to different clients on scheduled date and well coordinated with nuclear pharmacy facilities. • Must have a license and a letter of agreement. • Must meet the Dept. of Transportation’s overload regulations and the rules and regulations of fire safety and security of local authorities.
  • 42. Micro-PET • For research animal imaging(e.g. drug evaluation). • Large bore gives poor spatial resolution hence small sized PET scanner with small bore have been developed.
  • 43. Gamma cameras as PET • Can be used as PET cameras by connecting it with a coincidence circuit and removing the collimators. • The typical timing window is ~12 ns for dual head and ~10 ns for triple head cameras. • Not used nowadays. • Advantage: low cost • Disadvantage: a. Low sensitivity- due to low detection efficiency of NaI(Tl) crystal b. Poor spatial resolution c. Significant camera dead time loss d. Pulse pile up of counts due to low number of detectors
  • 44. Data Acquisition • Three steps: 1. Location of the coincident event 2. Analyses of pulse to see if they are within the energy window set for 511 KeV. 3. Position of LOR is determined in polar coordinates to store the data in computer memory as sinogram.
  • 45. Sinogram • Represents a single slice of data for a transverse FOV obtained from a single ring of the PET scanner. • For data storage each LOR is defined by the distance of LOR from the centre of the gantry (r) and the angle of orientation of the LOR(φ). • A matrix of appropriate size is chosen defined by r, φ coordinates and counts are stored in the corresponding pixel in the matrix. • When r is plotted in X-axis and φ in Y-axis it results in a shaded area c/a Sinogram.
  • 46.
  • 47. Time of flight PET • TOF-PET is based on the measurement of time difference in the arrival of the two 511 KeV annihilation photons at the detectors. • Given by the formula; Δ𝑡 = 2 Δ𝑥 𝑐 where Δ𝑡 is the difference in arrival of the two photons at the two detectors, Δ𝑥 position of the annihilated photon from CFOV, c is the speed of light i.e. 3 × 1010 cm/sec • Special Components needed such as • a) Sufficiently fast scintillator (and preferably sufficiently high stopping power). The current available scintillators are LSO, LYSO, and LaBr3. LuI3 and LuAG (Ce or Pr) are new scintillators. • b) fast PMT with fast rise time, low transit-time spread (TTS), and high quantum efficiency (QE) at the wavelength of the emitted photoelectrons.
  • 48.
  • 49. Advantages of TOF-PET PET performance Image reconstruction Image quality Clinical performance Reduced effect of randoms Reduced impact of small errors in data correction i.e. Inconsistent normalization, absence of scatter correction, and mismatched attenuation correction (e.g., due to motion) Reduced image noise Reduced acquisition time or dose Higher NEC Better algorithm convergence Higher SNR (especially in heavy patients) Gain in heavy patients Better convergence uniformity Better small lesions quantitative accuracy Improved lesion detectability Better overall image quality More accurate quantification
  • 50.
  • 51.
  • 52. 2-D data acquisition • Annular septa made up of tungsten or lead are inserted between rings in multiring PET scanners which acts as parallel hole collimators. • It mostly allows direct coincidence events to be recorded and prevents random and scatter from other rings. This mode of data acquisition is c/a 2-D acquisition. • It reduces the contribution of scattered photons from 30-40% (without septa) to 10-15%. • Overall sensitivity is max. 2-3%.
  • 53. 3-D data acquisition • Septa is not included. • All events in coincidence are recorded including random and scatter events. • Sensitivity is 4-8× over 2-D acquisition. • Reduction of scatter and random is done via smaller angle of acceptance i.e. a detector is connected to fewer number of other detectors.
  • 54. Image reconstruction for 2-D data • Via filtered backprojection and iterative method • The LOR’s in a sinogram are backprojected by fourier method or • By iterative method, the projections are estimated by determining the weighted sum of the activities in all pixels along a LOR across the estimated image, and then compared with the measured projection.
  • 55. Image reconstruction of 3-D data • Very large data volume so direct FBP and Iterative method is difficult to apply. • So first the 3-D sinogram data is first rebinned into a set of 2-D equivalent projections and then FBP and Iterative is applied. • Single slice rebinning method (SSRB):Via assigning axially tilted LOR’s to Transaxial planes intersecting them at axial midpoints. • Fourier rebinning method (FORE): Fourier method is applied to each oblique sinogram in the frequency domain. • FORE is more accurate than SSRB in determining source axial location.
  • 56. Factors affecting data acquisition 1. Variation in detection efficiency of the detectors 2. Photon attenuation 3. Scatter coincidences 4. Random coincidences 5. Partial volume effect 6. Dead time 7. Parallax error (radial elongation)
  • 57. Uniformity correction/Normalisation • Due to variation in the Gain of PMT’s and location of the detector in the block, there is non-uniformity of PMT’s. • Data is made uniformly corrected by a factor c/a Normalisation. • The normalisation factors are calculated for individual pixels as 𝐹ᵢ = Amean / Aᵢ Amean is mean of all pixel counts, Aᵢ is counts in 𝑖 𝑡ℎ pixel • Normalised count in 𝑖 𝑡ℎ pixel is given by C 𝑛𝑜𝑟𝑚, ᵢ= Cᵢ × Fᵢ Where Cᵢ is observed count in 𝑖 𝑡ℎ pixel from the patient • Normalisation data collection requires long time (6-8 h)and is done overnight in a weekly or monthly pattern.
  • 58. Photon attenuation correction • Methods are: 1. Chang method 2. Transmission scan method 3. CT transmission scan method
  • 59. Chang method • When two annihilation photons traverse through different thickness of tissues , they are attenuated to a certain degree before detection by detector. • To correct for attenuation, assumption is made that there is uniform density of tissue and constant μ for 511-KeV photons in tissue. Where μ is linear attenuation coefficient in the tissue. • Attenuation correction in each pixel is given by P = 𝑒−Σn i=1μᵢ𝐷ᵢ where D is the total thickness of the organ • Used to correct for attenuation in brain PET imaging.
  • 60. Transmission scan method • Was used before the advent of PET/CT • Ist a blank scan is obtained without any object or patient • Next a transmission scan is obtained for each patient. • Then the ratios of counts in each pixel between the blank scan and the transmission scan are calculated for each patient. • Then the emission scan is taken similar to transmission scan and each pixel (each LOR) is corrected for attenuation by applying the corresponding ratio. • Normally transmission scan takes 20-40 minutes for acquisition.
  • 61. CT transmission scan method • Similar to Transmission scan method however CT transmission data is used instead for PET and is done within minutes. • Ratio of blank scan to CT transmission scan is used to generate “attenuation correction map”. • Factors from attenuation correction map is applied to each patient’s emission scan. • As the CT data is from ~70KeV x-ray, it is scaled up to match the 511-KeV photons by applying a “scaling factor”. • Scaling factor is assumed to be same for all tissues except Bone as it has higher mass attenuation coefficient. • Respiratory motion of the thorax and IV contrast agents affect the CT attenuation factors.
  • 62. Attenuation correction in PET/MR • Two methods : 1. Segmentation method 2. Atlas based method • In segmentation method, a transmission scan is obtained using rotating 68Ge source or a CT scan to generate an attenuation map. • This is then coregistered with MR images( commonly T₁W as it is best for delineating anatomy). • Then the MR image is segmented into different types of tissues and appropriate linear attenuation coefficient (μ) is then applied to these tissues.
  • 63. • In Atlas based method, a ‘Template MR image’ is generated from the average of co-registered MR images from multiple subjects(atlas). • This template MR image is then coregistered with the MR image of a patient , a patient specific attenuation map is obtained. • Useful in correction in brain images.
  • 64. Random coincidence correction • Random events increase with increasing pulse-height window, coincidence time window, and activity. 1.Correction can be made by Rc=2τR1R2 where R1 & R2 is single count rates of a radioactive source at each of the detector pair, τ is the coincidence timing window 2.Another method is via taking a very high radioactive source and scanning it over a time till the radioactivity is reduced to such low level that no random event is recorded. Then the random event is calculated by subtracting the low activity count from the high activity count. 3. By subtracting the standard coincidence timing window count from the delayed timing window count.
  • 65. Scatter coincidences • High energy(511 KeV) annihilation photons may undergo Compton scattering while passing through the body tissue without much loss of energy. May also occur in detector itself. • Scattering increases with density and depth of the tissue, density of the detector material, the activity and the pulse height window. Causes increased background and decreased image contrast. • Correction can be done via: a. Two energy window method b. Theoretical model of scatter events c. Convolution method d. Monte carlo calculation e. Narrowing the pulse height window
  • 66. Dead time • Correction can be done via measuring the observed count rates as a function of increasing concentrations of activity. • Dead time is calculated from these data and then applied to actual patient’s data. • High speed electronics, buffers and pulse pile–up rejection circuits improve dead time loss.
  • 67. Radial elongation/Parallax error/Radial astigmatism • Causes blurring of image. • Here an off centre event strikes the back of the detector pair tangentially . • The X-,Y- positioning of the detectors is a distance away from the actual location of annihilation. • Increases with thicker detector and LOR’s distance from CFOV. • Using large diameter ring improves this effect.
  • 68.
  • 69. Performance measures of PET • These include: a. Spatial resolution b. Sensitivity c. Noise equivalent count rate (NECR) d. Scatter fraction e. Energy resolution at 511 KeV
  • 70. Spatial resolution • Represents the ability to disentangle two close point sources. • Defined by several factors such as: Detector size: determines intrinsic resolution(Ri), most imp. factor is crystal width(d).
  • 71. Spatial resolution Positron range (Rp): distance between location of positron emission and annihilation event. It increases with positron energy and decreases with tissue density. Results in blurring of image. 0.2 mm for 18F in tissue. Non-collinearity(Ra): the two annihilation photons are not emitted exactly at 180o (LOR). Maximum deviation is + - 0.25o.
  • 72. Spatial resolution Reconstruction method: FBP filter degrades it, Kr is around 1.2-1.5 Location of the Detector(Rl) : Block detector cause error in positioning(X,Y) of detector pair more than single detectors. • Combining all these factors, the spatial resolution of PET is given by 𝑅 = 𝐾𝑟 × 𝑅𝑖2 + 𝑅𝑝2 + 𝑅𝑎2 + 𝑅𝑙2 • Transverse spatial resolution ranges from 4-5 mm at 1 cm and is best at CFOV. • Axial spatial resolution from 5-6 mm at 1 cm.
  • 73. Sensitivity • Defined as number of counts per unit time for each unit of activity. Given as cps/MBq or cps/μCi. • Depends on : a. Geometric efficiency b. Detection efficiency of the detector c. Pulse height window d. Dead time of the detector • Sensitivity increases with number of rings in scanner. • Sensitivity in 3-D acquisition >> 2-D acquisition.
  • 74. Sensitivity • Sensitivity (S) of a single ring detector is given by 𝑆 = 𝐴⋅ ε2⋅е−μt⋅3.7×10⁴ π𝐷2 (cps/μCi) • A=detector area seen by a point source to be imaged, ε= detector efficiency, μ= linear attenuation coefficient of 511 KeV photons in detector material, t = thickness of the detector, D= diameter of the ring
  • 75. Noise equivalent count rate • Noise degrades image quality and is primarily due to statistical variation in count rates. It is given by 1 N , where N is the count density. • To minimize Noise, NECR is to be maximized. 𝑁𝐸𝐶𝑅 = 𝑇2 𝑇+𝑆+𝑅 where T,S &R are the True, Scatter and Random coincidences.
  • 76. Quality control in PET Daily Weekly Quarterly Annually PMT baseline check and gain adjustment Uniformity check Preventive maintenance NEMA NU-2 testing: • Spatial resolution • Sensitivity • Intrinsic scatter fraction • Scatter correction • Count rate performance Blank adjustment Well counter calibration check Detector efficiency/Normalization scan Update of normalization factors and well counter calibration Uniform cylinder or point source scan (Sinogram) Coincidence timing check Cross calibration Energy window calibration
  • 77. Sinogram check • Done daily before the patient study. • Done using a standard 20 cm long 68Ge source placed in the CFOV both vertically and horizontally so that uniform exposure of radiation occurs to all the detectors. Carried out via software. • This daily sinogram is compared (via “average variance”)to the reference blank scan obtained during the last setup of scanner. • If average variance >2.5, Recalibration is needed. • And if it exceeds >5.0, manufacturers service is warranted.
  • 78. Quality control in MR Scanner • These are performed using a specifically designed phantom c/a ACR phantom. • This phantom is filled with water solution of various paramagnetic ions such as Manganese, Nickel & Copper and is positioned at the centre of the magnet. • Scanning is done with preset scanning parameters such as : a. Pulse sequence b. Timing parameters (TR,TI & TE) c. Flip angle d. Matrix size e. Field of view f. RF power setting g. Slice thickness h. Number of acquisition
  • 79.
  • 80. Accreditation of nuclear medicine facilities • Given by two major organizations in US: The American college of radiology(ACR) Intersocietal commission on Accreditation for nuclear medicine laboratories(ICANL) • In india accreditation is given by Atomic energy regulatory board(AERB) and National Accreditation Board for Testing and Calibration Laboratories (NABL)

Editor's Notes

  1. B1 is an oscillating electromagnetic field. Nuclei absorb energy from B1 and transit to high energy state if B1 is at precessional/motion/resonant frequency.
  2. Phase coherence: magnetization vectors of all neighbouring nuclei point to the same direction with maximum magnetization.
  3. Line of response(LOR): the two annihilation photons are detected in coincidence by two opposite detectors along a straight line, c/a LOR
  4. Scaling factor is the ratio of mass attenuation coefficient of 511-KeV photons to 70-KeV photons.