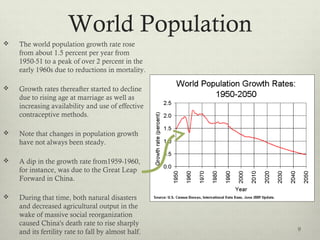
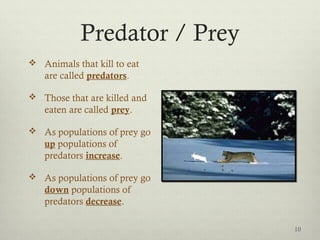
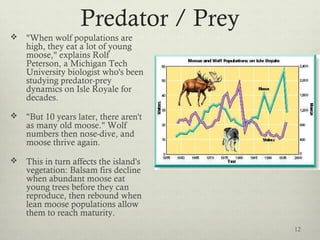
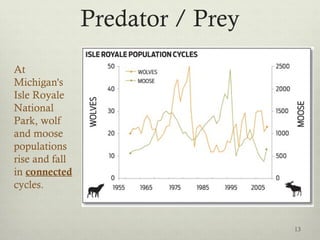
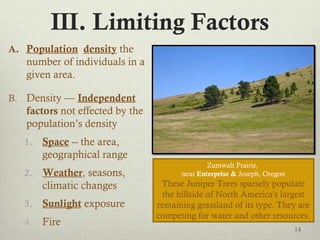
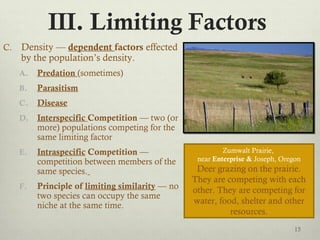
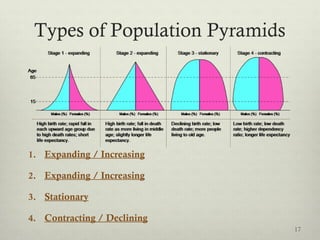
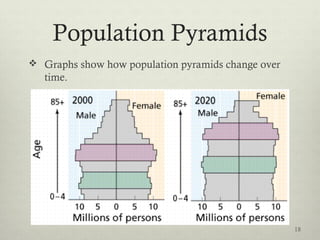
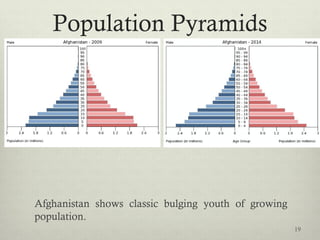
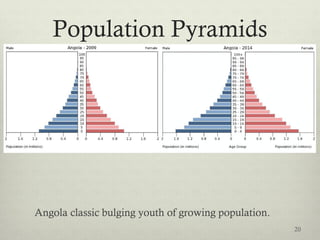
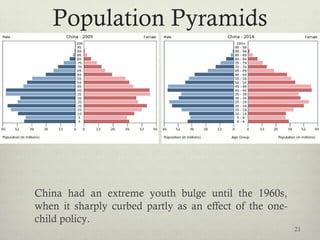
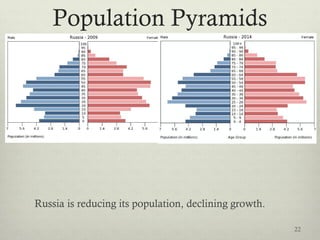
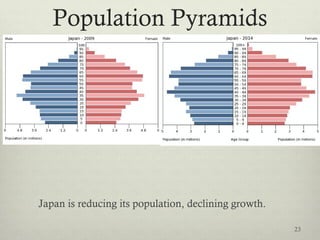
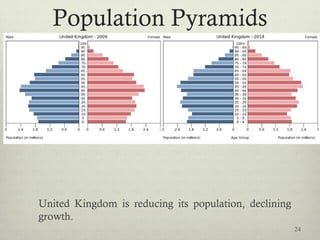
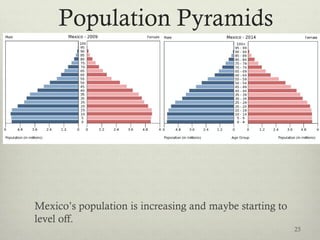
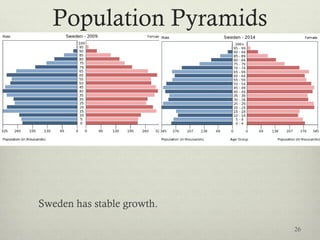
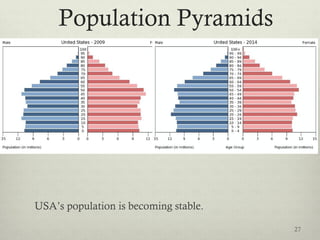
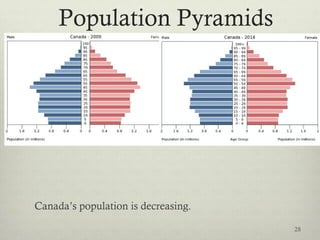
PopulationPopulation
BiologyBiology
1
I. Populations
A. Niche — ecological
role of a species in a
community.
B. Two different species
cannot occupy the
same niche.
C. Habitat — where an
organism lives.
Stream habitat
2
I. Populations
D. A population is a group of
organisms that can
interbreed (same species).
E. The largest size a
population can grow
under ideal conditions is
called biotic potential.
F. Factors acting to
decreased or limit the size
of a population are called
limiting factors.
Black Sea Nettle Jellyfish
@ Monterey Bay Aquarium
Members of a population can
interbreed.
3
I. Populations
G. Examples of
limiting factors are:
1) Water (a)
2) Sunlight (a)
3) Temperature (a)
4) Predators (b)
5) Salinity (a)
6) Disease (b)
7) Competition (b)
8) Food (b) Lava Lake, Oregon
Plants compete for water, sunlight, space and
deal with predation from fish, birds, & man.
4
II Population Growth Curves
 We measure the size of
a population (number of
individuals) over time.
 When this is graphed it
forms a curve called the
population growth
curve.
China Hat, near Bend, Oregon
Plants compete for water, nutrients, sunlight,
space and deal with predation from mammals
(including man) & birds. 5
II. Population Growth Curves
A. Increase of population size over time.
B. Unrestrictive growth results in exponential growth
represented by a J-curve.
C. Forms a characteristic curve called an S-curve.
B C
6
II. Population Growth Curves
D. The curve is due to a change in the amount of growth
over time.
E. The highest point in the curve is the environment's
carrying capacity. This is the number of individuals
that can live in that space.
E
7
II. Population Growth Curves
F. At this point the natality rate (# born) & mortality
rate (# dying) are equal.
G. A combination of all limiting factors is called the
environmental resistance.
F
8
World Population
 The world population growth rate rose
from about 1.5 percent per year from
1950-51 to a peak of over 2 percent in the
early 1960s due to reductions in mortality.
 Growth rates thereafter started to decline
due to rising age at marriage as well as
increasing availability and use of effective
contraceptive methods.
 Note that changes in population growth
have not always been steady.
 A dip in the growth rate from1959-1960,
for instance, was due to the Great Leap
Forward in China.
 During that time, both natural disasters
and decreased agricultural output in the
wake of massive social reorganization
caused China's death rate to rise sharply
and its fertility rate to fall by almost half. 9
Predator / Prey
 Animals that kill to eat
are called predators.
 Those that are killed and
eaten are called prey.
 As populations of prey go
up populations of
predators increase.
 As populations of prey go
down populations of
predators decrease.
10
Predator / Prey
11
Predator / Prey
 "When wolf populations are
high, they eat a lot of young
moose," explains Rolf
Peterson, a Michigan Tech
University biologist who's been
studying predator-prey
dynamics on Isle Royale for
decades.
 "But 10 years later, there aren't
as many old moose." Wolf
numbers then nose-dive, and
moose thrive again.
 This in turn affects the island's
vegetation: Balsam firs decline
when abundant moose eat
young trees before they can
reproduce, then rebound when
lean moose populations allow
them to reach maturity.
12
Predator / Prey
At
Michigan's
Isle Royale
National
Park, wolf
and moose
populations
rise and fall
in connected
cycles.
13
III. Limiting Factors
A. Population density the
number of individuals in a
given area.
B. Density — Independent
factors not effected by the
population’s density
1. Space -- the area,
geographical range
2. Weather, seasons,
climatic changes
3. Sunlight exposure
4. Fire
14
Zumwalt Prairie,
near Enterprise & Joseph, Oregon
These Juniper Trees sparsely populate
the hillside of North America's largest
remaining grassland of its type. They are
competing for water and other resources.
III. Limiting Factors
C. Density — dependent factors effected
by the population’s density.
A. Predation (sometimes)
B. Parasitism
C. Disease
D. Interspecific Competition — two (or
more) populations competing for the
same limiting factor
E. Intraspecific Competition —
competition between members of the
same species.
F. Principle of limiting similarity — no
two species can occupy the same
niche at the same time.
15
Zumwalt Prairie,
near Enterprise & Joseph, Oregon
Deer grazing on the prairie.
They are competing with each
other. They are competing for
water, food, shelter and other
resources.
Interspecific & Intraspecific
Competition
Zumwalt Prairie,
near Enterprise & Joseph, Oregon
Top: Deer graze on the
prairie. They are
competing with each
other and the elk (when
in wooded area, not
often).
Below: Elk move across road
a few miles away from
the deer in a wooded
area. They are competing
the deer (when on prairie,
not often). 16
Types of Population Pyramids
1. Expanding / Increasing
2. Expanding / Increasing
3. Stationary
4. Contracting / Declining
17
Population Pyramids
 Graphs show how population pyramids change over
time.
18
Population Pyramids
Afghanistan shows classic bulging youth of growing
population.
19
Population Pyramids
Angola classic bulging youth of growing population.
20
Population Pyramids
China had an extreme youth bulge until the 1960s,
when it sharply curbed partly as an effect of the one-
child policy.
21
Population Pyramids
Russia is reducing its population, declining growth.
22
Population Pyramids
Japan is reducing its population, declining growth.
23
Population Pyramids
United Kingdom is reducing its population, declining
growth.
24
Population Pyramids
Mexico’s population is increasing and maybe starting to
level off.
25
Population Pyramids
Sweden has stable growth.
26
Population Pyramids
USA’s population is becoming stable.
27
Population Pyramids
Canada’s population is decreasing.
28
Current Population
 http://www.prb.org/Publications/Articles/2014/wpd
s-2014-pyramids.aspx
29
Human Population 2009
U.S. 307,866,146
World 6,795,124,089
19:33 UTC (EST+5) Nov 05, 2009
30
Human Population 2014
31http://www.census.gov/popclock/
8:17:30 UTC

Populations Biology 2014

  • 1.
  • 2.
    I. Populations A. Niche— ecological role of a species in a community. B. Two different species cannot occupy the same niche. C. Habitat — where an organism lives. Stream habitat 2
  • 3.
    I. Populations D. Apopulation is a group of organisms that can interbreed (same species). E. The largest size a population can grow under ideal conditions is called biotic potential. F. Factors acting to decreased or limit the size of a population are called limiting factors. Black Sea Nettle Jellyfish @ Monterey Bay Aquarium Members of a population can interbreed. 3
  • 4.
    I. Populations G. Examplesof limiting factors are: 1) Water (a) 2) Sunlight (a) 3) Temperature (a) 4) Predators (b) 5) Salinity (a) 6) Disease (b) 7) Competition (b) 8) Food (b) Lava Lake, Oregon Plants compete for water, sunlight, space and deal with predation from fish, birds, & man. 4
  • 5.
    II Population GrowthCurves  We measure the size of a population (number of individuals) over time.  When this is graphed it forms a curve called the population growth curve. China Hat, near Bend, Oregon Plants compete for water, nutrients, sunlight, space and deal with predation from mammals (including man) & birds. 5
  • 6.
    II. Population GrowthCurves A. Increase of population size over time. B. Unrestrictive growth results in exponential growth represented by a J-curve. C. Forms a characteristic curve called an S-curve. B C 6
  • 7.
    II. Population GrowthCurves D. The curve is due to a change in the amount of growth over time. E. The highest point in the curve is the environment's carrying capacity. This is the number of individuals that can live in that space. E 7
  • 8.
    II. Population GrowthCurves F. At this point the natality rate (# born) & mortality rate (# dying) are equal. G. A combination of all limiting factors is called the environmental resistance. F 8
  • 9.
    World Population  Theworld population growth rate rose from about 1.5 percent per year from 1950-51 to a peak of over 2 percent in the early 1960s due to reductions in mortality.  Growth rates thereafter started to decline due to rising age at marriage as well as increasing availability and use of effective contraceptive methods.  Note that changes in population growth have not always been steady.  A dip in the growth rate from1959-1960, for instance, was due to the Great Leap Forward in China.  During that time, both natural disasters and decreased agricultural output in the wake of massive social reorganization caused China's death rate to rise sharply and its fertility rate to fall by almost half. 9
  • 10.
    Predator / Prey Animals that kill to eat are called predators.  Those that are killed and eaten are called prey.  As populations of prey go up populations of predators increase.  As populations of prey go down populations of predators decrease. 10
  • 11.
  • 12.
    Predator / Prey "When wolf populations are high, they eat a lot of young moose," explains Rolf Peterson, a Michigan Tech University biologist who's been studying predator-prey dynamics on Isle Royale for decades.  "But 10 years later, there aren't as many old moose." Wolf numbers then nose-dive, and moose thrive again.  This in turn affects the island's vegetation: Balsam firs decline when abundant moose eat young trees before they can reproduce, then rebound when lean moose populations allow them to reach maturity. 12
  • 13.
    Predator / Prey At Michigan's IsleRoyale National Park, wolf and moose populations rise and fall in connected cycles. 13
  • 14.
    III. Limiting Factors A.Population density the number of individuals in a given area. B. Density — Independent factors not effected by the population’s density 1. Space -- the area, geographical range 2. Weather, seasons, climatic changes 3. Sunlight exposure 4. Fire 14 Zumwalt Prairie, near Enterprise & Joseph, Oregon These Juniper Trees sparsely populate the hillside of North America's largest remaining grassland of its type. They are competing for water and other resources.
  • 15.
    III. Limiting Factors C.Density — dependent factors effected by the population’s density. A. Predation (sometimes) B. Parasitism C. Disease D. Interspecific Competition — two (or more) populations competing for the same limiting factor E. Intraspecific Competition — competition between members of the same species. F. Principle of limiting similarity — no two species can occupy the same niche at the same time. 15 Zumwalt Prairie, near Enterprise & Joseph, Oregon Deer grazing on the prairie. They are competing with each other. They are competing for water, food, shelter and other resources.
  • 16.
    Interspecific & Intraspecific Competition ZumwaltPrairie, near Enterprise & Joseph, Oregon Top: Deer graze on the prairie. They are competing with each other and the elk (when in wooded area, not often). Below: Elk move across road a few miles away from the deer in a wooded area. They are competing the deer (when on prairie, not often). 16
  • 17.
    Types of PopulationPyramids 1. Expanding / Increasing 2. Expanding / Increasing 3. Stationary 4. Contracting / Declining 17
  • 18.
    Population Pyramids  Graphsshow how population pyramids change over time. 18
  • 19.
    Population Pyramids Afghanistan showsclassic bulging youth of growing population. 19
  • 20.
    Population Pyramids Angola classicbulging youth of growing population. 20
  • 21.
    Population Pyramids China hadan extreme youth bulge until the 1960s, when it sharply curbed partly as an effect of the one- child policy. 21
  • 22.
    Population Pyramids Russia isreducing its population, declining growth. 22
  • 23.
    Population Pyramids Japan isreducing its population, declining growth. 23
  • 24.
    Population Pyramids United Kingdomis reducing its population, declining growth. 24
  • 25.
    Population Pyramids Mexico’s populationis increasing and maybe starting to level off. 25
  • 26.
  • 27.
  • 28.
  • 29.
  • 30.
    Human Population 2009 U.S.307,866,146 World 6,795,124,089 19:33 UTC (EST+5) Nov 05, 2009 30
  • 31.