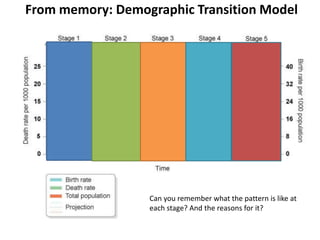
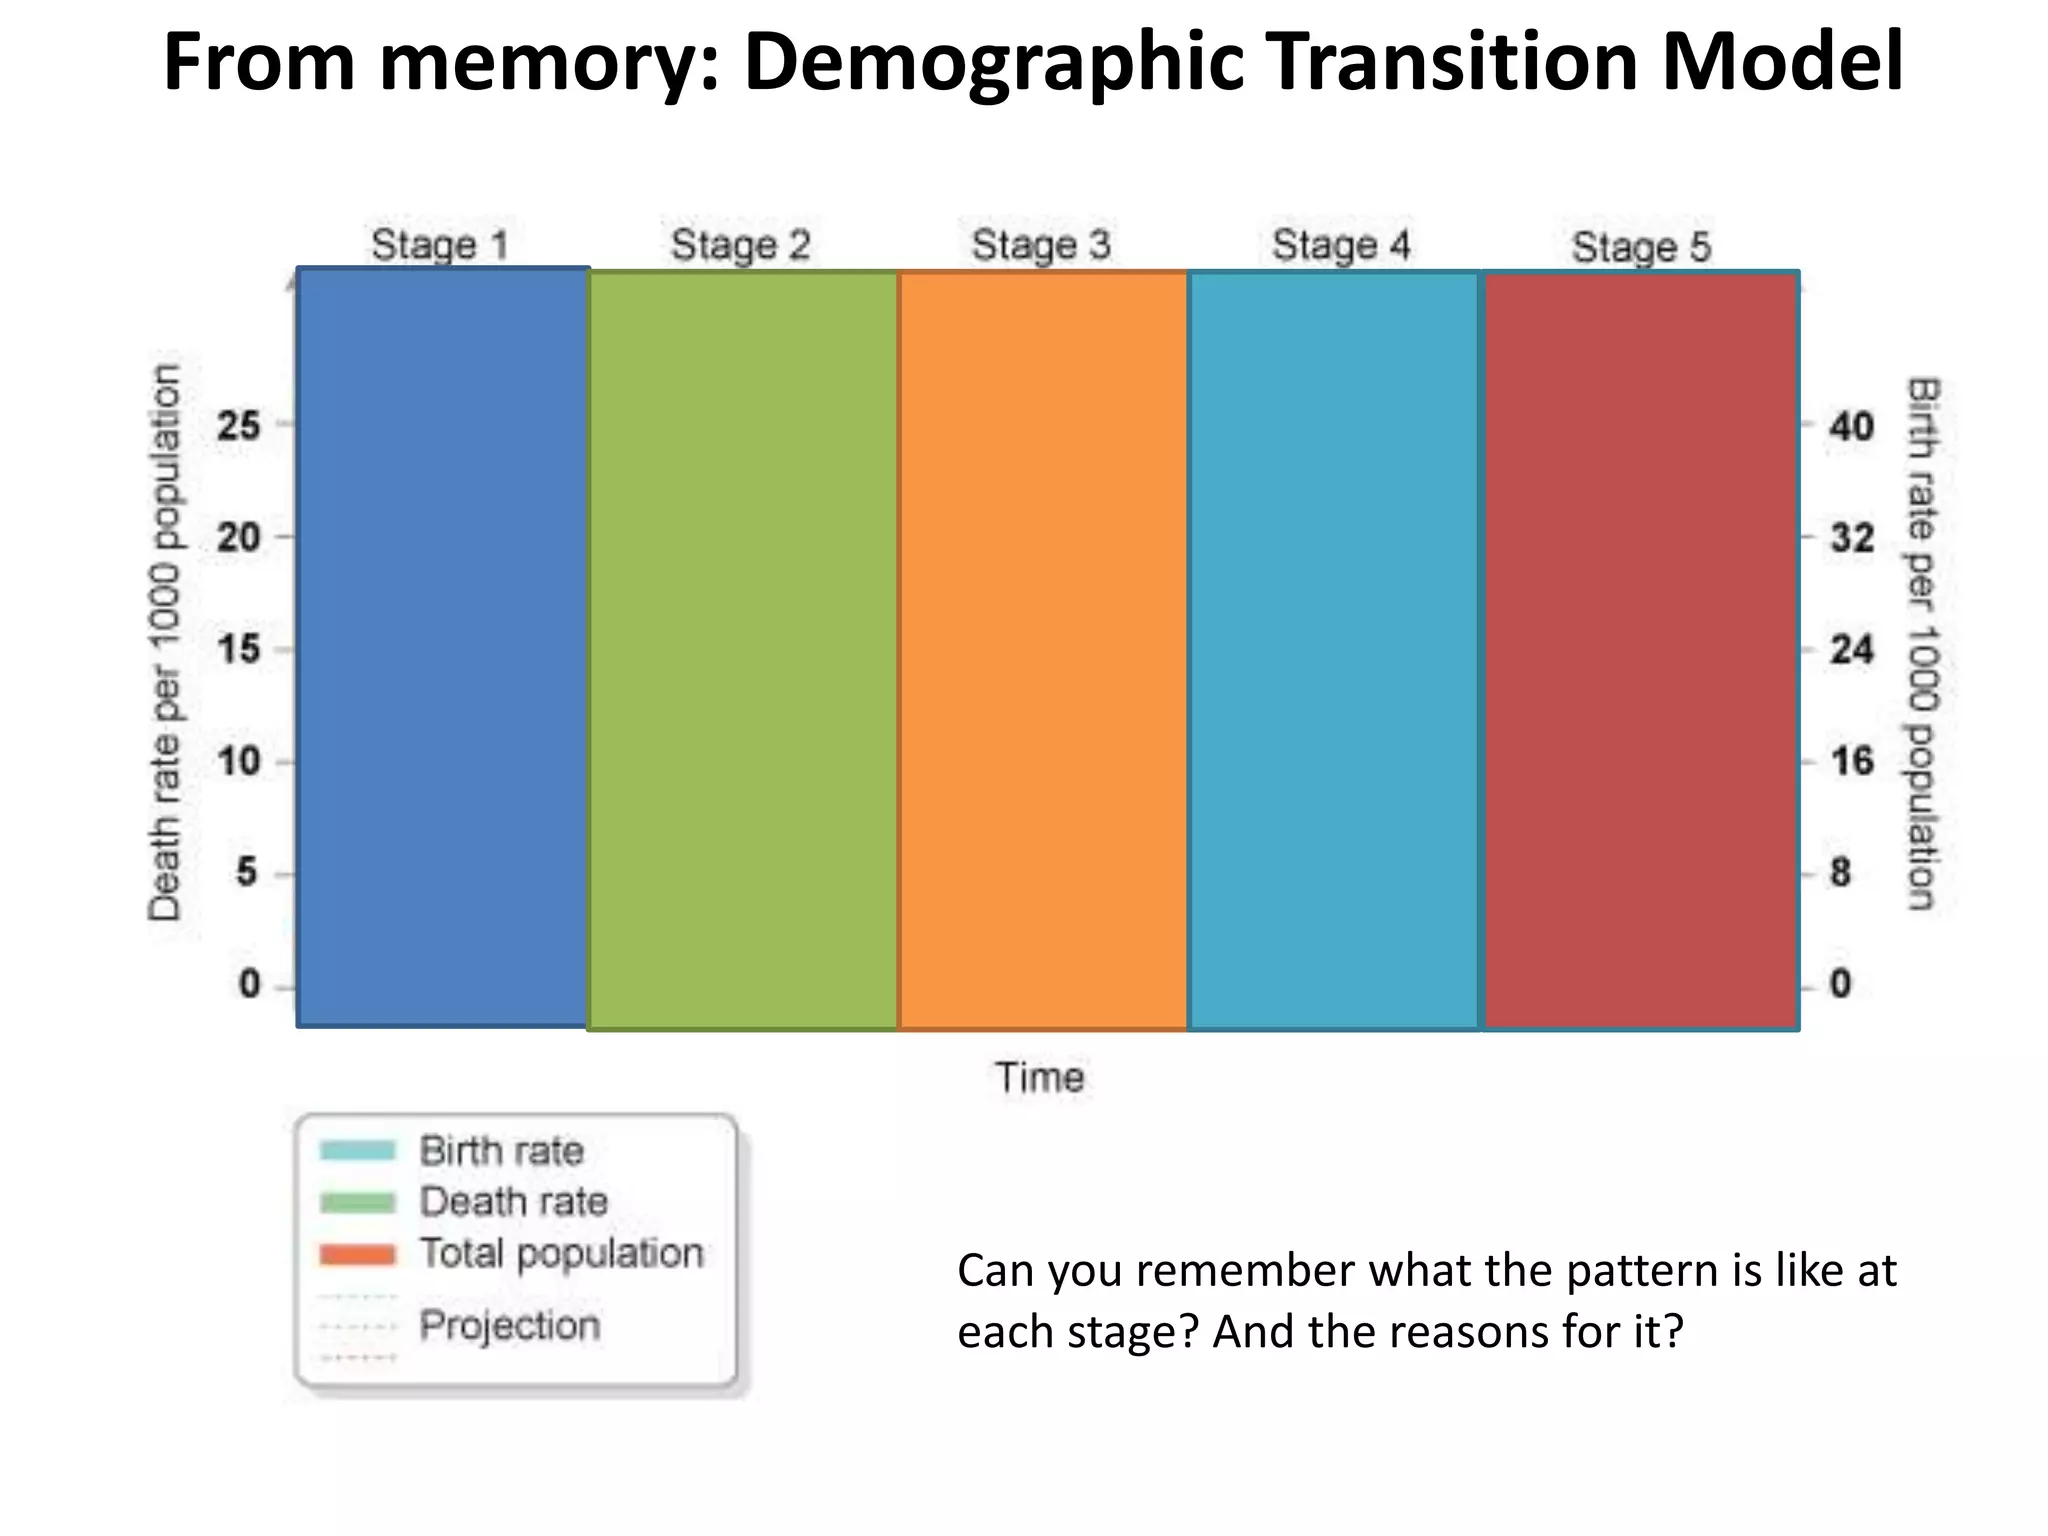
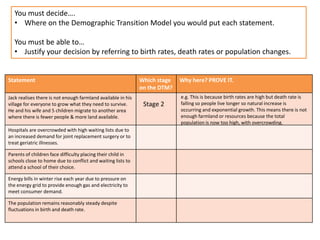
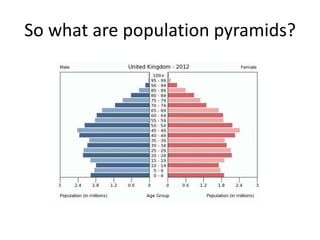
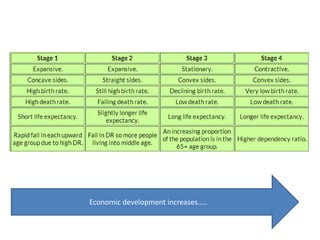
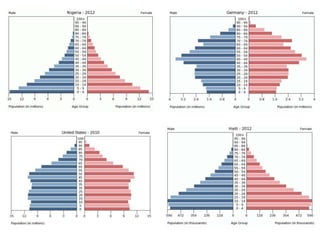
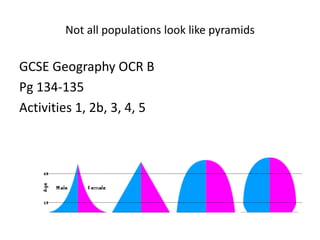
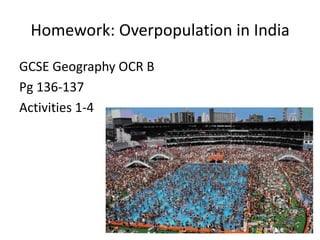
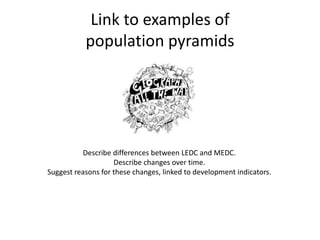
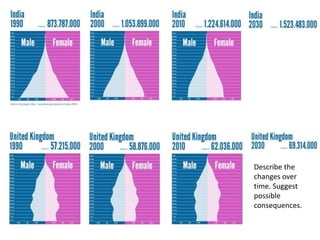
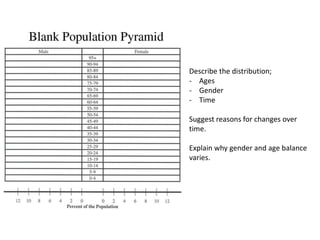
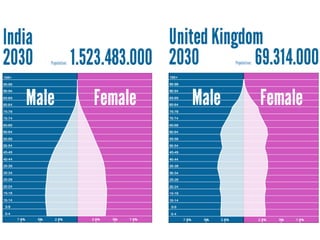
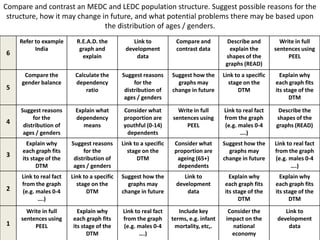
From memory: Demographic Transition Model
Can you remember what the pattern is like at
each stage? And the reasons for it?
Statement Which stage
on the DTM?
Why here? PROVE IT.
Jack realises there is not enough farmland available in his
village for everyone to grow what they need to survive.
He and his wife and 5 children migrate to another area
where there is fewer people & more land available.
Hospitals are overcrowded with high waiting lists due to
an increased demand for joint replacement surgery or to
treat geriatric illnesses.
Parents of children face difficulty placing their child in
schools close to home due to conflict and waiting lists to
attend a school of their choice.
Energy bills in winter rise each year due to pressure on
the energy grid to provide enough gas and electricity to
meet consumer demand.
The population remains reasonably steady despite
fluctuations in birth and death rate.
You must decide….
• Where on the Demographic Transition Model you would put each statement.
You must be able to…
• Justify your decision by referring to birth rates, death rates or population changes.
e.g. This is because birth rates are high but death rate is
falling so people live longer so natural increase is
occurring and exponential growth. This means there is not
enough farmland or resources because the total
population is now too high, with overcrowding.
Stage 2
What is this?
How and why does the age and gender
structure of populations vary?
Population Pyramids,
comparisons of LEDC’s v’s MEDC’s
and changes over time
So what are population pyramids?
• http://www.youtube.com/watch?v=sSoSYm4A
Ols
Economic development increases…..
Not all populations look like pyramids
GCSE Geography OCR B
Pg 134-135
Activities 1, 2b, 3, 4, 5
Homework: Overpopulation in India
GCSE Geography OCR B
Pg 136-137
Activities 1-4
Link to examples of
population pyramids
Describe differences between LEDC and MEDC.
Describe changes over time.
Suggest reasons for these changes, linked to development indicators.
Describe the
changes over
time. Suggest
possible
consequences.
Describe the distribution;
- Ages
- Gender
- Time
Suggest reasons for changes over
time.
Explain why gender and age balance
varies.
Write a postcard or love letter between the MEDC-
LEDC 2030 pyramids.
Must include reference to:
Birth rate
Death rate
Migration
Dependency ratio
Infant mortality
Life expectancy
Gender balance
Compare your quality of life.
6
Refer to example
India
R.E.A.D. the
graph and
explain
Link to
development
data
Compare and
contrast data
Describe and
explain the
shapes of the
graphs (READ)
Write in full
sentences using
PEEL
5
Compare the
gender balance
Calculate the
dependency
ratio
Suggest reasons
for the
distribution of
ages / genders
Suggest how the
graphs may
change in future
Link to a specific
stage on the
DTM
Explain why
each graph fits
its stage of the
DTM
4
Suggest reasons
for the
distribution of
ages / genders
Explain what
dependency
means
Consider what
proportion are
youthful (0-14)
dependents
Write in full
sentences using
PEEL
Link to real fact
from the graph
(e.g. males 0-4
….)
Describe the
shapes of the
graphs (READ)
3
Explain why
each graph fits
its stage of the
DTM
Suggest reasons
for the
distribution of
ages / genders
Link to a specific
stage on the
DTM
Consider what
proportion are
ageing (65+)
dependents
Suggest how the
graphs may
change in future
Link to real fact
from the graph
(e.g. males 0-4
….)
2
Link to real fact
from the graph
(e.g. males 0-4
….)
Link to a specific
stage on the
DTM
Suggest how the
graphs may
change in future
Link to
development
data
Explain why
each graph fits
its stage of the
DTM
Explain why
each graph fits
its stage of the
DTM
1
Write in full
sentences using
PEEL
Explain why
each graph fits
its stage of the
DTM
Link to real fact
from the graph
(e.g. males 0-4
….)
Include key
terms, e.g. infant
mortality, etc,.
Consider the
impact on the
national
economy
Link to
development
data
Compare and contrast an MEDC and LEDC population structure. Suggest possible reasons for the
structure, how it may change in future, and what potential problems there may be based upon
the distribution of ages / genders.

Population lesson 5

  • 1.
    From memory: DemographicTransition Model Can you remember what the pattern is like at each stage? And the reasons for it?
  • 2.
    Statement Which stage onthe DTM? Why here? PROVE IT. Jack realises there is not enough farmland available in his village for everyone to grow what they need to survive. He and his wife and 5 children migrate to another area where there is fewer people & more land available. Hospitals are overcrowded with high waiting lists due to an increased demand for joint replacement surgery or to treat geriatric illnesses. Parents of children face difficulty placing their child in schools close to home due to conflict and waiting lists to attend a school of their choice. Energy bills in winter rise each year due to pressure on the energy grid to provide enough gas and electricity to meet consumer demand. The population remains reasonably steady despite fluctuations in birth and death rate. You must decide…. • Where on the Demographic Transition Model you would put each statement. You must be able to… • Justify your decision by referring to birth rates, death rates or population changes. e.g. This is because birth rates are high but death rate is falling so people live longer so natural increase is occurring and exponential growth. This means there is not enough farmland or resources because the total population is now too high, with overcrowding. Stage 2
  • 3.
  • 4.
    How and whydoes the age and gender structure of populations vary? Population Pyramids, comparisons of LEDC’s v’s MEDC’s and changes over time
  • 6.
    So what arepopulation pyramids?
  • 7.
  • 8.
  • 10.
    Not all populationslook like pyramids GCSE Geography OCR B Pg 134-135 Activities 1, 2b, 3, 4, 5
  • 11.
    Homework: Overpopulation inIndia GCSE Geography OCR B Pg 136-137 Activities 1-4
  • 12.
    Link to examplesof population pyramids Describe differences between LEDC and MEDC. Describe changes over time. Suggest reasons for these changes, linked to development indicators.
  • 14.
    Describe the changes over time.Suggest possible consequences.
  • 15.
    Describe the distribution; -Ages - Gender - Time Suggest reasons for changes over time. Explain why gender and age balance varies.
  • 17.
    Write a postcardor love letter between the MEDC- LEDC 2030 pyramids. Must include reference to: Birth rate Death rate Migration Dependency ratio Infant mortality Life expectancy Gender balance Compare your quality of life.
  • 18.
    6 Refer to example India R.E.A.D.the graph and explain Link to development data Compare and contrast data Describe and explain the shapes of the graphs (READ) Write in full sentences using PEEL 5 Compare the gender balance Calculate the dependency ratio Suggest reasons for the distribution of ages / genders Suggest how the graphs may change in future Link to a specific stage on the DTM Explain why each graph fits its stage of the DTM 4 Suggest reasons for the distribution of ages / genders Explain what dependency means Consider what proportion are youthful (0-14) dependents Write in full sentences using PEEL Link to real fact from the graph (e.g. males 0-4 ….) Describe the shapes of the graphs (READ) 3 Explain why each graph fits its stage of the DTM Suggest reasons for the distribution of ages / genders Link to a specific stage on the DTM Consider what proportion are ageing (65+) dependents Suggest how the graphs may change in future Link to real fact from the graph (e.g. males 0-4 ….) 2 Link to real fact from the graph (e.g. males 0-4 ….) Link to a specific stage on the DTM Suggest how the graphs may change in future Link to development data Explain why each graph fits its stage of the DTM Explain why each graph fits its stage of the DTM 1 Write in full sentences using PEEL Explain why each graph fits its stage of the DTM Link to real fact from the graph (e.g. males 0-4 ….) Include key terms, e.g. infant mortality, etc,. Consider the impact on the national economy Link to development data Compare and contrast an MEDC and LEDC population structure. Suggest possible reasons for the structure, how it may change in future, and what potential problems there may be based upon the distribution of ages / genders.

Editor's Notes

  • #2 Sketch from memory, reveal section-by-section and discuss
  • #3 Pairs
  • #7 Intro, discuss, practice READ
  • #9 Match up the pyramids on next slide to the descriptions.
  • #10 Match up to descriptions on previous slide
  • #13 http://www.geographyalltheway.com/in/gcse-popn/population_pyramids.htmMember log in required
  • #14 Watch DVD (28mins), pupils to take notes under subheadings shown in menu screen above. Worksheet activities (5) following DVD.
  • #15 http://populationpyramid.net
  • #16 Link to YouTube clip of UK population pyramid over time (source ONS) http://www.youtube.com/watch?v=YILD506m9KU
  • #18 Eastenders dramatic ending http://www.youtube.com/watch?v=GnbH2XvCN7cSplit class in half: half represent LEDC and write to other half in MEDC.
  • #19 Learning grid. Print out between two.Roll 2 dice…these give a coordinate. Students to roll the dice to get at least three coordinates and then include these in their writing.