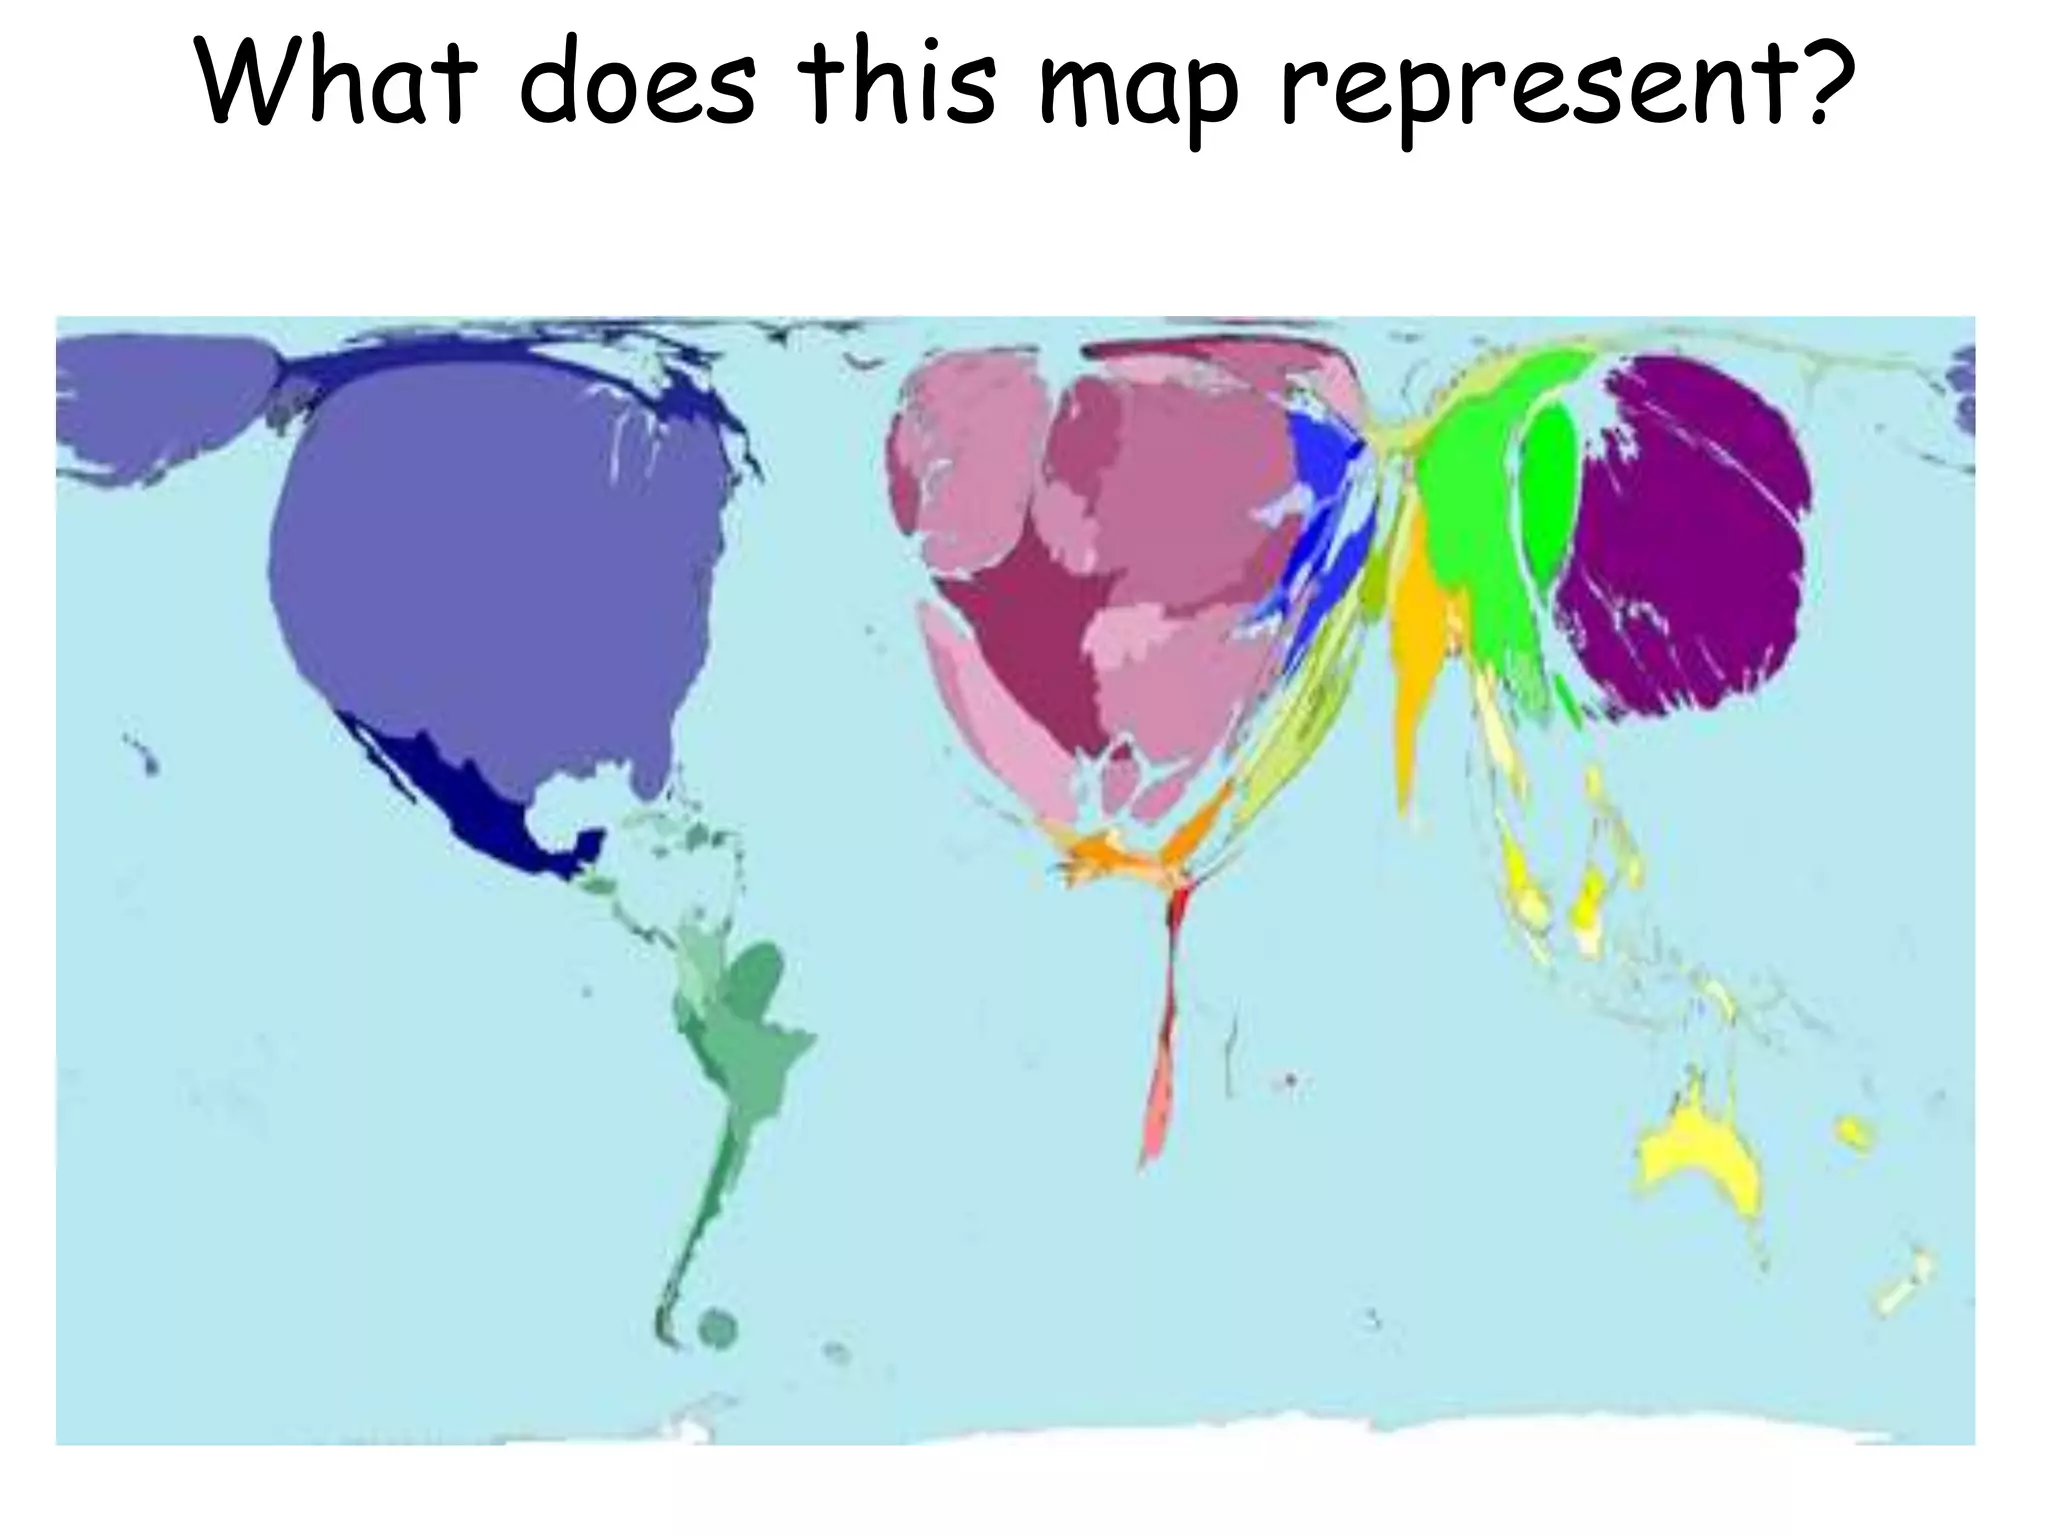
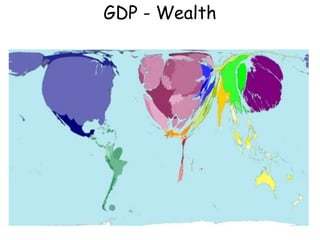
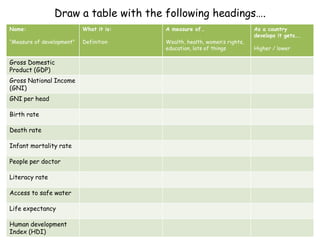
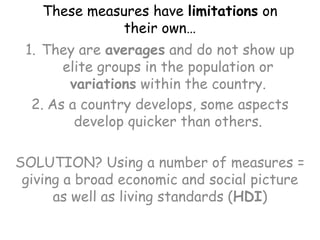
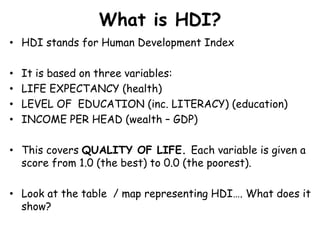
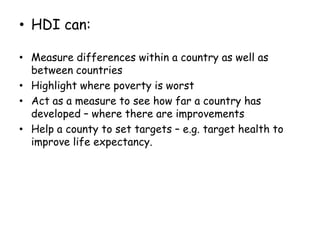
What does this map represent?
GDP - Wealth
How is it different to this one?Voters turnout…
The Development GapOur last topic but one of the hardest!
What does DEVELOPMENT mean?Watch the video here and think about a definition….What did you get?
Definition:When a country develops, it basically GETS BETTER for the people living there – their quality of life improves (e.g. their wealth, health and safety). There is no one indicator we can look at.The level of development is different in different countries, e.g. the UK is more developed than Afghanistan.
How can we measure development?Development is hard to measure because it includes so many thing. However, we can use MEASURES OF DEVELOPMENT (Indicators) to compare different countries.
Task:Time to complete the table! You MUST know each of these definitions and you will be tested on them next lesson in your teams…Match the definition to the measure, decide what it is a measure of and what does it do as the country develops…..
Draw a table with the following headings….
The answers are…
Which are the best measures of development, in your opinion?Some examples:Birth rate: excellent – shows education levels as well….
Choropleth MapsChoropleth maps show how something varies between different areas using colours or patterns.The darker the colour, the higher the value….Use the key to work out pattern, then interpret using skills from controlled assessment…. Try the question
Death rate: poor – most countries d.r are low GNP / GNI – poor - only economic
These measures have limitations on their own…They are averages and do not show up elite groups in the population or variations within the country.As a country develops, some aspects develop quicker than others.SOLUTION? Using a number of measures = giving a broad economic and social picture as well as living standards (HDI)
What is HDI?HDI stands for Human Development IndexIt is based on three variables:LIFE EXPECTANCY (health)LEVEL OF  EDUCATION (inc. LITERACY) (education)INCOME PER HEAD (wealth – GDP)This covers QUALITY OF LIFE. Each variable is given a score from 1.0 (the best) to 0.0 (the poorest). Look at the table  / map representing HDI…. What does it show?
HDI can:Measure differences within a country as well as between countriesHighlight where poverty is worstAct as a measure to see how far a country has developed – where there are improvementsHelp a county to set targets – e.g. target health to improve life expectancy.
What is the correlation (link) between different measures of development?
A SCATTERGRAPH is used to show correlations…Look at the “how to read and understand” a scatter graph sheet…
Task: Turn to page 254 – 256Do Activities 2 and 3Homework: Complete all questions in “past exam questions” pack.

Development lesson 1

  • 1.
    What does thismap represent?
  • 2.
  • 3.
    How is itdifferent to this one?Voters turnout…
  • 4.
    The Development GapOurlast topic but one of the hardest!
  • 5.
    What does DEVELOPMENTmean?Watch the video here and think about a definition….What did you get?
  • 6.
    Definition:When a countrydevelops, it basically GETS BETTER for the people living there – their quality of life improves (e.g. their wealth, health and safety). There is no one indicator we can look at.The level of development is different in different countries, e.g. the UK is more developed than Afghanistan.
  • 7.
    How can wemeasure development?Development is hard to measure because it includes so many thing. However, we can use MEASURES OF DEVELOPMENT (Indicators) to compare different countries.
  • 8.
    Task:Time to completethe table! You MUST know each of these definitions and you will be tested on them next lesson in your teams…Match the definition to the measure, decide what it is a measure of and what does it do as the country develops…..
  • 9.
    Draw a tablewith the following headings….
  • 10.
  • 11.
    Which are thebest measures of development, in your opinion?Some examples:Birth rate: excellent – shows education levels as well….
  • 12.
    Choropleth MapsChoropleth mapsshow how something varies between different areas using colours or patterns.The darker the colour, the higher the value….Use the key to work out pattern, then interpret using skills from controlled assessment…. Try the question
  • 13.
    Death rate: poor– most countries d.r are low GNP / GNI – poor - only economic
  • 14.
    These measures havelimitations on their own…They are averages and do not show up elite groups in the population or variations within the country.As a country develops, some aspects develop quicker than others.SOLUTION? Using a number of measures = giving a broad economic and social picture as well as living standards (HDI)
  • 15.
    What is HDI?HDIstands for Human Development IndexIt is based on three variables:LIFE EXPECTANCY (health)LEVEL OF EDUCATION (inc. LITERACY) (education)INCOME PER HEAD (wealth – GDP)This covers QUALITY OF LIFE. Each variable is given a score from 1.0 (the best) to 0.0 (the poorest). Look at the table / map representing HDI…. What does it show?
  • 16.
    HDI can:Measure differenceswithin a country as well as between countriesHighlight where poverty is worstAct as a measure to see how far a country has developed – where there are improvementsHelp a county to set targets – e.g. target health to improve life expectancy.
  • 17.
    What is thecorrelation (link) between different measures of development?
  • 18.
    A SCATTERGRAPH isused to show correlations…Look at the “how to read and understand” a scatter graph sheet…
  • 19.
    Task: Turn topage 254 – 256Do Activities 2 and 3Homework: Complete all questions in “past exam questions” pack.