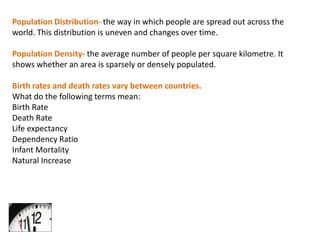
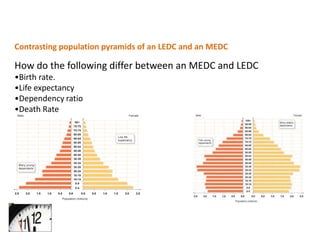
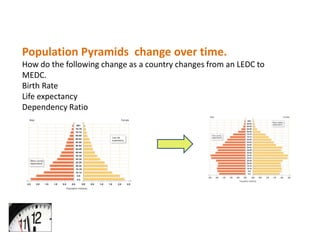
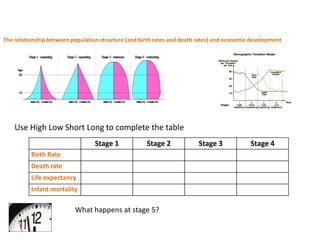
Population
To revise the topic of Population
Population Distribution- the way in which people are spread out across the
world. This distribution is uneven and changes over time.
Population Density- the average number of people per square kilometre. It
shows whether an area is sparsely or densely populated.
Birth rates and death rates vary between countries.
What do the following terms mean:
Birth Rate
Death Rate
Life expectancy
Dependency Ratio
Infant Mortality
Natural Increase
LEDC Factors increasing Factors decreasing
Birth Rate
Death Rate
-Complete these tables
The rate of population change varies over time.
The Demographic Transition Model shows population change
-How many stages does the model have?
-In which stage is Birth Rate and Death rate LOW?
-In which stage does death rate decrease rapidly?
Go to http://goo.gl/p9JTL watch “The Demographic Transition
Model”
How do the following differ between an MEDC and LEDC
•Birth rate.
•Life expectancy
•Dependency ratio
•Death Rate
Contrasting population pyramids of an LEDC and an MEDC
Population Pyramids change over time.
How do the following change as a country changes from an LEDC to
MEDC.
Birth Rate
Life expectancy
Dependency Ratio
Population Pyramids change over time.
How will the UK population pyramid change between 2007 and 2050.
The relationship between population structure (and birth rates and death rates) and economic development
Use High Low Short Long to complete the table
Stage 1 Stage 2 Stage 3 Stage 4
Birth Rate
Death rate
Life expectancy
Infant mortality
What happens at stage 5?
The effects of overpopulation in an LEDC.
The number of people living in a place outweighs the availability of resources.
Name an example of overpopulation
Why did it happen?
What were the effects?
Ageing populations
What causes an Ageing population?
How will these be affected by an ageing population?
•Pensions
•Demand for health services
•Crime Rates
List the physical and human factors that result in the
movement of people.
Consequences of Urbanisation
Complete this table of the consequences of Urbanisation for MEDC and LEDC
cities using the following:
Increase in number of Jobs in service sector; Increase in car ownership causes congestion and pollution; Clean
water, sanitation, health centres and power not available. Insufficient schools; Retail jobs lost to out of town
locations; Shanty Town development; Poor quality housing in Inner city areas (terraced, Tower blocks) Large pool
of cheap labour available for Industry; Retail parks and business parks in out of town locations; Growth in
informal sector employment; Large number of commuters cause congestion; CBD dominated by finance and
MNCs; Urban Sprawl and loss of Greenfield sites; Unemployment.
Location Housing Traffic Services Jobs
MEDC
LEDC
Management of Urbanisation.
Complete this table using the statements below to show how Urbanisation is
managed in MEDC and LEDC cities:
Rubbish recycling schemes; Improve public transport (Trams); Redevelopment; Squatters given legal title; Squatters given
legal title; Regenerate city centres for Retail; Use of Brownfield sites; Gentrification; Car +1 dedicated lanes; Park and Ride
schemes; Aided self help housing; Site and service schemes; Cycle lanes; Congestion charges; Limit number of cars; Develop
public transport
Location Housing Traffic Services Jobs
MEDC
LEDC
Causes of counter-urbanisation
Are the following Push or pull factors:
High crime rates; Pollution; Clean air; More of a community spirit; Poor services; Cheaper living; Peaceful Environment;
Retirement; Traffic congestion
Push Factors Pull Factors
The consequences of counter-urbanisation
Can you give reasons for these consequences:
Housing Traffic Services Jobs
Increase in house price
Young people forced to
leave villages
Use of Greenfield sites in
popular villages
Increase in number of cars
in village
Local shops, post offices
and garages close.
Local schools close
Decrease in number of jobs
vailable
Population
Population
Population
Population

Population

  • 1.
    Population To revise thetopic of Population
  • 2.
    Population Distribution- theway in which people are spread out across the world. This distribution is uneven and changes over time. Population Density- the average number of people per square kilometre. It shows whether an area is sparsely or densely populated. Birth rates and death rates vary between countries. What do the following terms mean: Birth Rate Death Rate Life expectancy Dependency Ratio Infant Mortality Natural Increase
  • 3.
    LEDC Factors increasingFactors decreasing Birth Rate Death Rate -Complete these tables
  • 4.
    The rate ofpopulation change varies over time. The Demographic Transition Model shows population change -How many stages does the model have? -In which stage is Birth Rate and Death rate LOW? -In which stage does death rate decrease rapidly? Go to http://goo.gl/p9JTL watch “The Demographic Transition Model”
  • 6.
    How do thefollowing differ between an MEDC and LEDC •Birth rate. •Life expectancy •Dependency ratio •Death Rate Contrasting population pyramids of an LEDC and an MEDC
  • 7.
    Population Pyramids changeover time. How do the following change as a country changes from an LEDC to MEDC. Birth Rate Life expectancy Dependency Ratio
  • 8.
    Population Pyramids changeover time. How will the UK population pyramid change between 2007 and 2050.
  • 9.
    The relationship betweenpopulation structure (and birth rates and death rates) and economic development Use High Low Short Long to complete the table Stage 1 Stage 2 Stage 3 Stage 4 Birth Rate Death rate Life expectancy Infant mortality What happens at stage 5?
  • 10.
    The effects ofoverpopulation in an LEDC. The number of people living in a place outweighs the availability of resources. Name an example of overpopulation Why did it happen? What were the effects? Ageing populations What causes an Ageing population? How will these be affected by an ageing population? •Pensions •Demand for health services •Crime Rates
  • 11.
    List the physicaland human factors that result in the movement of people.
  • 12.
    Consequences of Urbanisation Completethis table of the consequences of Urbanisation for MEDC and LEDC cities using the following: Increase in number of Jobs in service sector; Increase in car ownership causes congestion and pollution; Clean water, sanitation, health centres and power not available. Insufficient schools; Retail jobs lost to out of town locations; Shanty Town development; Poor quality housing in Inner city areas (terraced, Tower blocks) Large pool of cheap labour available for Industry; Retail parks and business parks in out of town locations; Growth in informal sector employment; Large number of commuters cause congestion; CBD dominated by finance and MNCs; Urban Sprawl and loss of Greenfield sites; Unemployment. Location Housing Traffic Services Jobs MEDC LEDC
  • 13.
    Management of Urbanisation. Completethis table using the statements below to show how Urbanisation is managed in MEDC and LEDC cities: Rubbish recycling schemes; Improve public transport (Trams); Redevelopment; Squatters given legal title; Squatters given legal title; Regenerate city centres for Retail; Use of Brownfield sites; Gentrification; Car +1 dedicated lanes; Park and Ride schemes; Aided self help housing; Site and service schemes; Cycle lanes; Congestion charges; Limit number of cars; Develop public transport Location Housing Traffic Services Jobs MEDC LEDC
  • 14.
    Causes of counter-urbanisation Arethe following Push or pull factors: High crime rates; Pollution; Clean air; More of a community spirit; Poor services; Cheaper living; Peaceful Environment; Retirement; Traffic congestion Push Factors Pull Factors
  • 15.
    The consequences ofcounter-urbanisation Can you give reasons for these consequences: Housing Traffic Services Jobs Increase in house price Young people forced to leave villages Use of Greenfield sites in popular villages Increase in number of cars in village Local shops, post offices and garages close. Local schools close Decrease in number of jobs vailable