Download to read offline

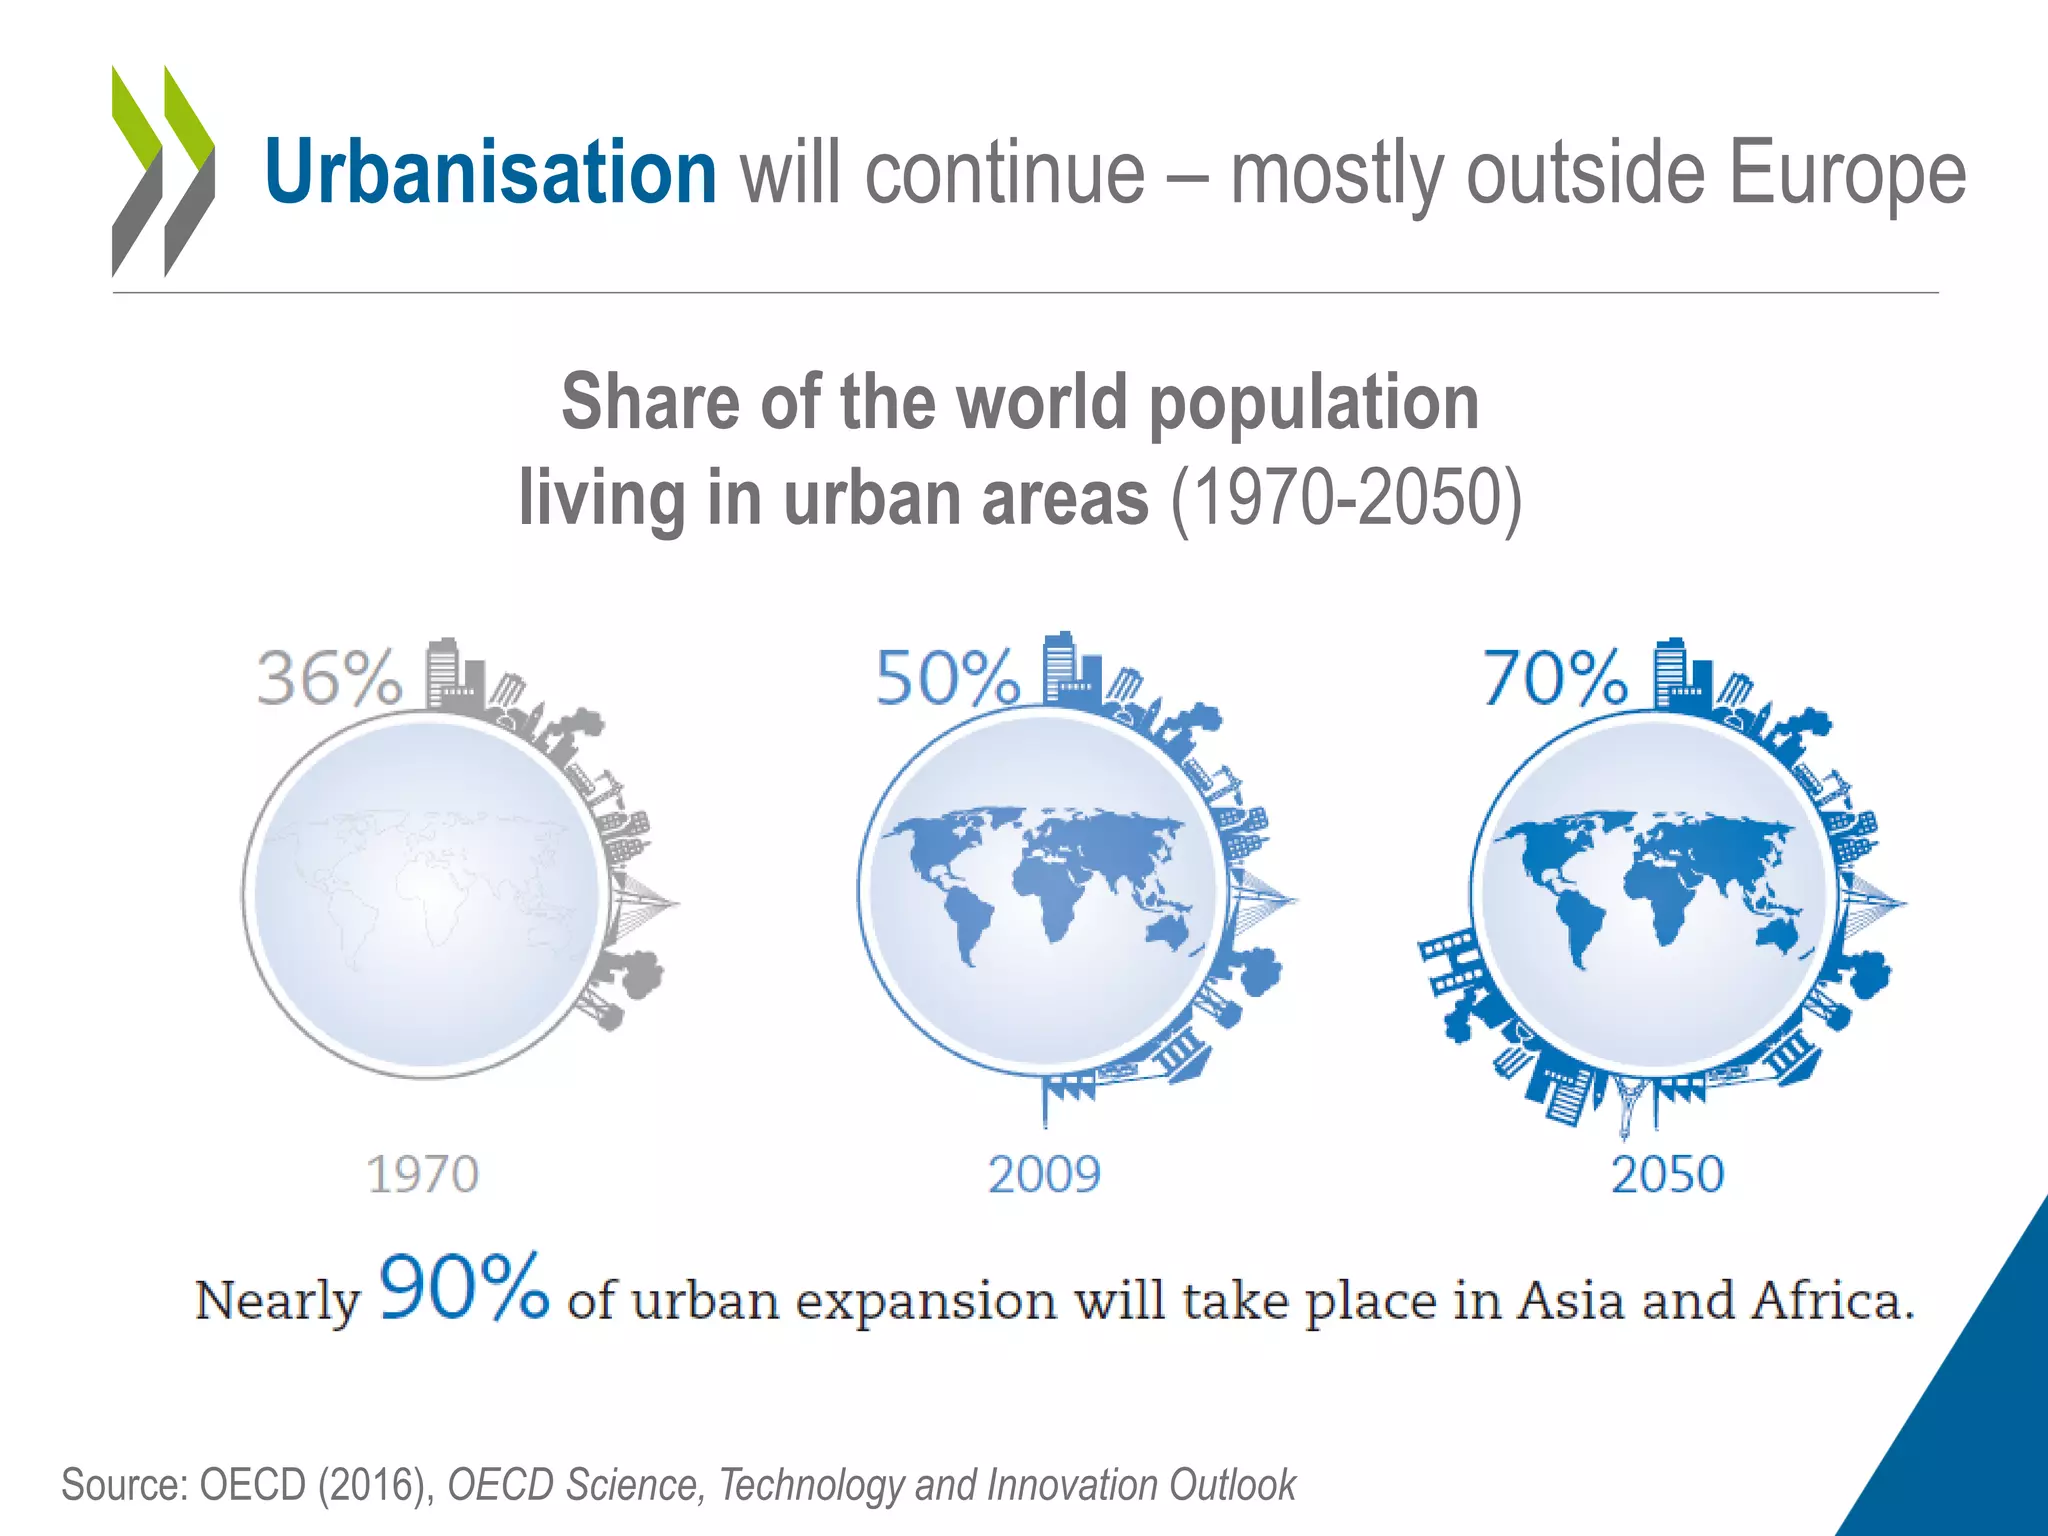

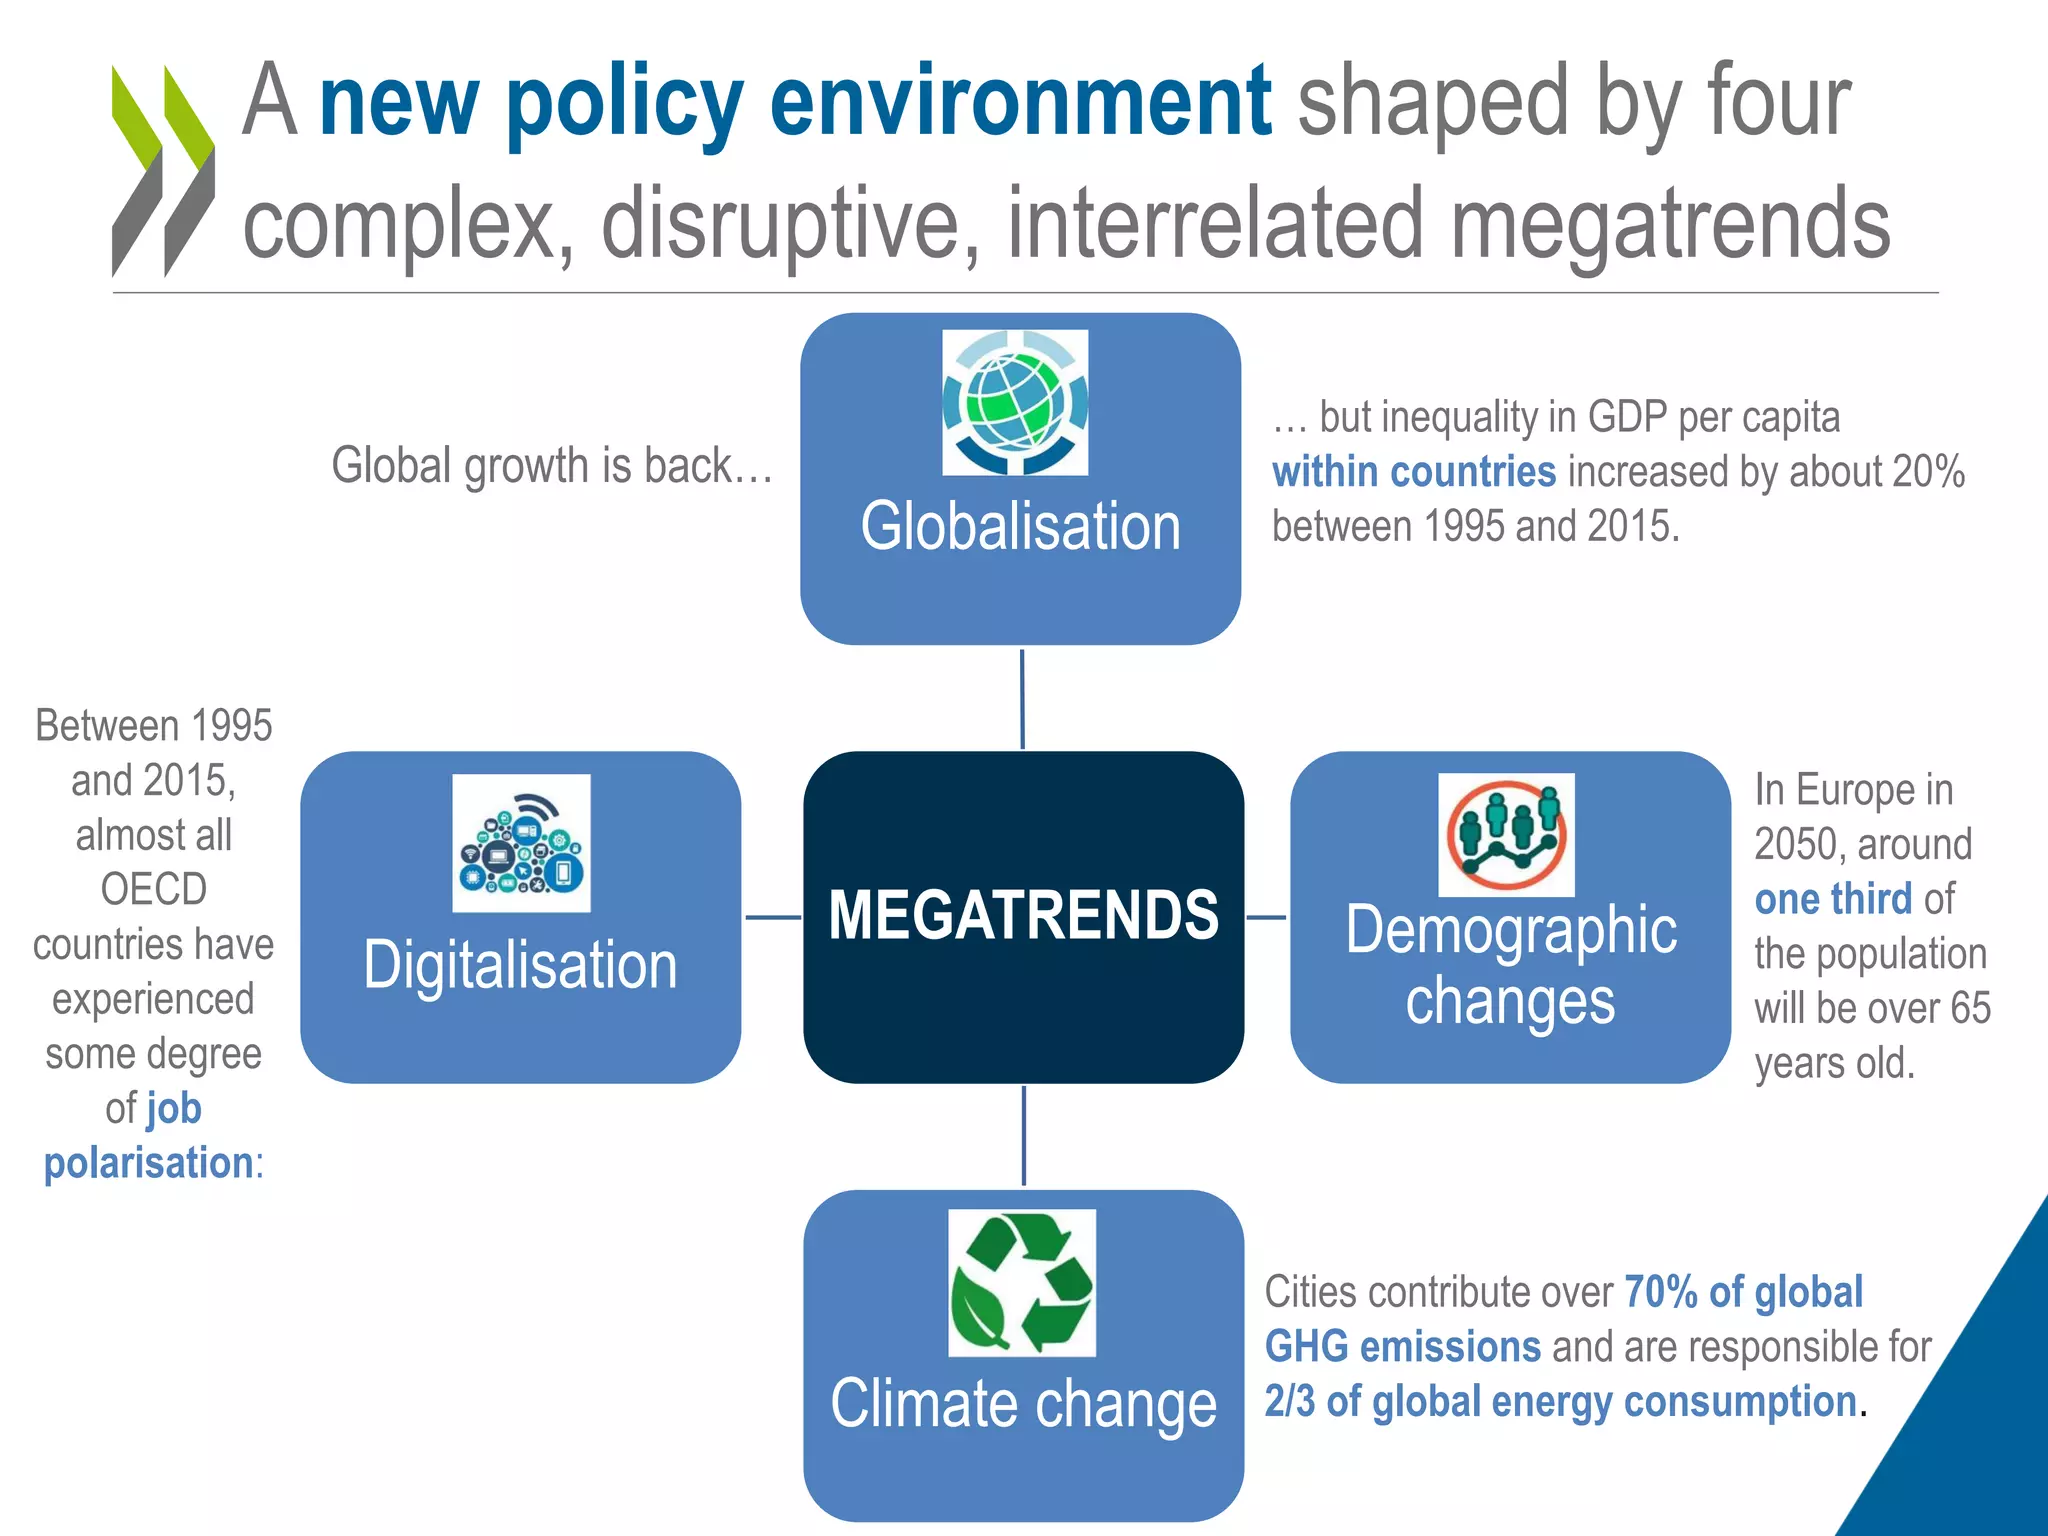

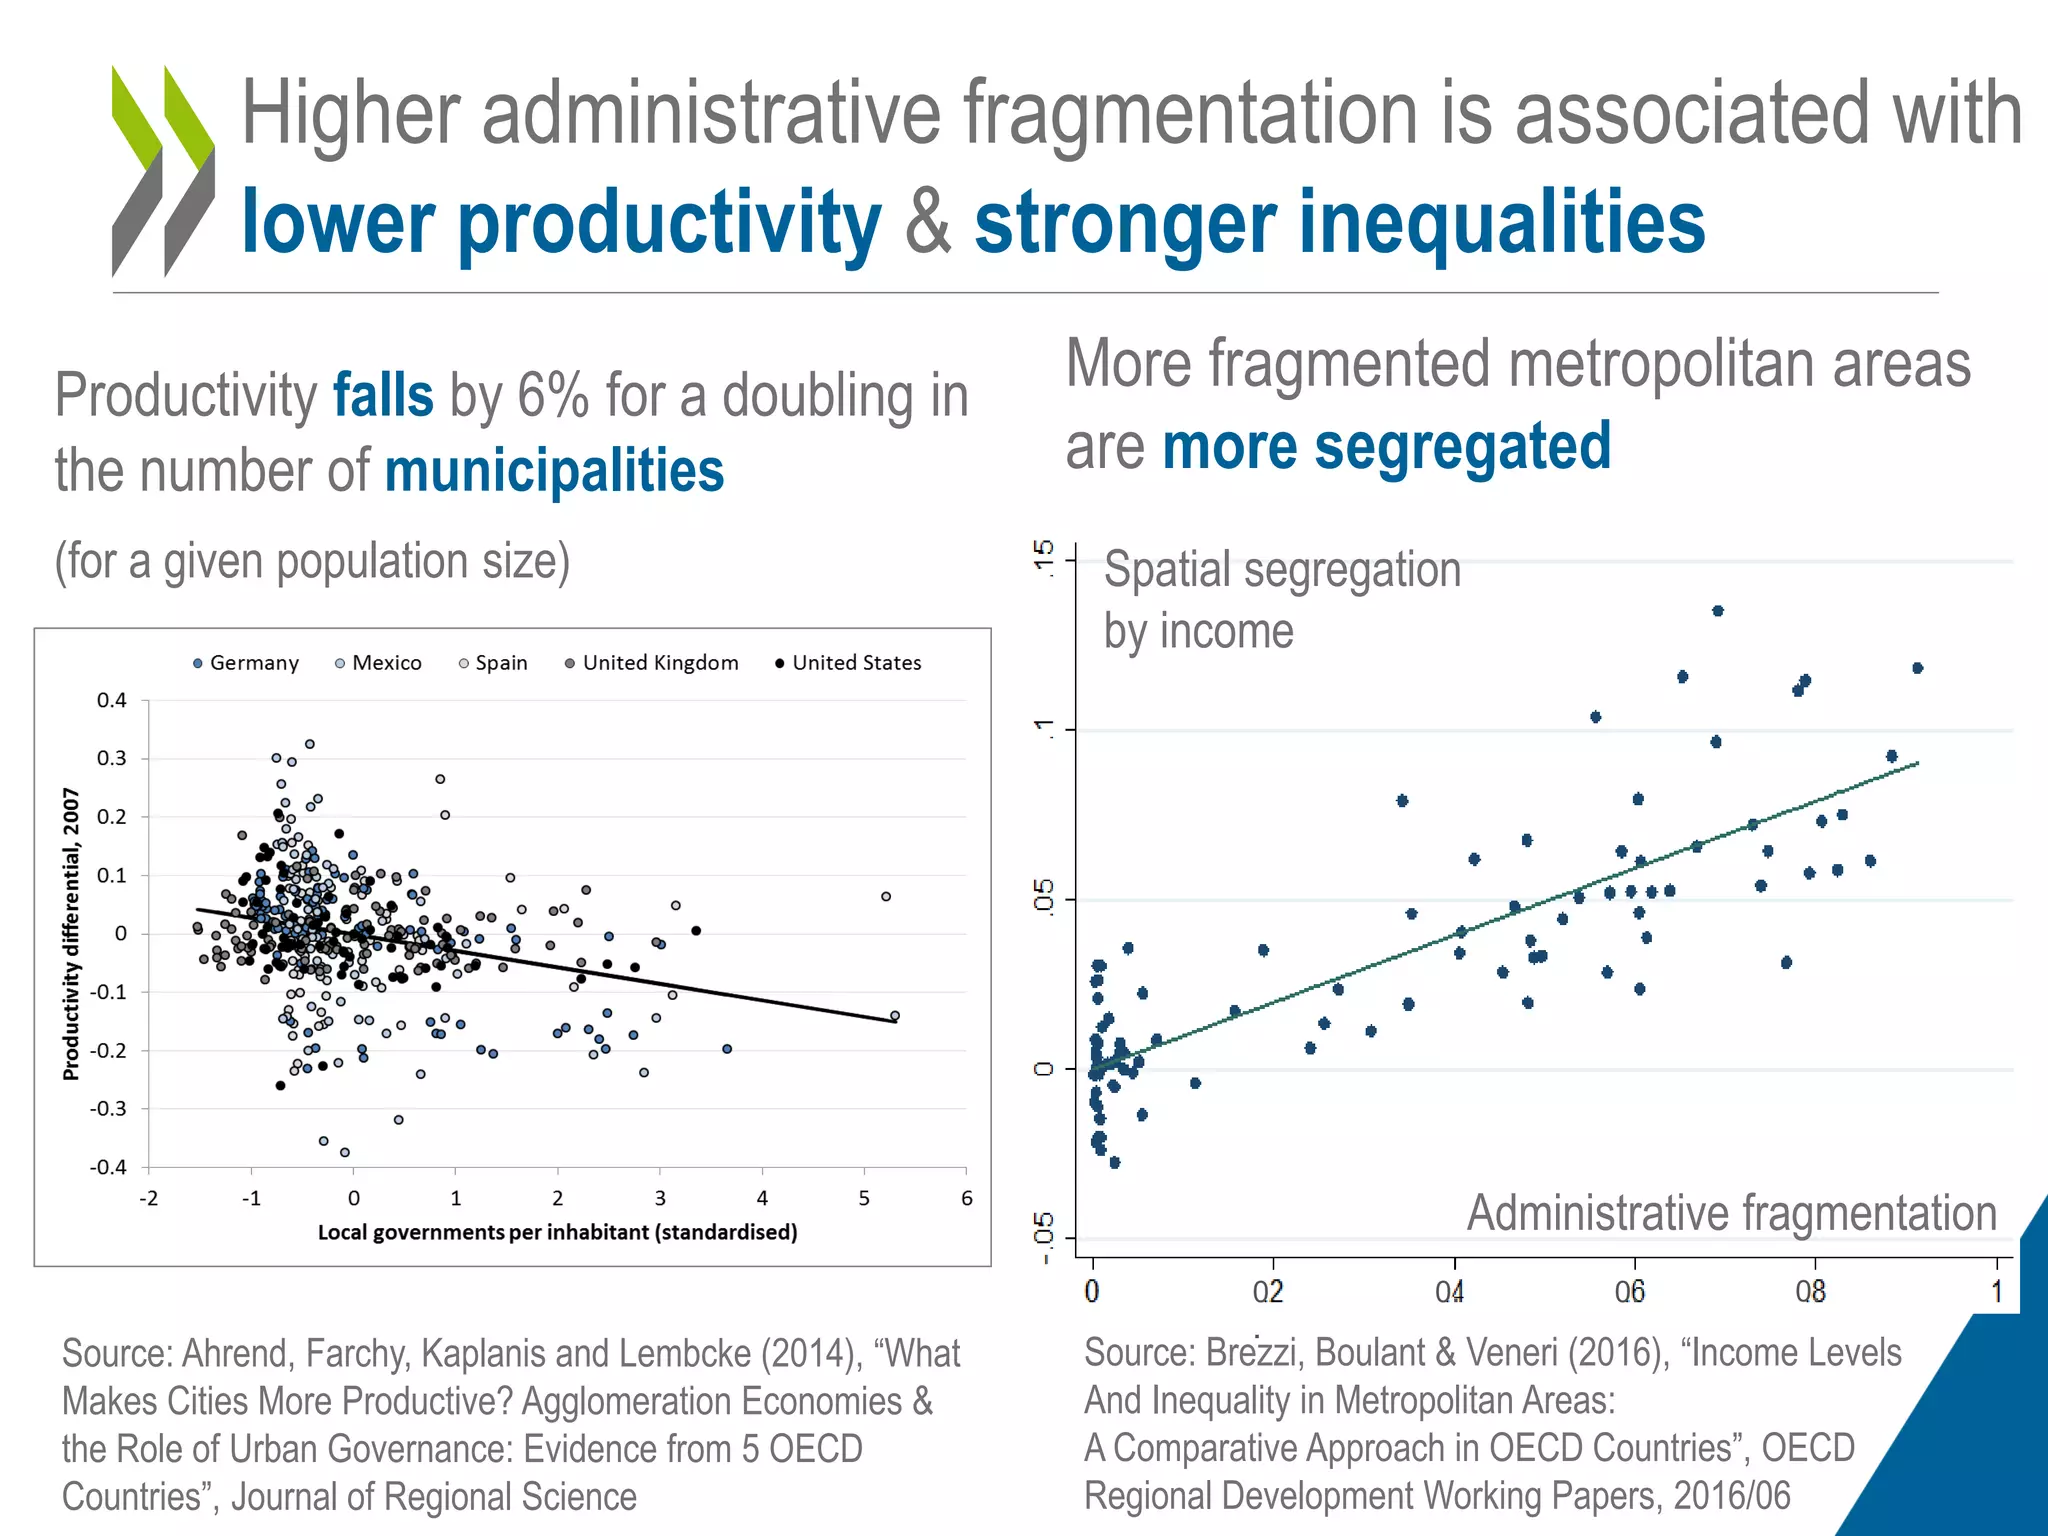


The document discusses the ongoing trends in urbanization and its implications for economic growth, emphasizing that urbanization does not automatically lead to wealth creation. It highlights the role of cities in global greenhouse gas emissions and energy consumption, while also noting demographic changes and rising inequality within countries. The document advocates for effective metropolitan governance to combat the challenges of urban fragmentation and segregation.


