Itsnotthesizeofthedataitshowyouuseitsmartermarketingwithanalyticsanddashboards
•Download as PPTX, PDF•
1 like•442 views

The document outlines steps for marketers to create and use dashboards to better monitor marketing progress and facilitate decision making. It discusses the benefits of dashboards, including helping address poor data organization, biases, accountability demands, and cross-department integration. Case studies show how dashboards can inform decisions across various industries. The book provides guidance on assembling teams, gaining IT support, building databases, designing effective visualizations, and cultivating a data-driven culture.

Recommended
Recommended
More Related Content
What's hot
What's hot (20)
Similar to Itsnotthesizeofthedataitshowyouuseitsmartermarketingwithanalyticsanddashboards
Similar to Itsnotthesizeofthedataitshowyouuseitsmartermarketingwithanalyticsanddashboards (20)
Recently uploaded
Recently uploaded (20)
Itsnotthesizeofthedataitshowyouuseitsmartermarketingwithanalyticsanddashboards
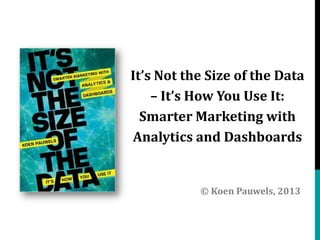
- 1. It’s Not the Size of the Data – It’s How You Use It: Smarter Marketing with Analytics and Dashboards © Koen Pauwels, 2013
- 2. Foreword by Laura Patterson, Visionedge Marketing “Through this book Koen Pauwels makes his extensive experience within the reach of us all. He outlines steps, shares case studies, and provides checklists that make it possible for marketers to create and use dashboards as a way to both monitor progress and facilitate decisions. He designed this book to help marketers use data and metrics to better understand the effect and impact of marketing investments.”
- 3. Decisions That Data + Analytics Can Inform Case studies on brand tracking, data management, offline + online marketing communication, direct mail, social media, search, promotions, pricing, product age, retargeting,… Large and small companies, B2C and B2B across 3 continents Even a small improvement in using marketing analytic dashboards brings companies on average 8 % higher Return on Assets compared to their peers (Germann et al., IJRM, 2012)
- 4. Across Industries In Case Studies Fast moving consumer goods: P&G, Unilever, food, non-food Financial services: Discover, Vanguard, First Tennessee Bank Consumer durables: cars, furniture, male shaving Entertainment: EB Games, Harrah’s Services: online retail, fashion retail, online travel, insurance Business-to-business: Avaya, Unisys, global packaging Not-for-profit: Atlanta city dashboard
- 5. Chapter 1: What Marketing Analytics Dashboards Can Do for You Analytic Dashboard: a concise set of interconnected performance drivers to be viewed in common throughout the organization It helps you deal with: 1. poor organization of data, 2. managerial biases in information processing and decision-making, 3. the increasing demands for marketing accountability, and 4. the need for cross-departmental integration when needed
- 6. View Performance Drivers: Examples European SME Source: http://www.dashboardinaction.com/ U.S.-Based Large Firm Source: http://www.dundas.com/
- 7. Connect Your Actions With Results
- 8. Do You Need an Analytic Dashboard? Is your organization suffering from: 1) Confusion about the effectiveness of new media (what is your social media ROI?)? 2) Lack of comparable metrics across media (online vs. offline) or countries? 3) Too many ‘key performance indicators without proof of their sales impact? Can marketing answer the questions: 1) If we need to cut 20% from our marketing budget, what would we cut? Not 2) If we need to get 10% more revenues next year, where would they Really come from? 3) When does our marketing action affect performance, and how long does it last? Do you want to: 1) Agree on facts so meetings focus on plans to action? 2) Justify budget (changes) in winning financial language? 3) Deploy analytics to turn data into better decisions? YES You need an analytic dashboard You want to read this book You’re gonna like the way it helps you lift your performance
- 9. From Reporting to Insightful Analysis A common pitfall in the data-driven journey is the emphasis on reporting than deep-dive analysis. The analytics team’s time is primarily spent on maintaining the existing reports and responding to ad-hoc reporting requests. Almost no emphasis is placed on advanced analysis, which can provide significantly more value to the business. Brent Dykes Evangelist for Customer Analytics Adobe
- 10. Chapter 2: Dashboard vs. Scorecard Commonalities Provide a snapshot of a firm’s performance Differences Dashboard metrics proven to lead performance by data analytics Dashboard integrates short- and long-term objectives of a firm, scorecard is rather focused on long-term deliverables Align marketing (other functional unit) objectives with a firm’s strategy Scorecard lacks flexibility, dashboard is highly customizable Link inputs with outputs Scorecards’ users are predominantly top managers, dashboards can be used at any level of organizational hierarchy Dashboard focuses on a firm’s context, scorecard is rather weak on competition perspective/analysis
- 11. Chapter 3: Start With the Vision “It is possibly the single most important opportunity, in a decade, for your management to reinvent. But to do so you need to have good metrics, measurements you can trust and from which you can make sound decisions that advance your company's business plan. You need to measure what really counts. Once identified, these metrics should then be placed in your Dashboard.” Borenstein, 2009
- 12. Chapter 3: Start With the Vision Better performance by analytic dashboards = Goal alignment with company’s vision * Top management support * Employee engagement
- 13. How Goal Alignment and Metrics Consensus Get Results Measurement Enablers Measurement Abilities Use of a dashboard + ++ + Metrics consensus + ++ Goal alignment Ability to measure brand equity Ability to measure financial returns Outcomes Revenue improvement + - ++ Learning ++
- 14. Chapter 4: Assemble Your Team Today’s marketers must possess a hybrid of traditional marketing skills and quantitative skills – mixing both art and science. But it’s not enough to have both on the team; you have to some of each in everyone (like having a major and minor in college). We’ve started living this at SAP. To let the science influence the art, we gather data and feedback on our marketing ideas before we make a full commitment. Jonathan Becher Chief Marketing Officer SAP
- 15. Chapter 4: Assemble Your Team 5 out of 12 steps to build + maintain your project team: 1. Identify the skills needed 2. Find the right mix of personalities 3. Recognize what motivates/demotivates your people 4. Know the stage your team is in 5. Lead, don’t micromanage your team
- 16. Chapter 5: Gain IT Support on Data Big & Small 7 pillars to bridge IT and business units into cooperation 1. IT understands its role is to support business 2. IT knows strengths and quirks of its customer, i.e. business 3. IT does not get isolated, but integrated into decisions 4. Business sees how its ‘need for speed’ creates IT problems 5. Business develops self-discipline for long-term feasibility 6. Business understands set-up costs and maintenance efforts 7. Standardize IT service, but do leave the room for flexibility
- 17. Chapter 6: Build Your Database The main goal of a database is to collect, analyze, and distribute information to the right people at the right time. 5 out of 10 tips on how to manage your database: 1. Make sure your data is accurate and up-to-date 2. Distribute key information to all stakeholders 3. Customize your database 4. Keep it simple and clean 5. Utilize your database at its full capacity
- 18. Chapter 9: Include Emerging Channels: Online and Social Media 3 rules for social media marketing: 1. Begin with setting clear marketing goals and objectives and then move on to metrics 2. Use both quantitative and qualitative metrics: there is no “silver” metric 3. Use metrics specific to your company, business and marketing goals and objectives
- 19. Chapter 11: Design Your Dashboard Dashboard design key attributes: • Simplicity • Focus • Clarity • Compactness • Leading to action • Readability • Insightfulness • Flexibility
- 20. Source: http://www.dashboardinaction.com/, © 2010 Koen Pauwels
- 21. Chapter 11: Design Your Dashboard 5 out of 10 tips on how to visualize your dashboard: 1. Highlight key metrics that require attention 2. Categorize information with color 3. Present data on dashboards in a consistent way 4. Use meaningful and descriptive titles 5. Avoid cluttering dashboards
- 24. Chapter 12: Launch & Renew Your Dashboard 7 things to remember for your dashboard project success: 1. Dashboards should be useful 2. Dashboards should be aligned with strategy 3. Dashboards should contain the right KPIs 4. Dashboards should be clear and easy-to-read 5. Dashboards should be well planned 6. Dashboards require effective execution and committed people 7. Dashboards are not set in stone, require response to feedback
- 25. Chapter 13: Change Your Decision Making: From Interpretation to Action “Information is not knowledge. The only source of knowledge is experience.” Albert Einstein “The best business decisions come from intuitions and insights informed by data. Using data in this way allows your organization to build institutional knowledge and creativity on top of a solid foundation of data-driven insights.” Bladt and Filbin Dosomething.org , 2013
- 26. Chapter 14: Nurturing the Culture and Practice of Accountability “The real revolution in data will be a change in organizational behavior and culture — and those changes are hard and take time. Many organizations will struggle with the shift, and frankly, many will be usurped by new competitors who grow up natively with this new worldview.” Scott Binker Chief Marketing Technologist, 2013
- 27. CONCLUSION: CALL TO ACTION Germann et al. (2012) uncover 5 key success factors for effective use of marketing analytic dashboards that increase company’s performance by 8-20%: 1. Top management support (see Chapters 1 and 3) 2. A supportive analytics culture (see Chapters 4 and 14) 3. Information technology support (see Chapter 5) 4. Appropriate data (see Chapter 6) 5. Analytic skills (see Chapters 7-10 and 13)
- 28. CONCLUSION: CALL TO ACTION “You don’t need software – You need courage and a vision” Borenstein (2009)
- 29. Check out the book on Amazon.com in the U.S. and McGraw-Hill in Europe. For questions and feedback, please contact the author! Prof. Dr. Koen Pauwels koen.pauwels@ozyegin.edu.tr www.marketdashboards.com