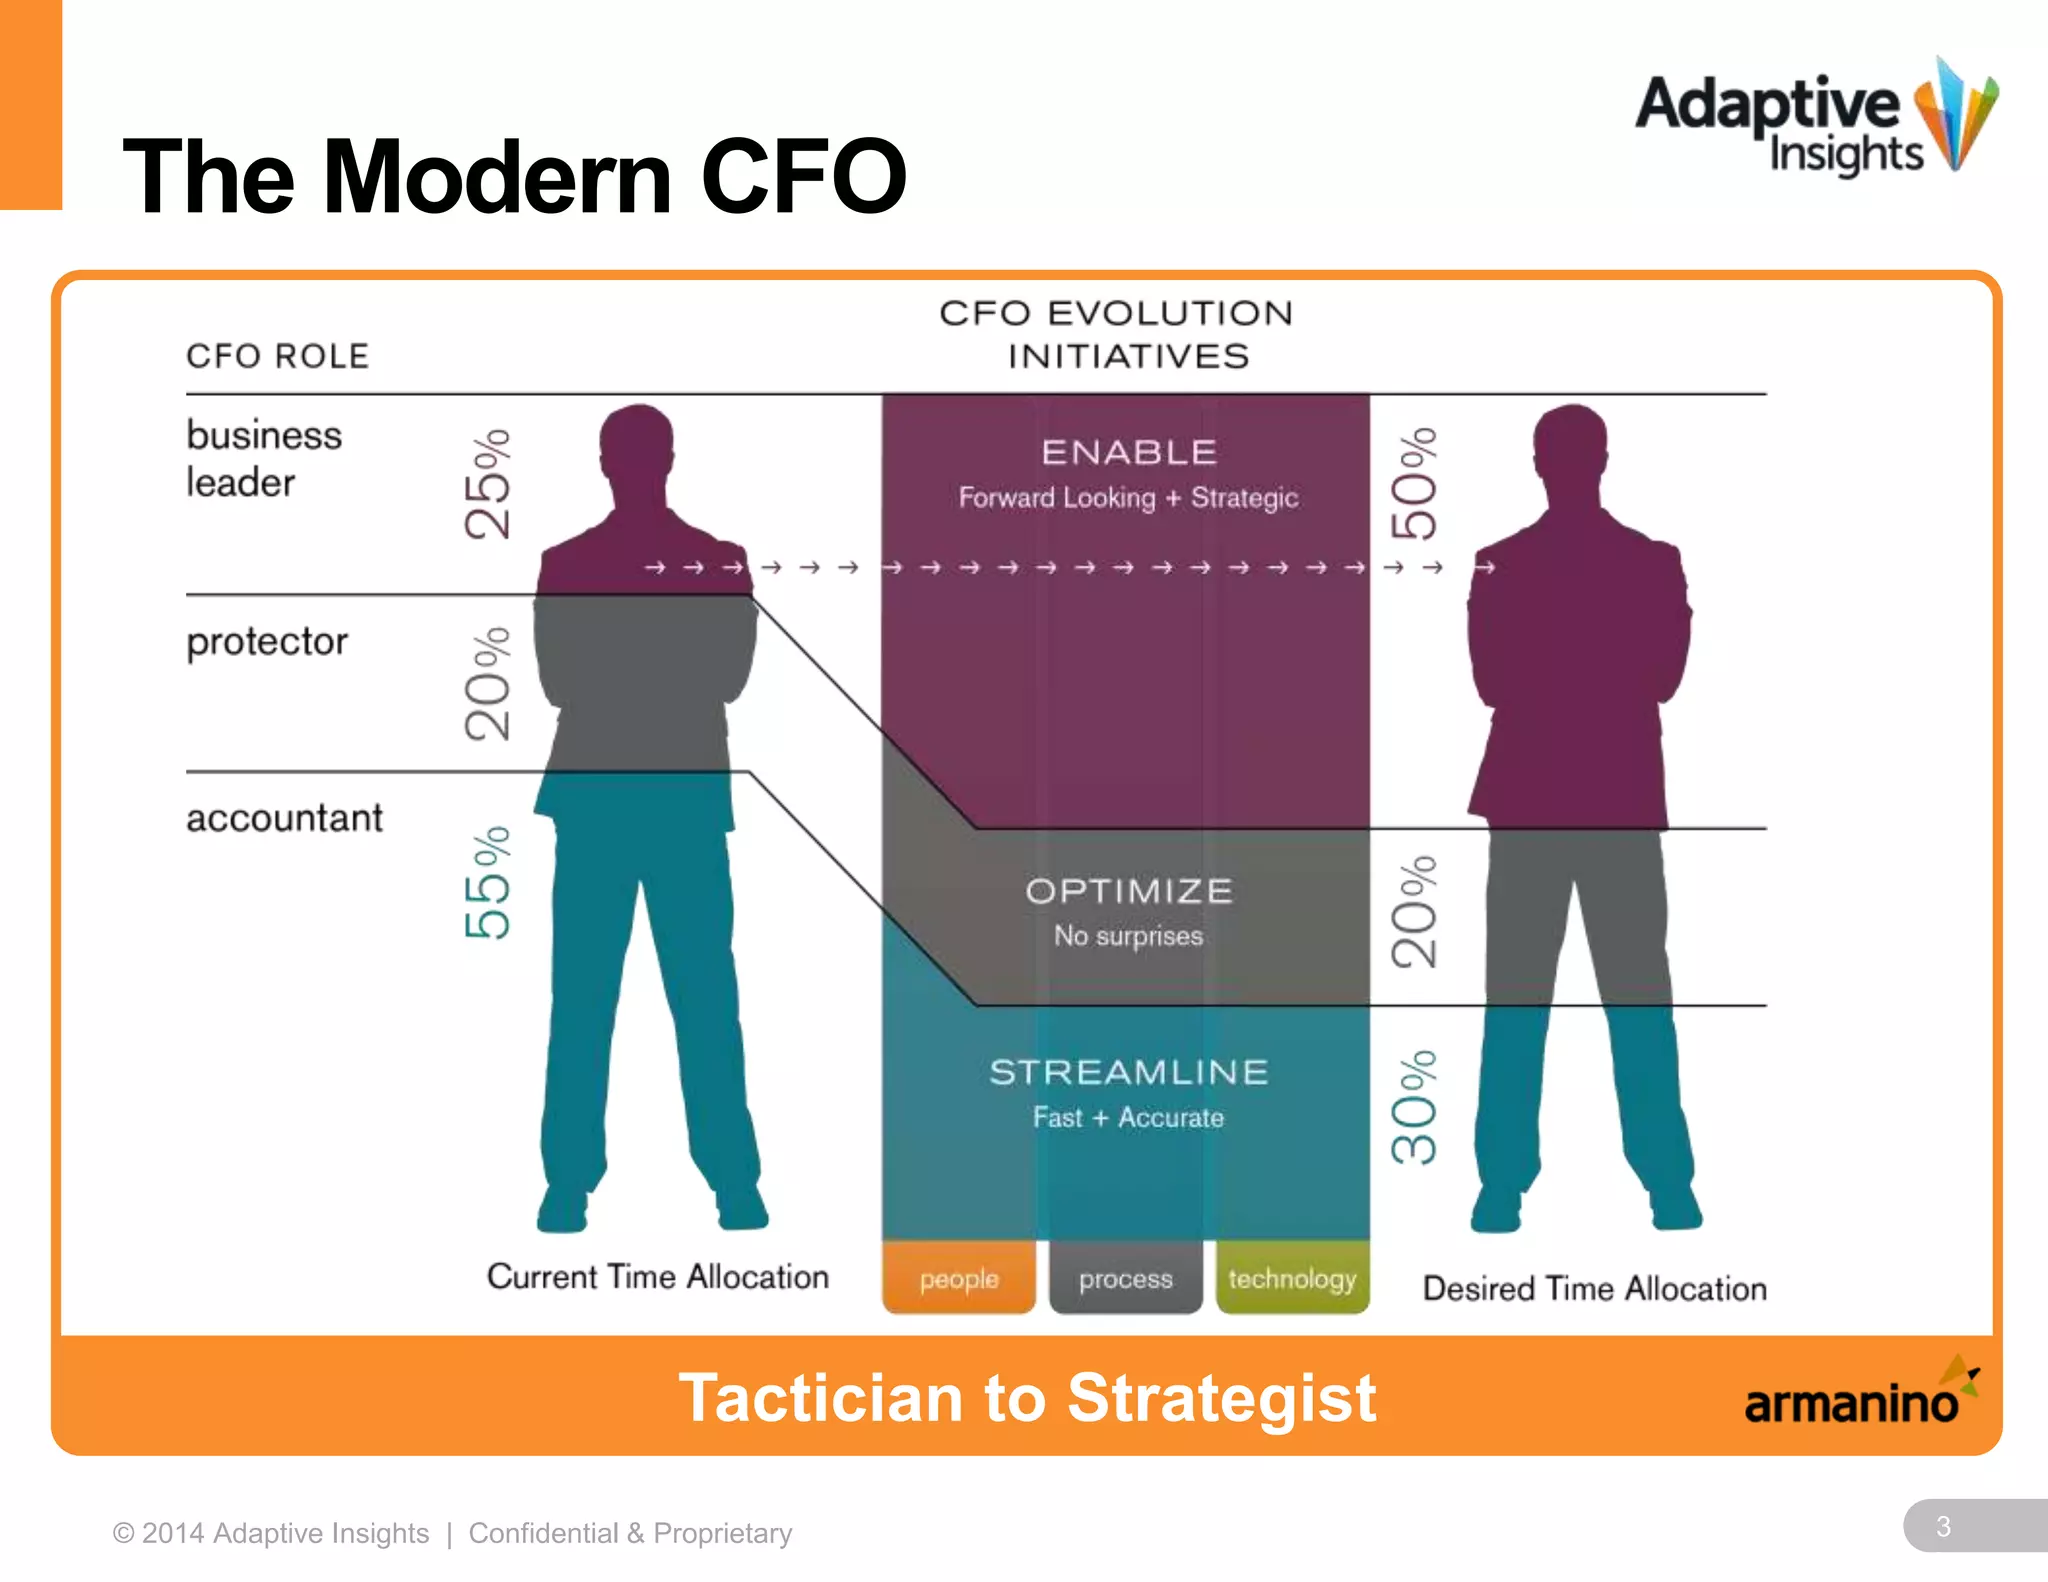
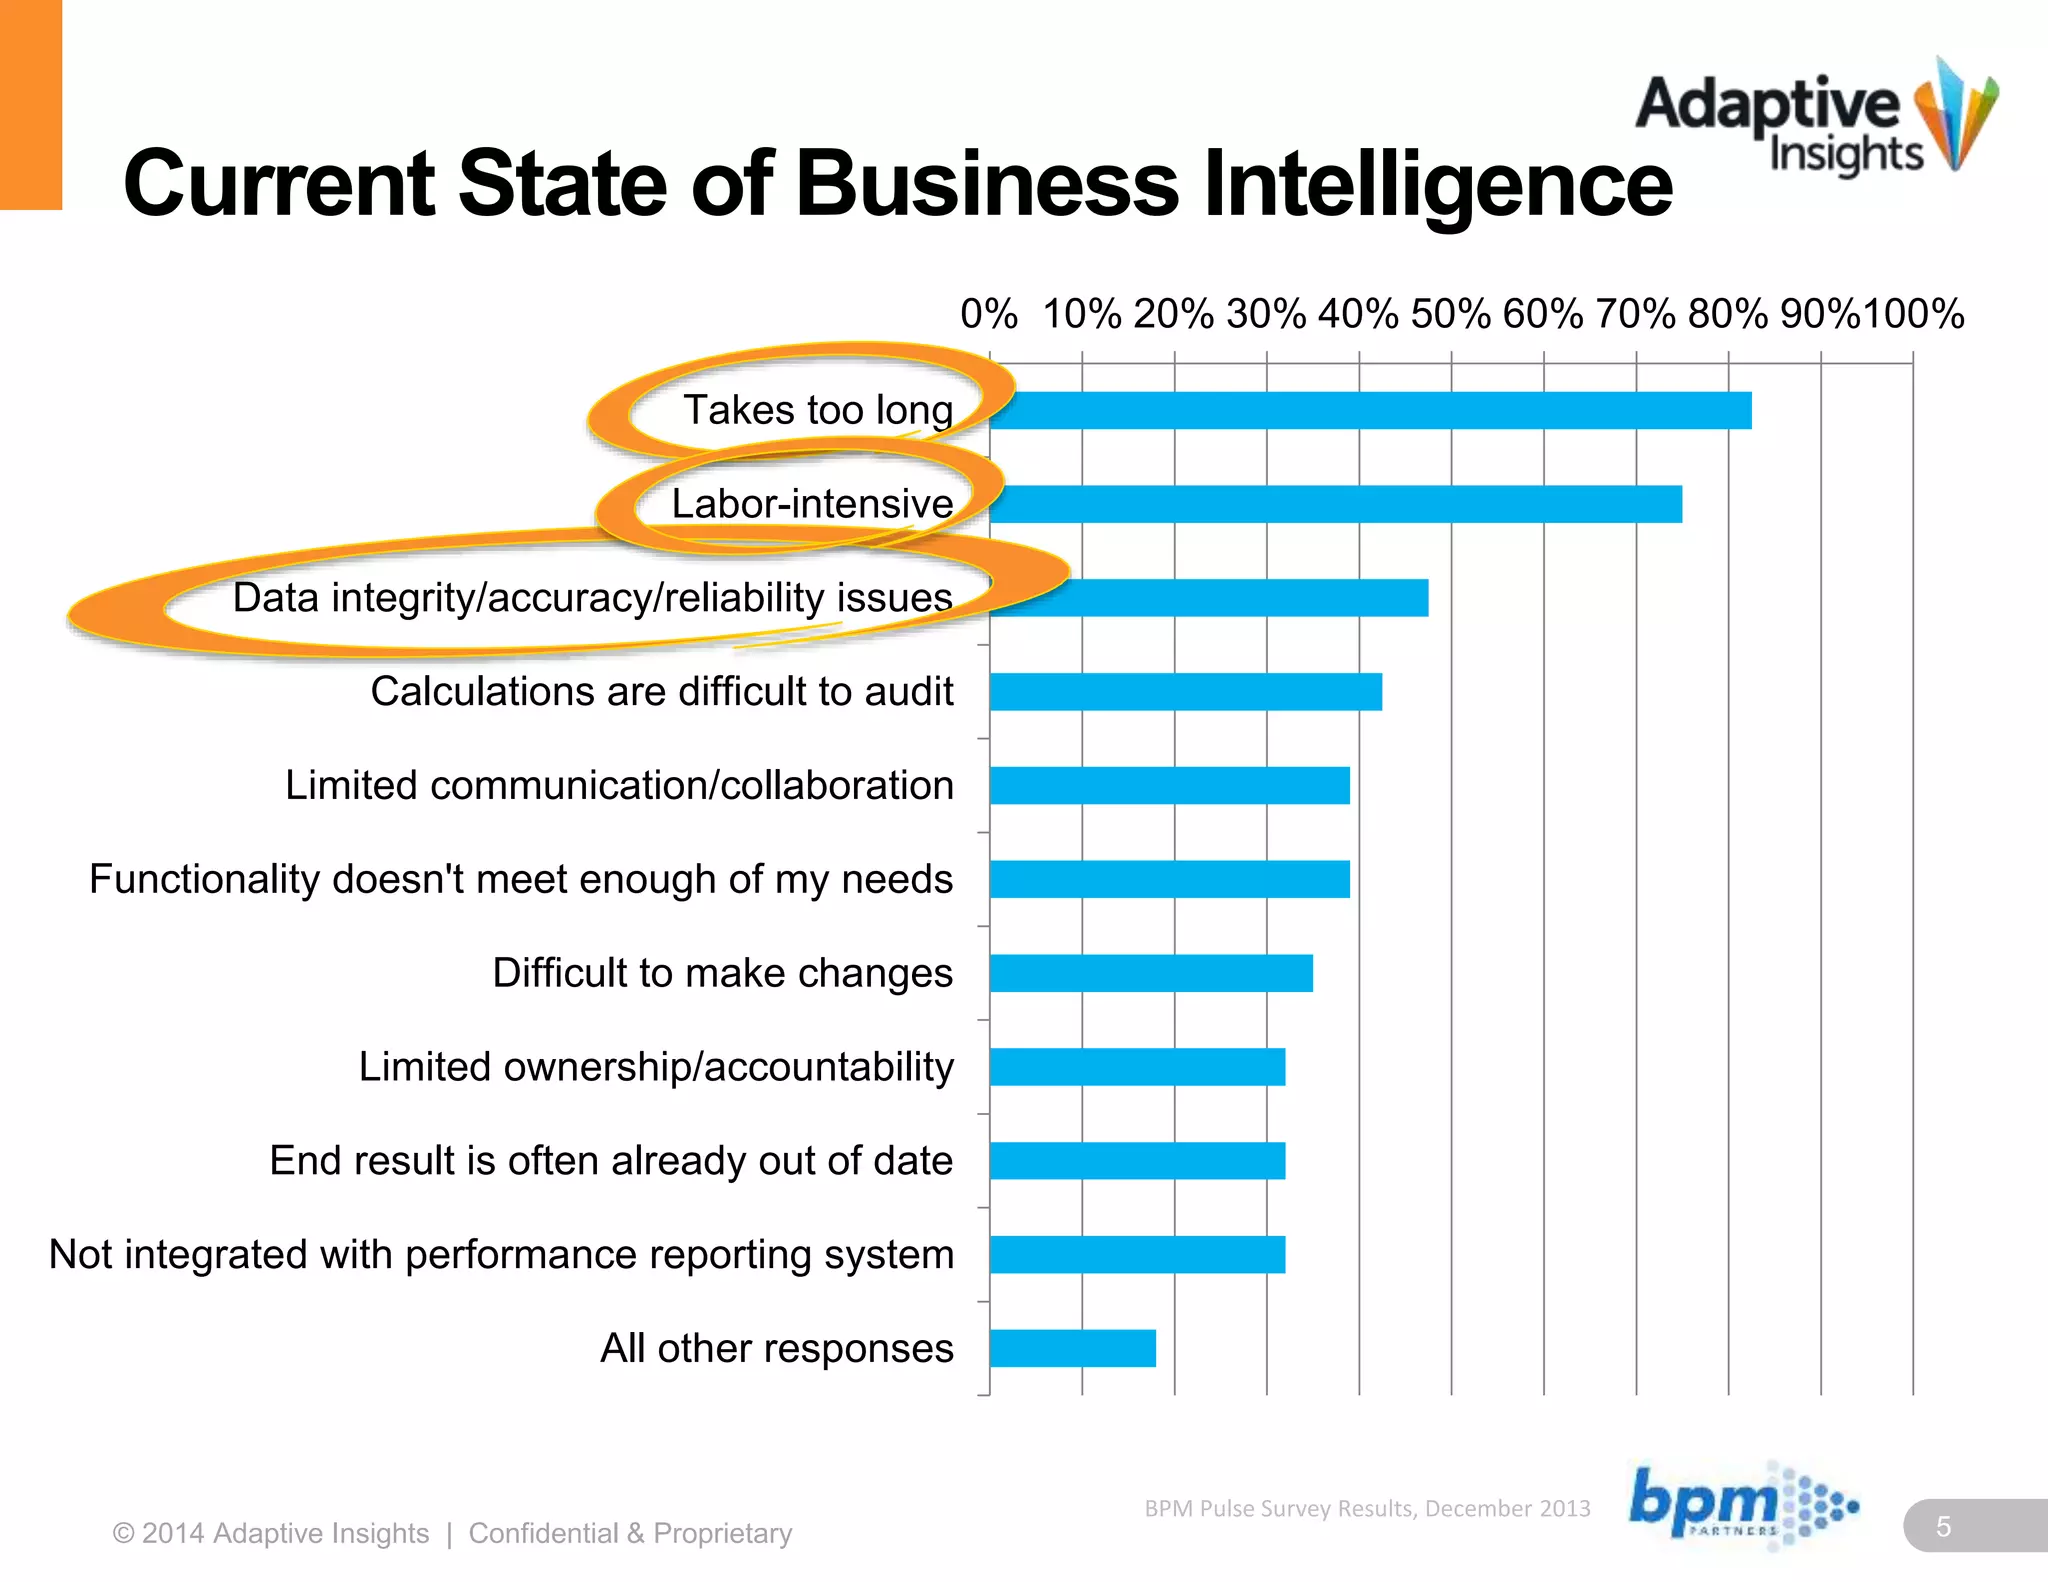
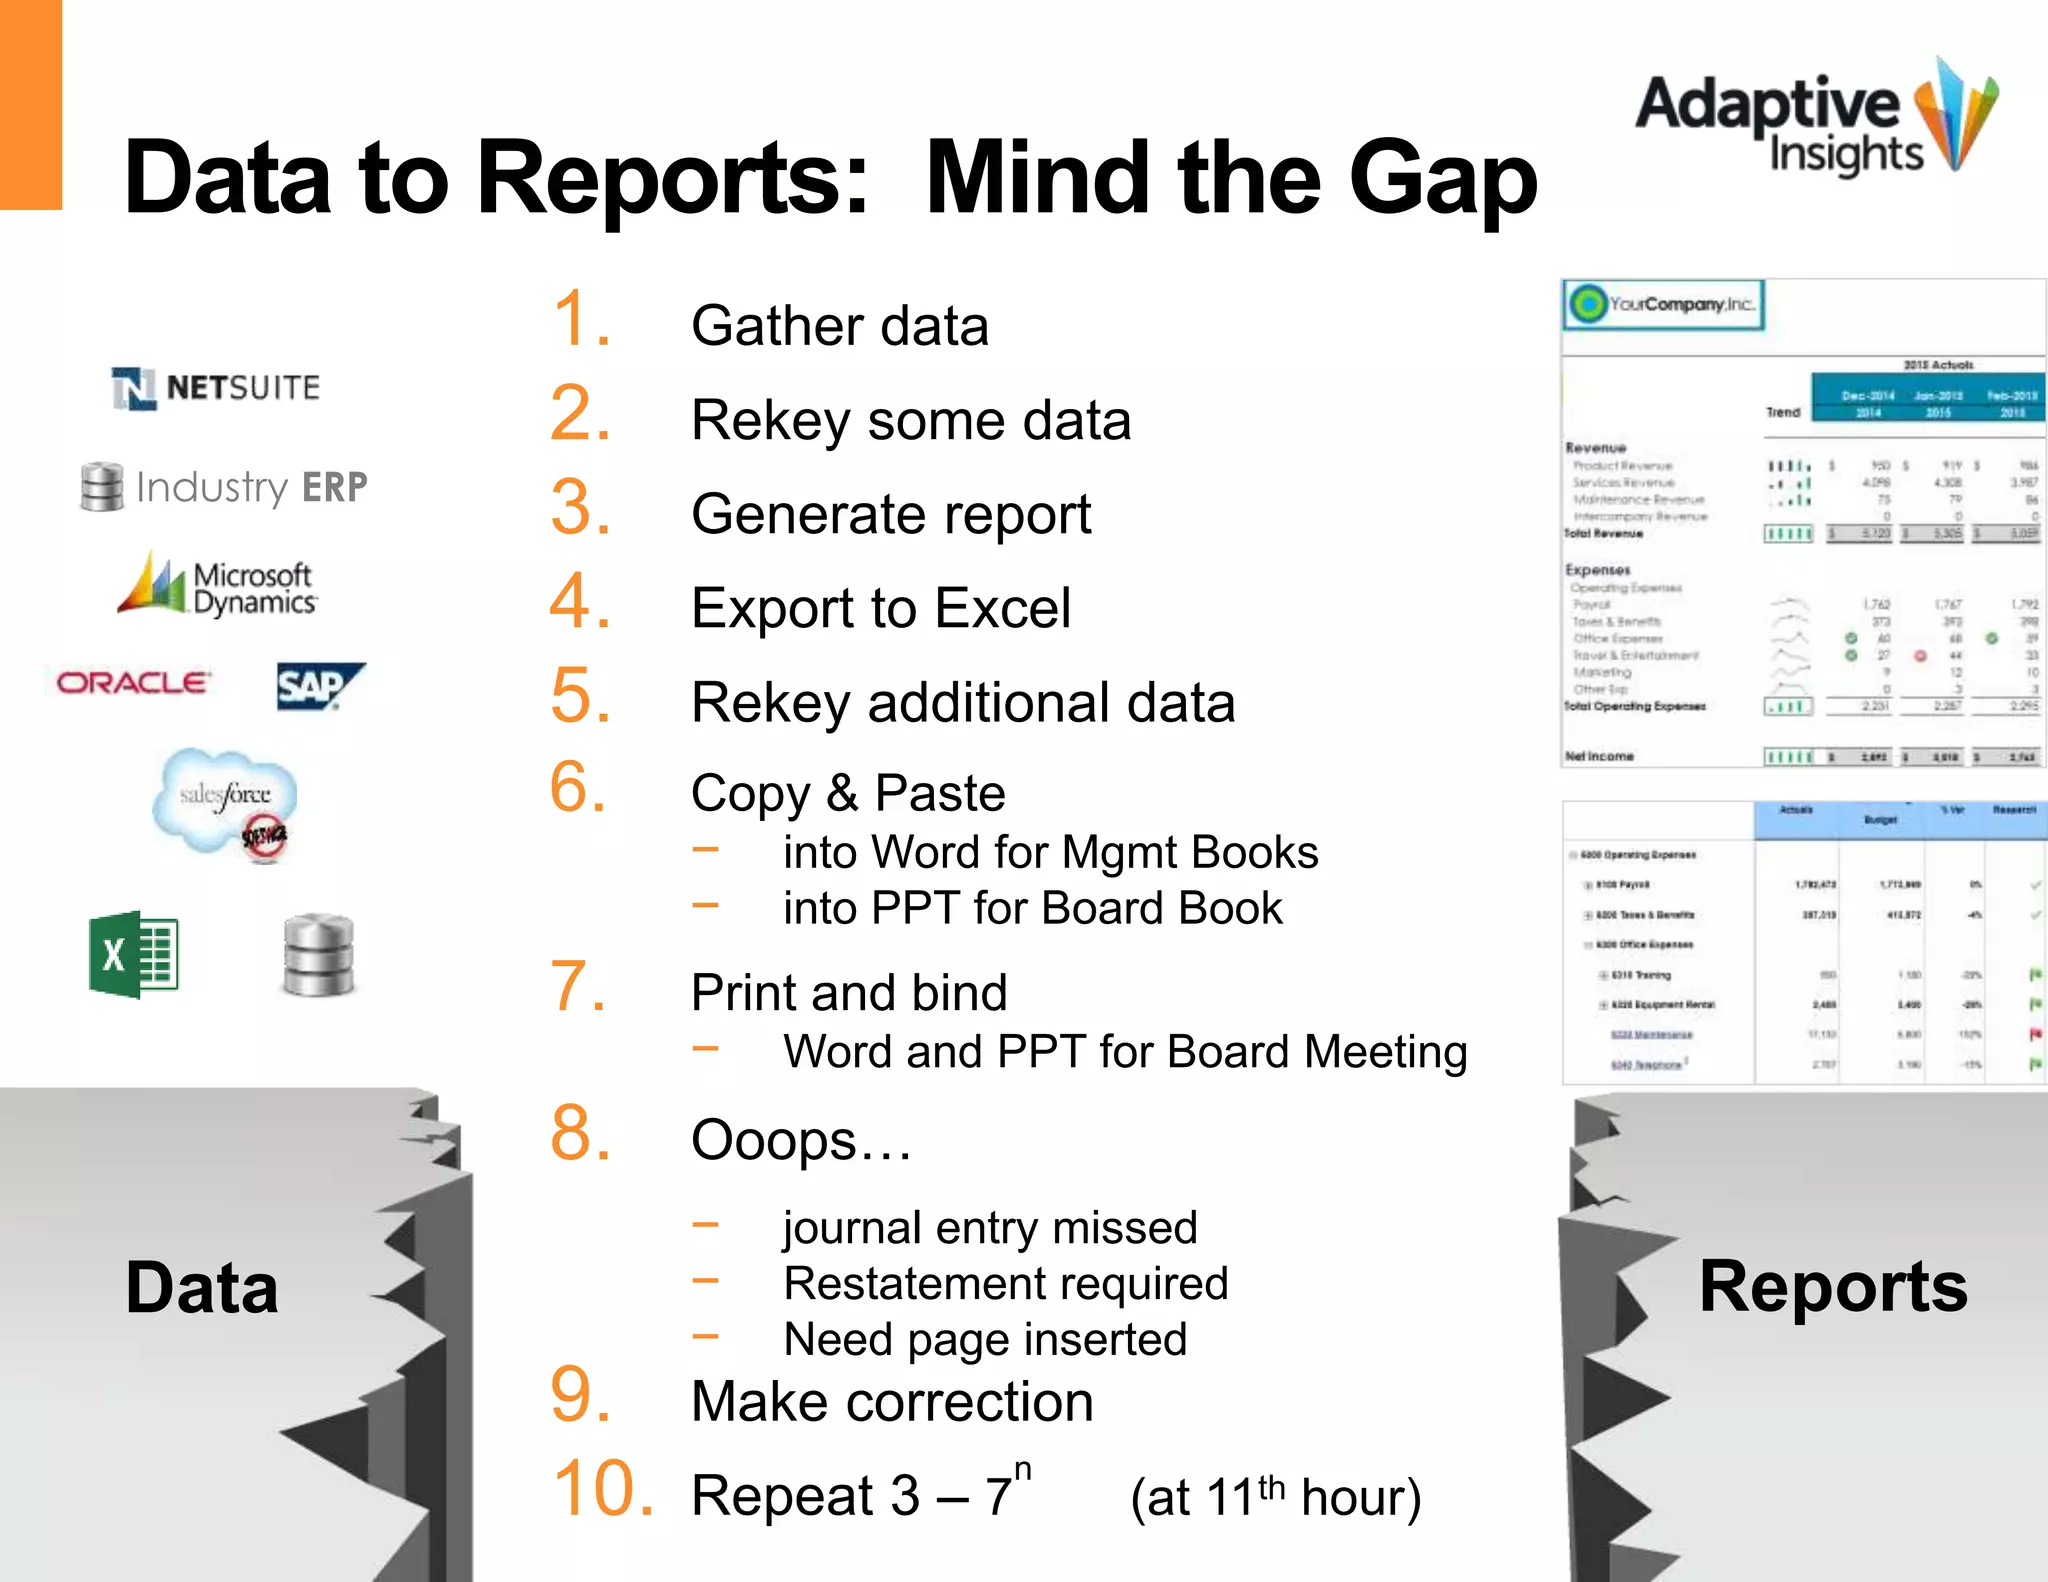
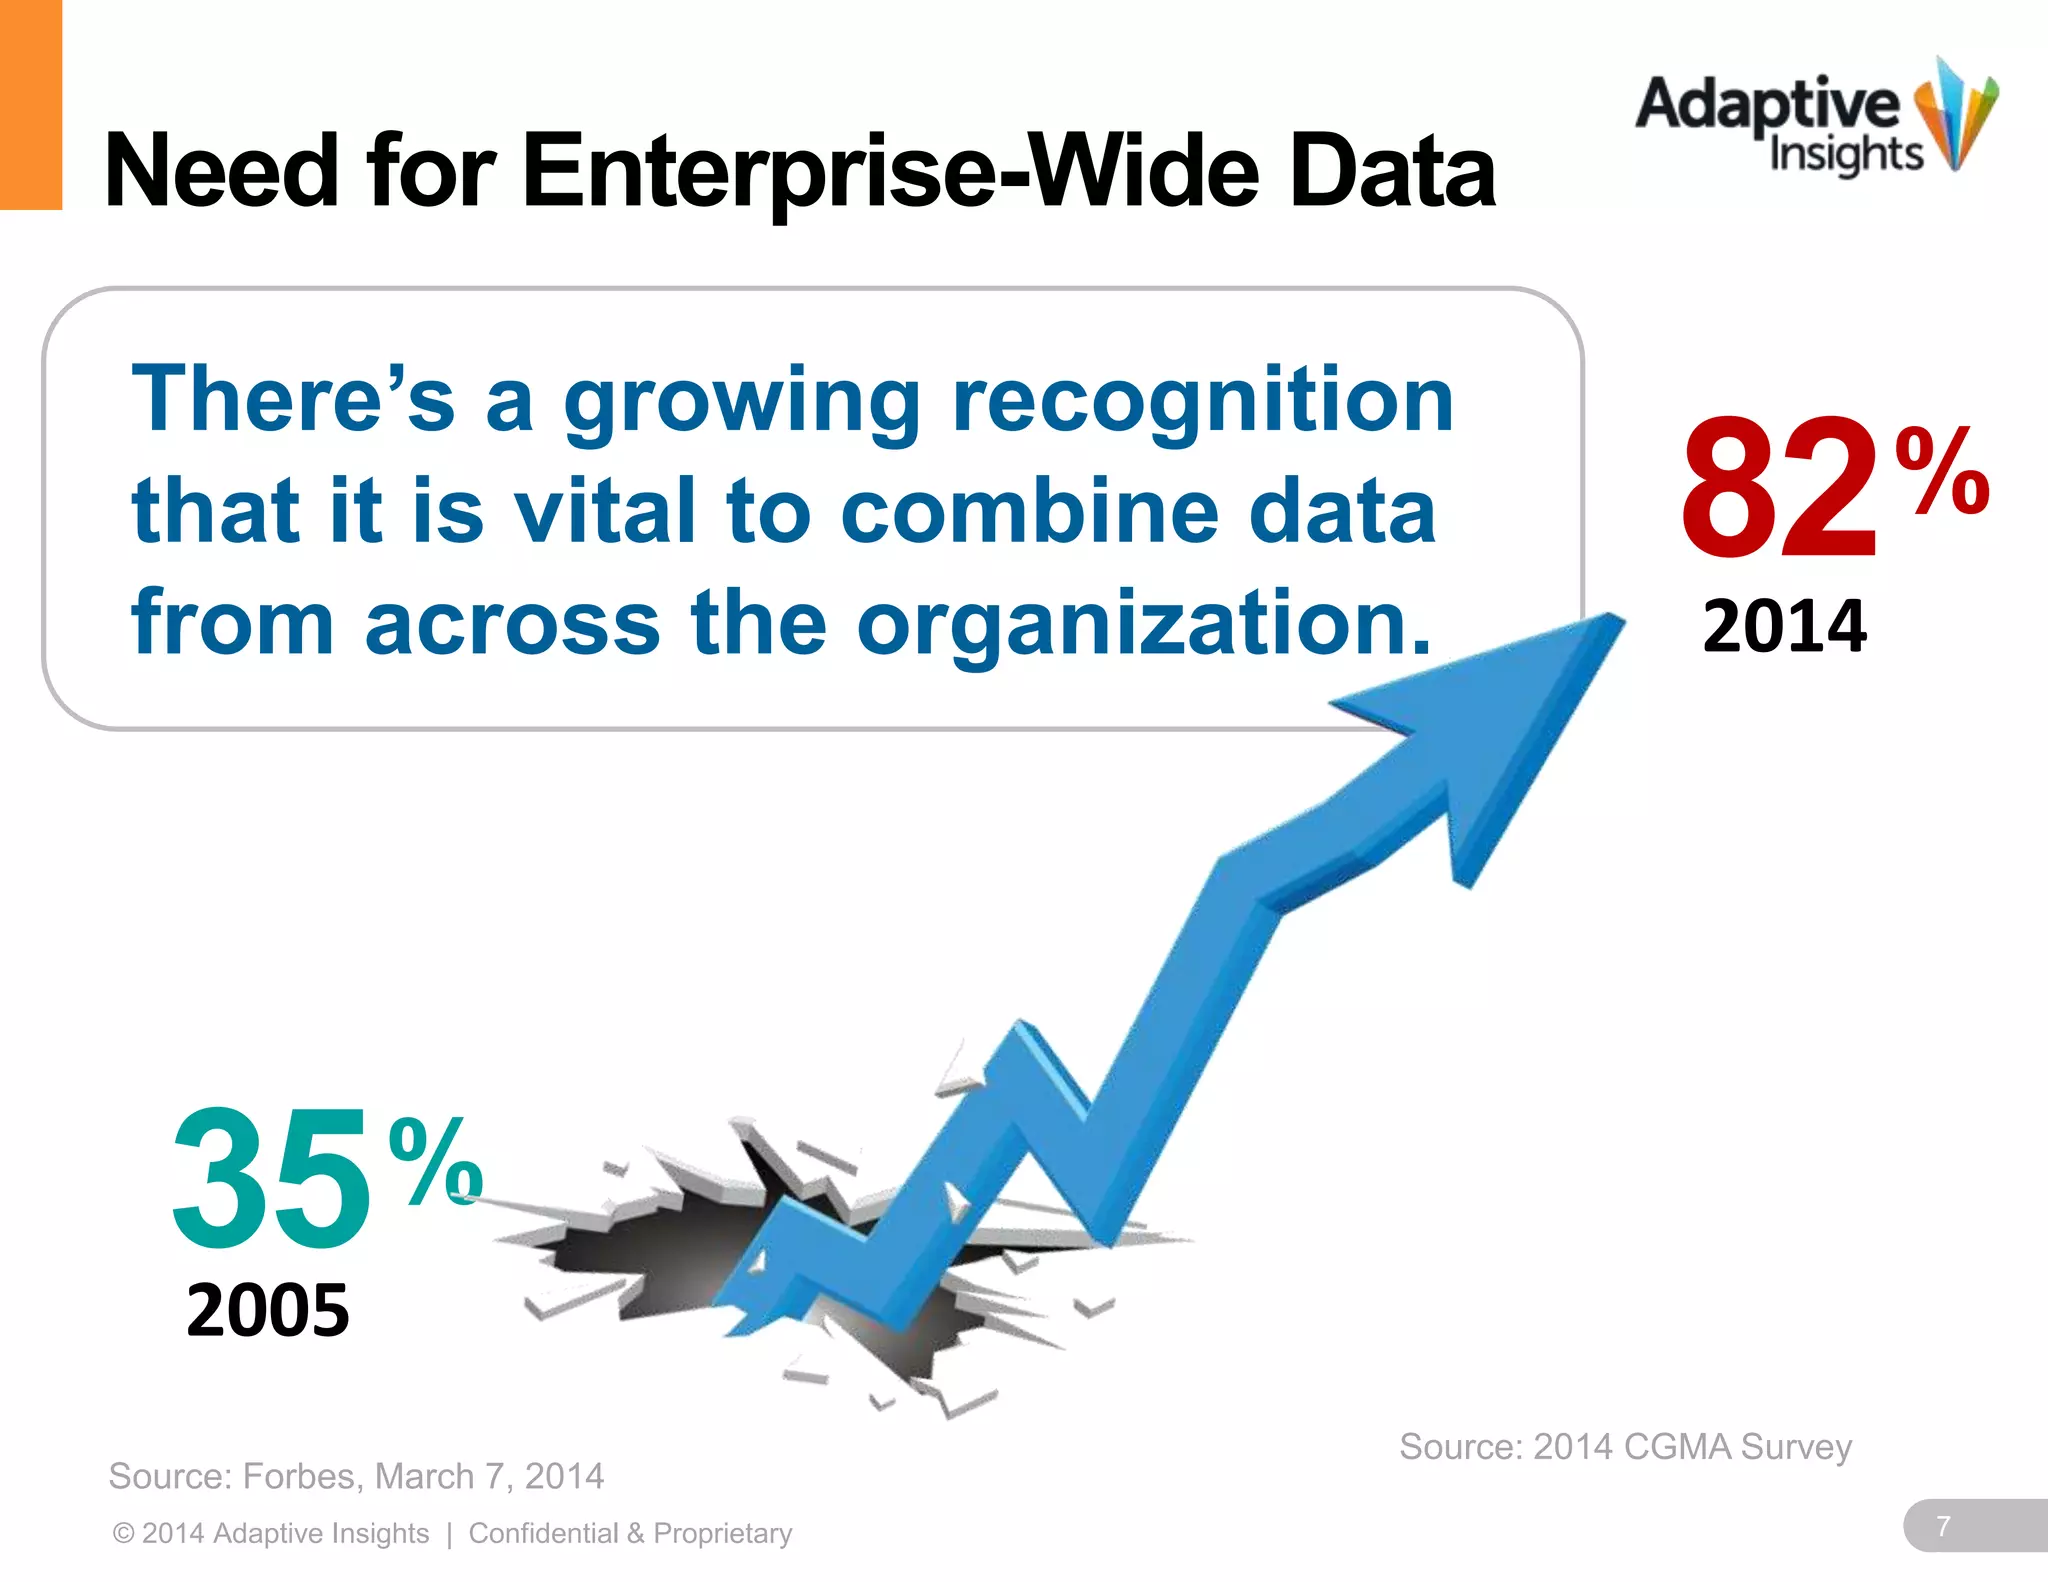
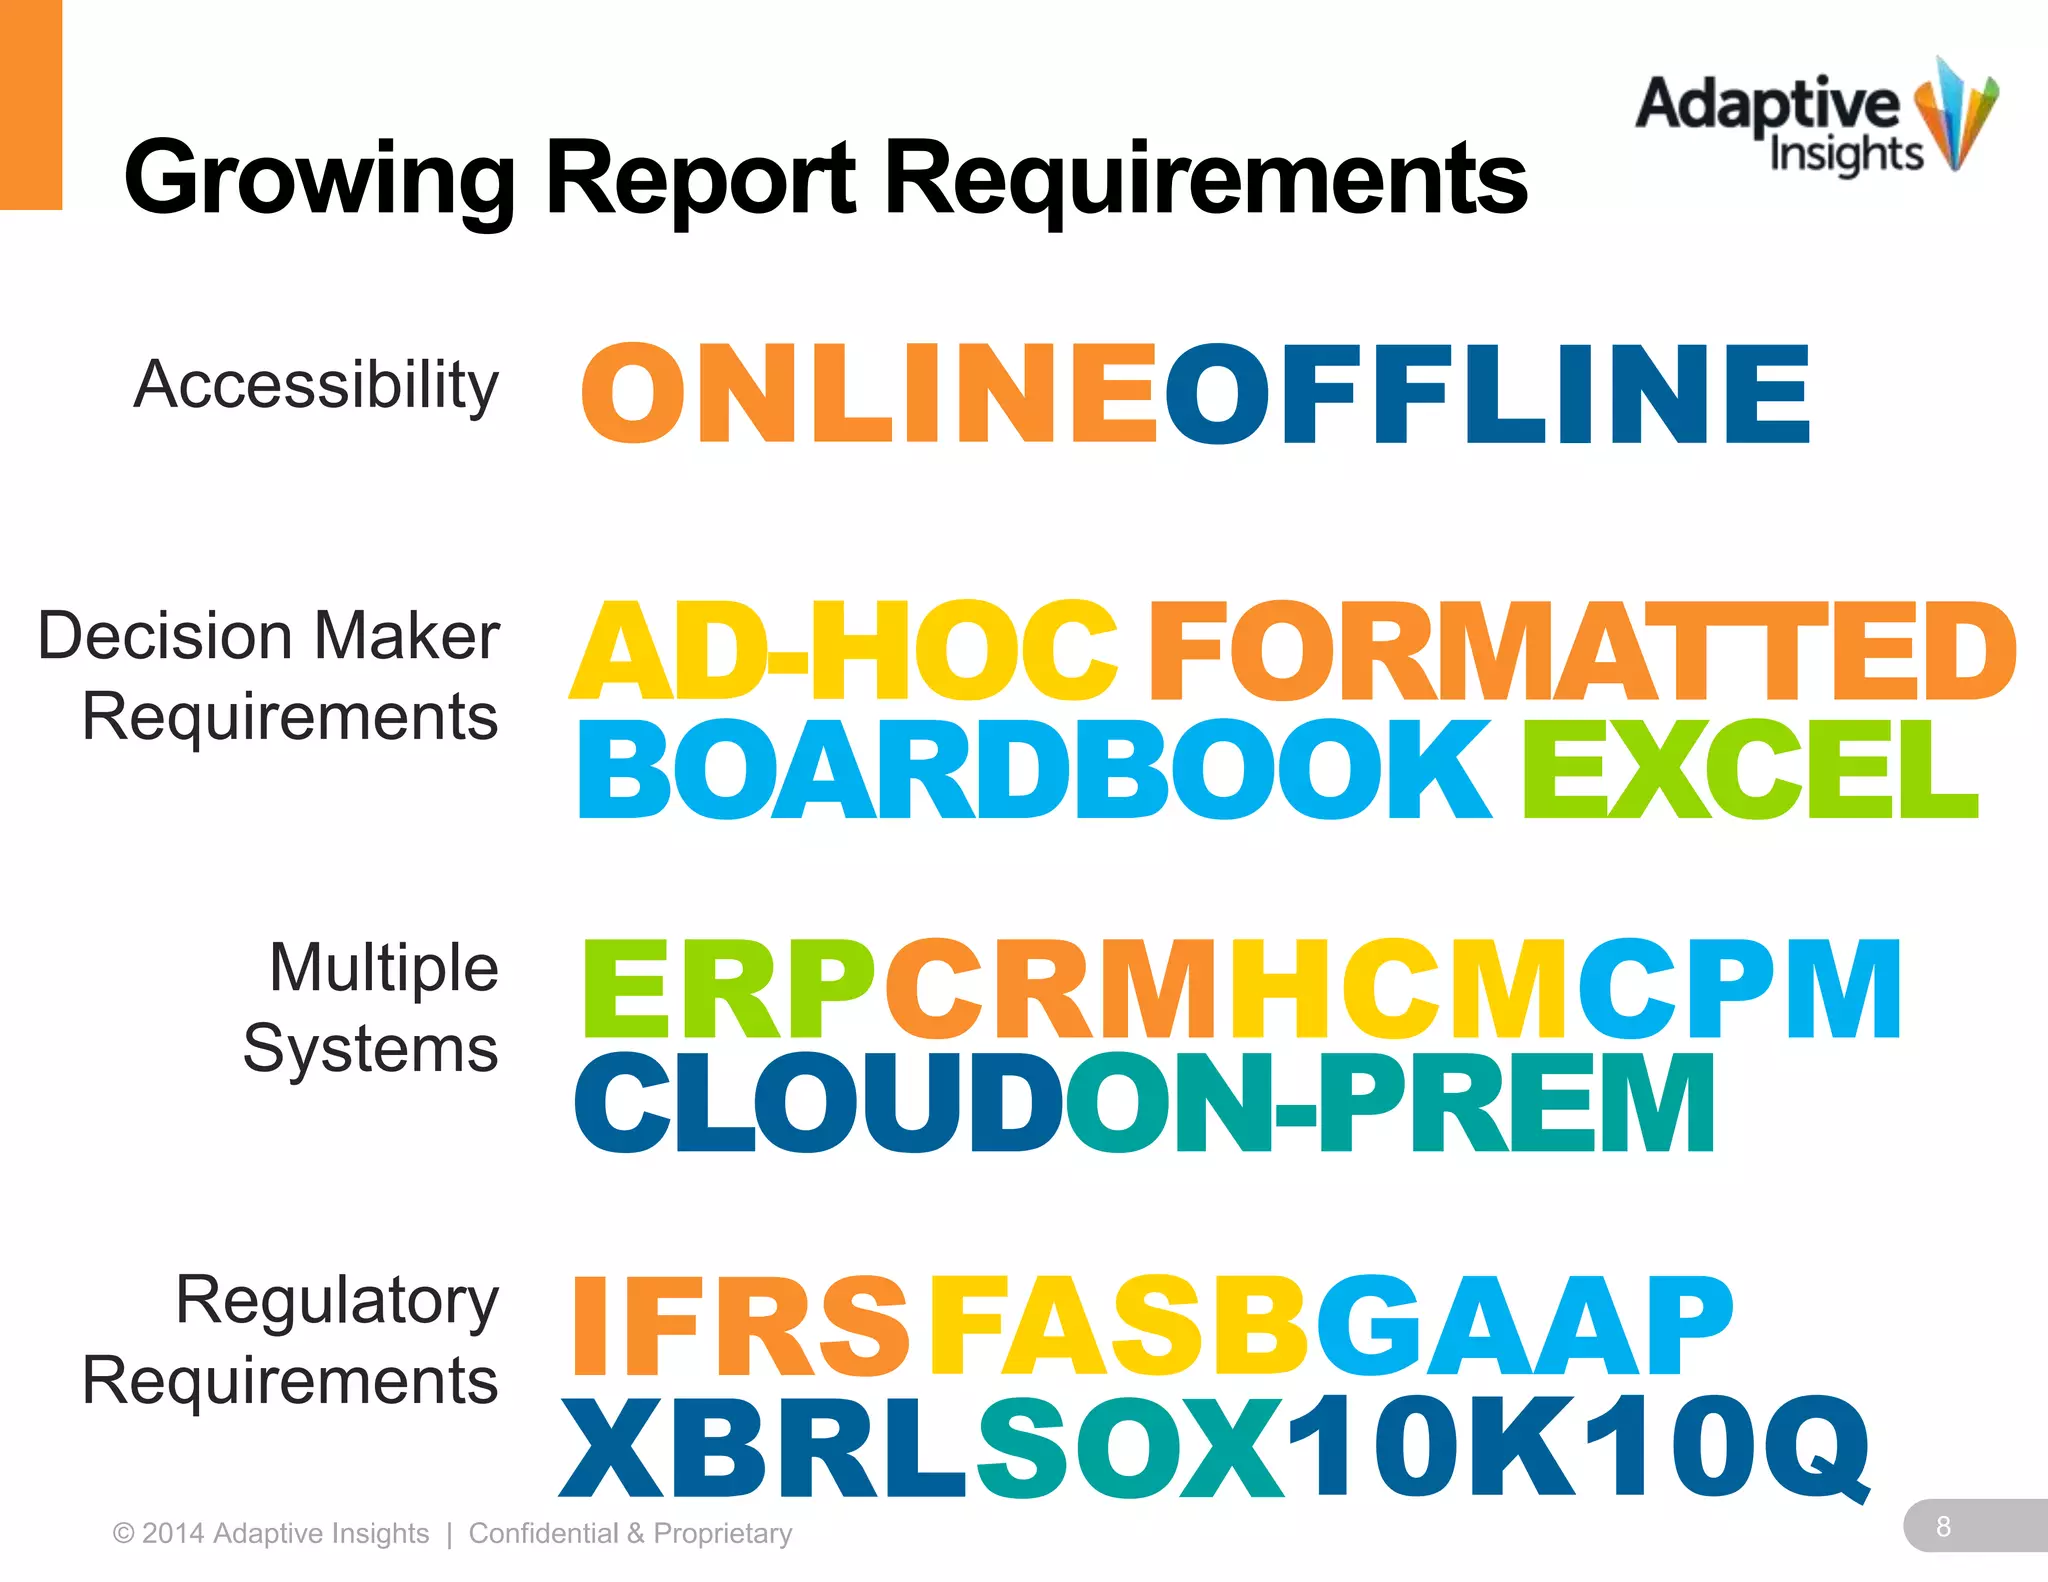
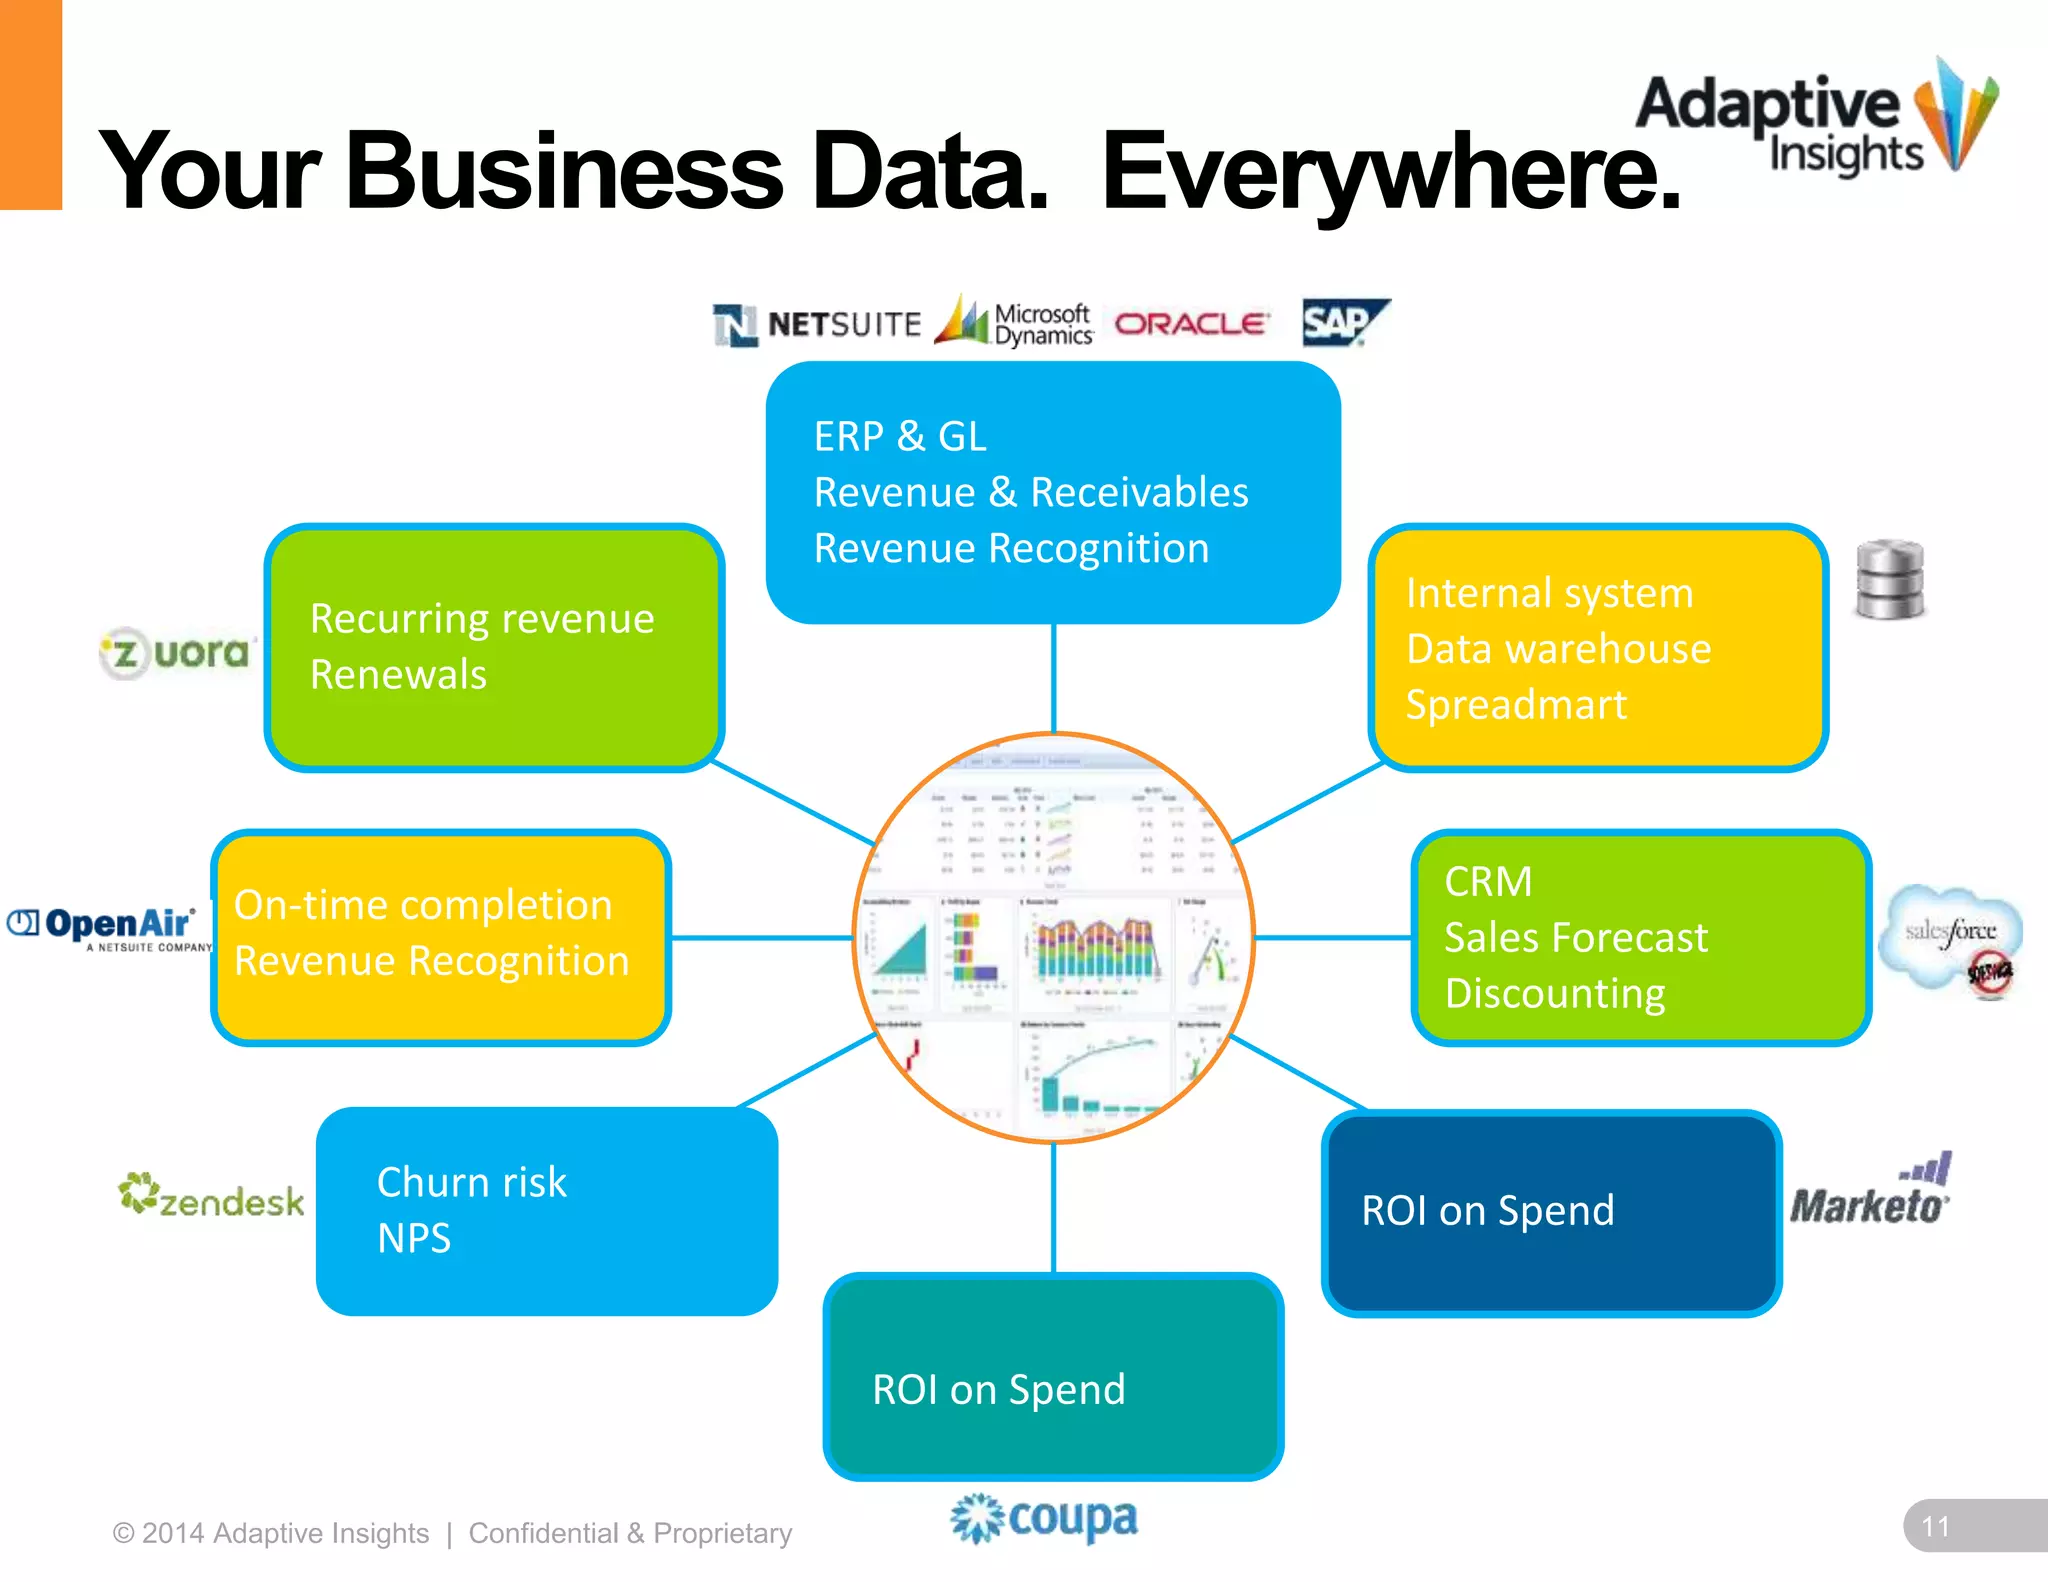
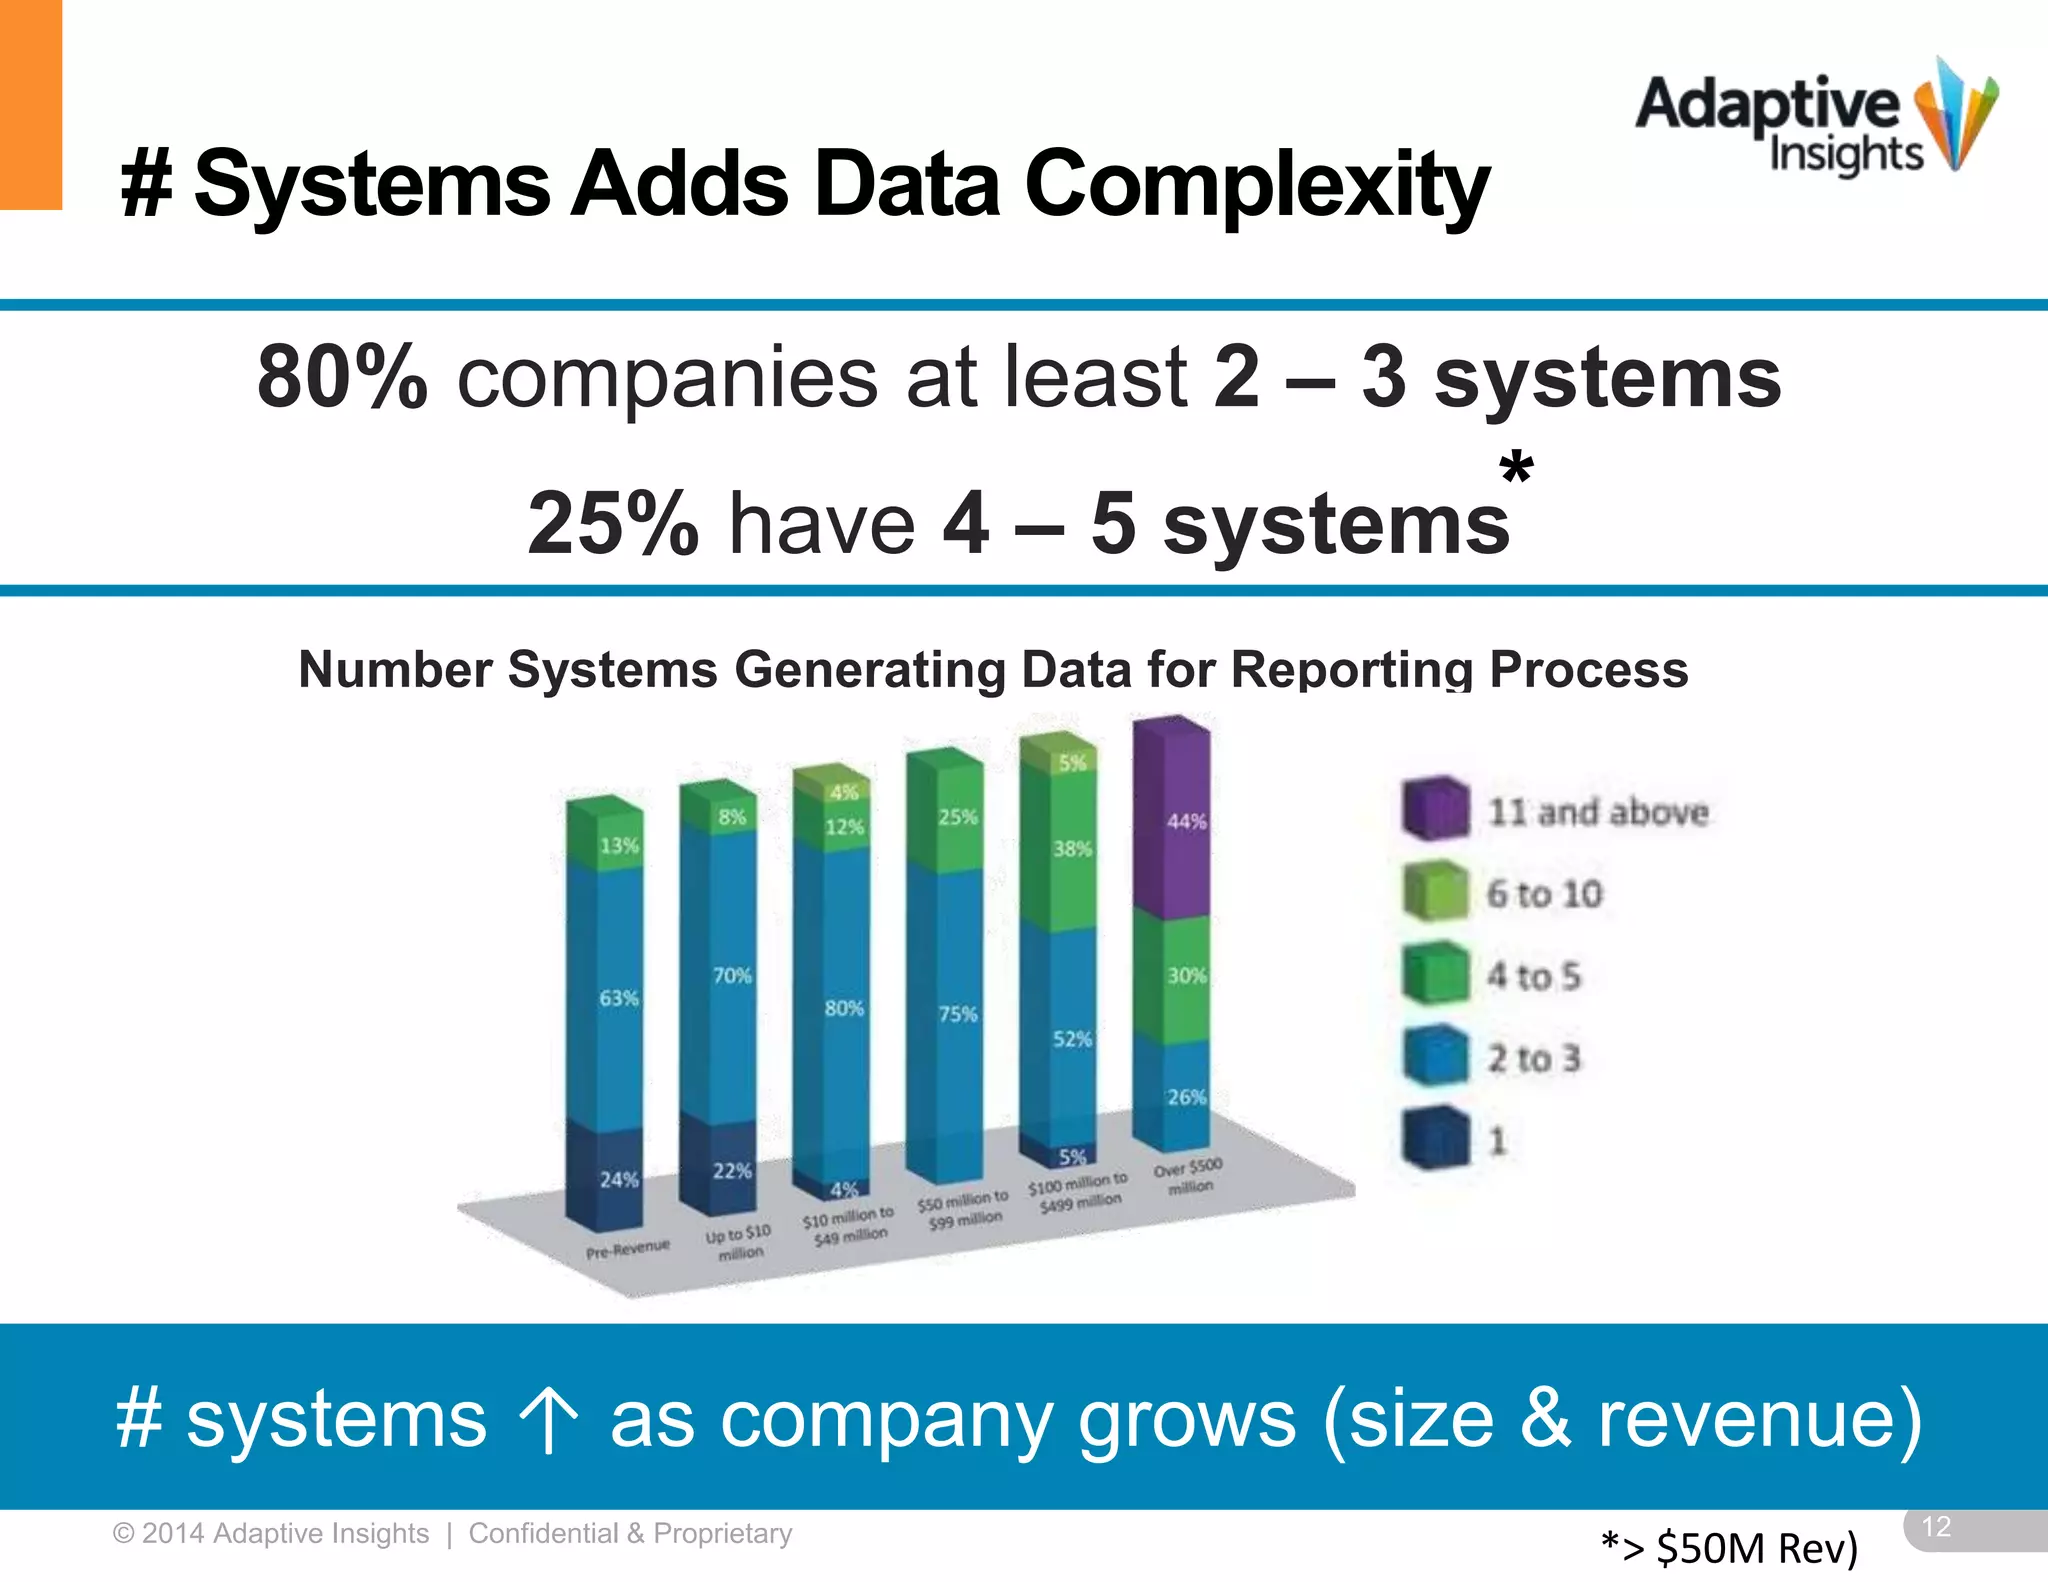
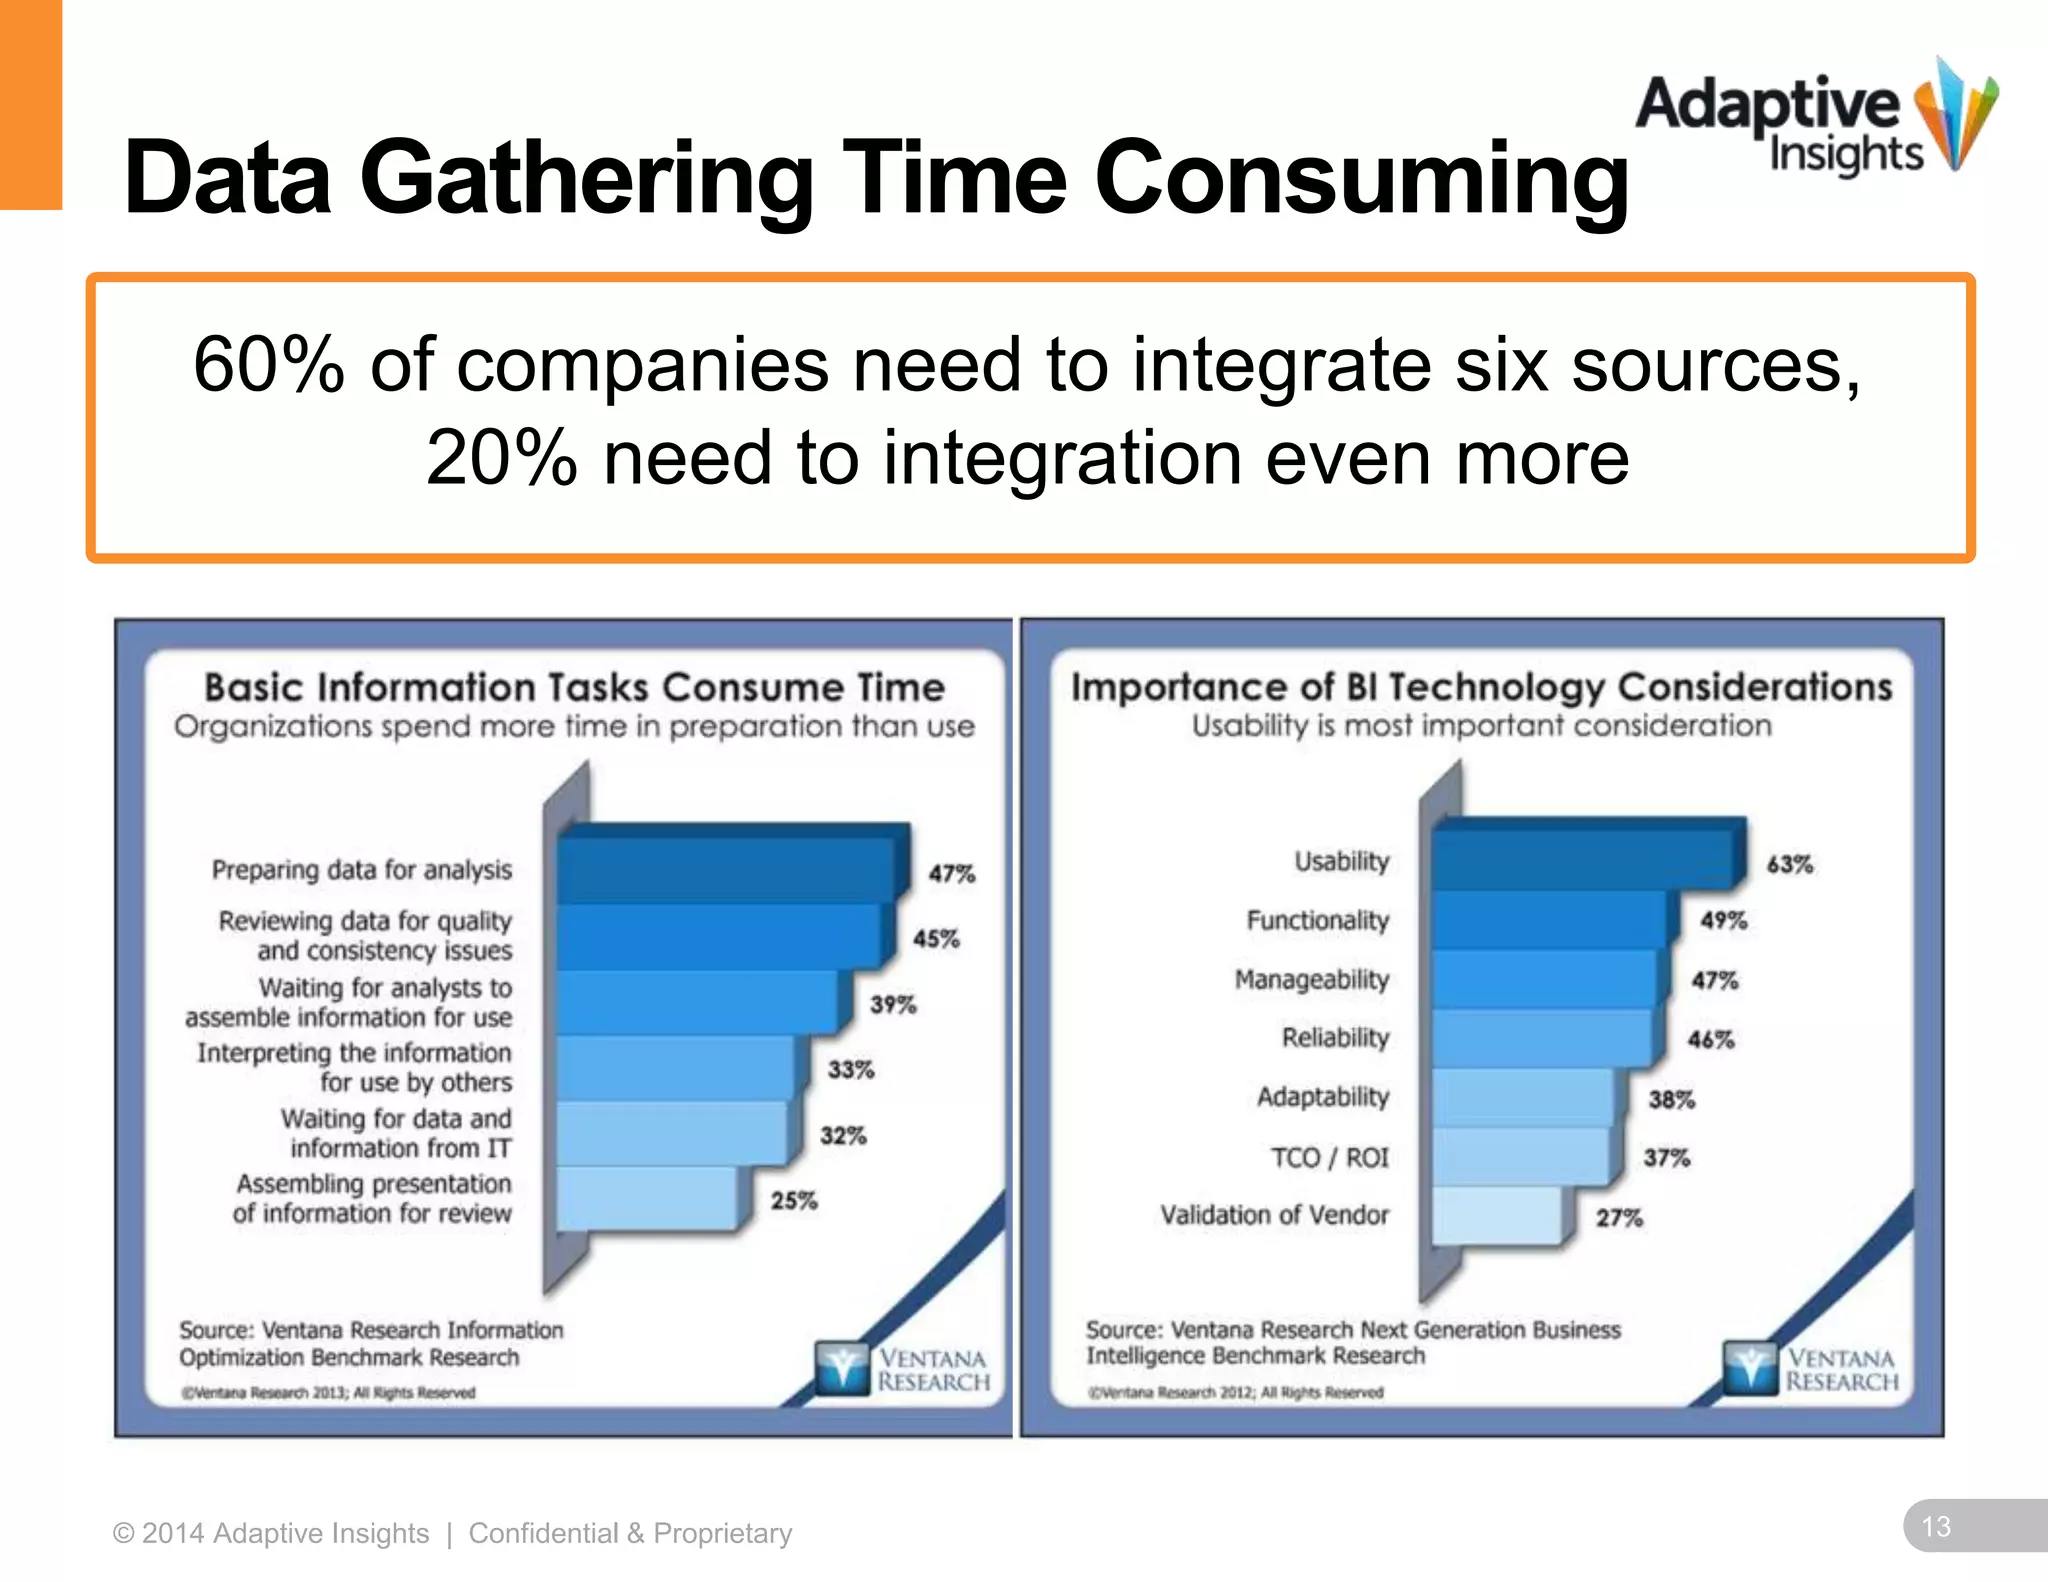
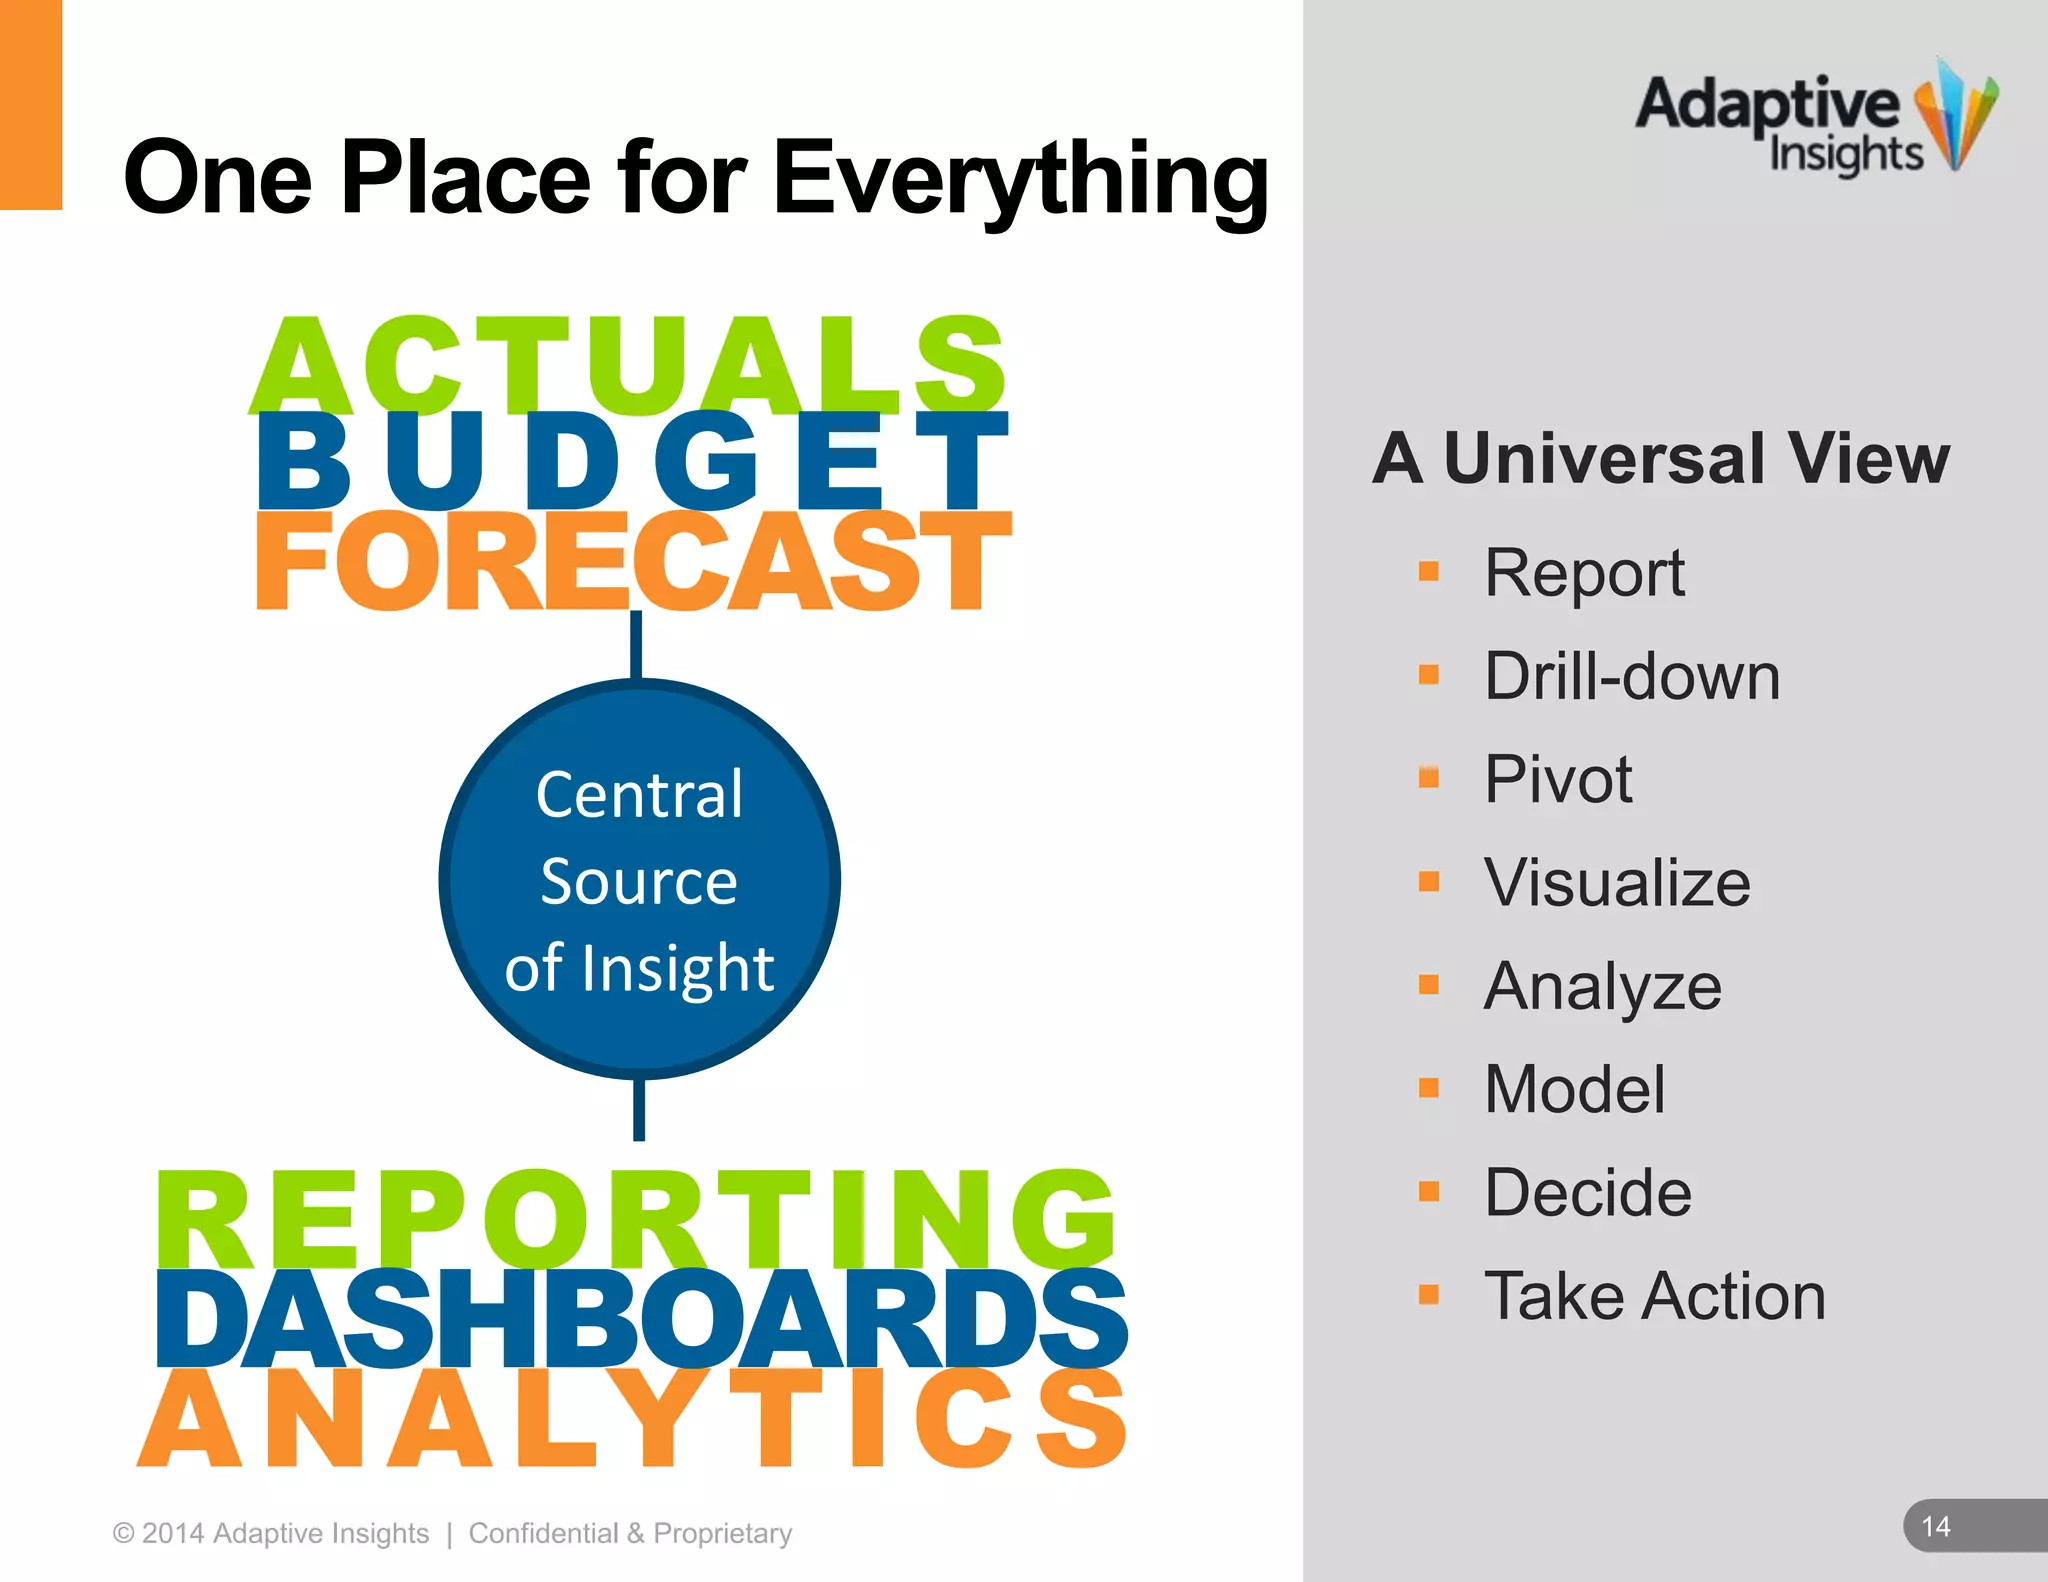
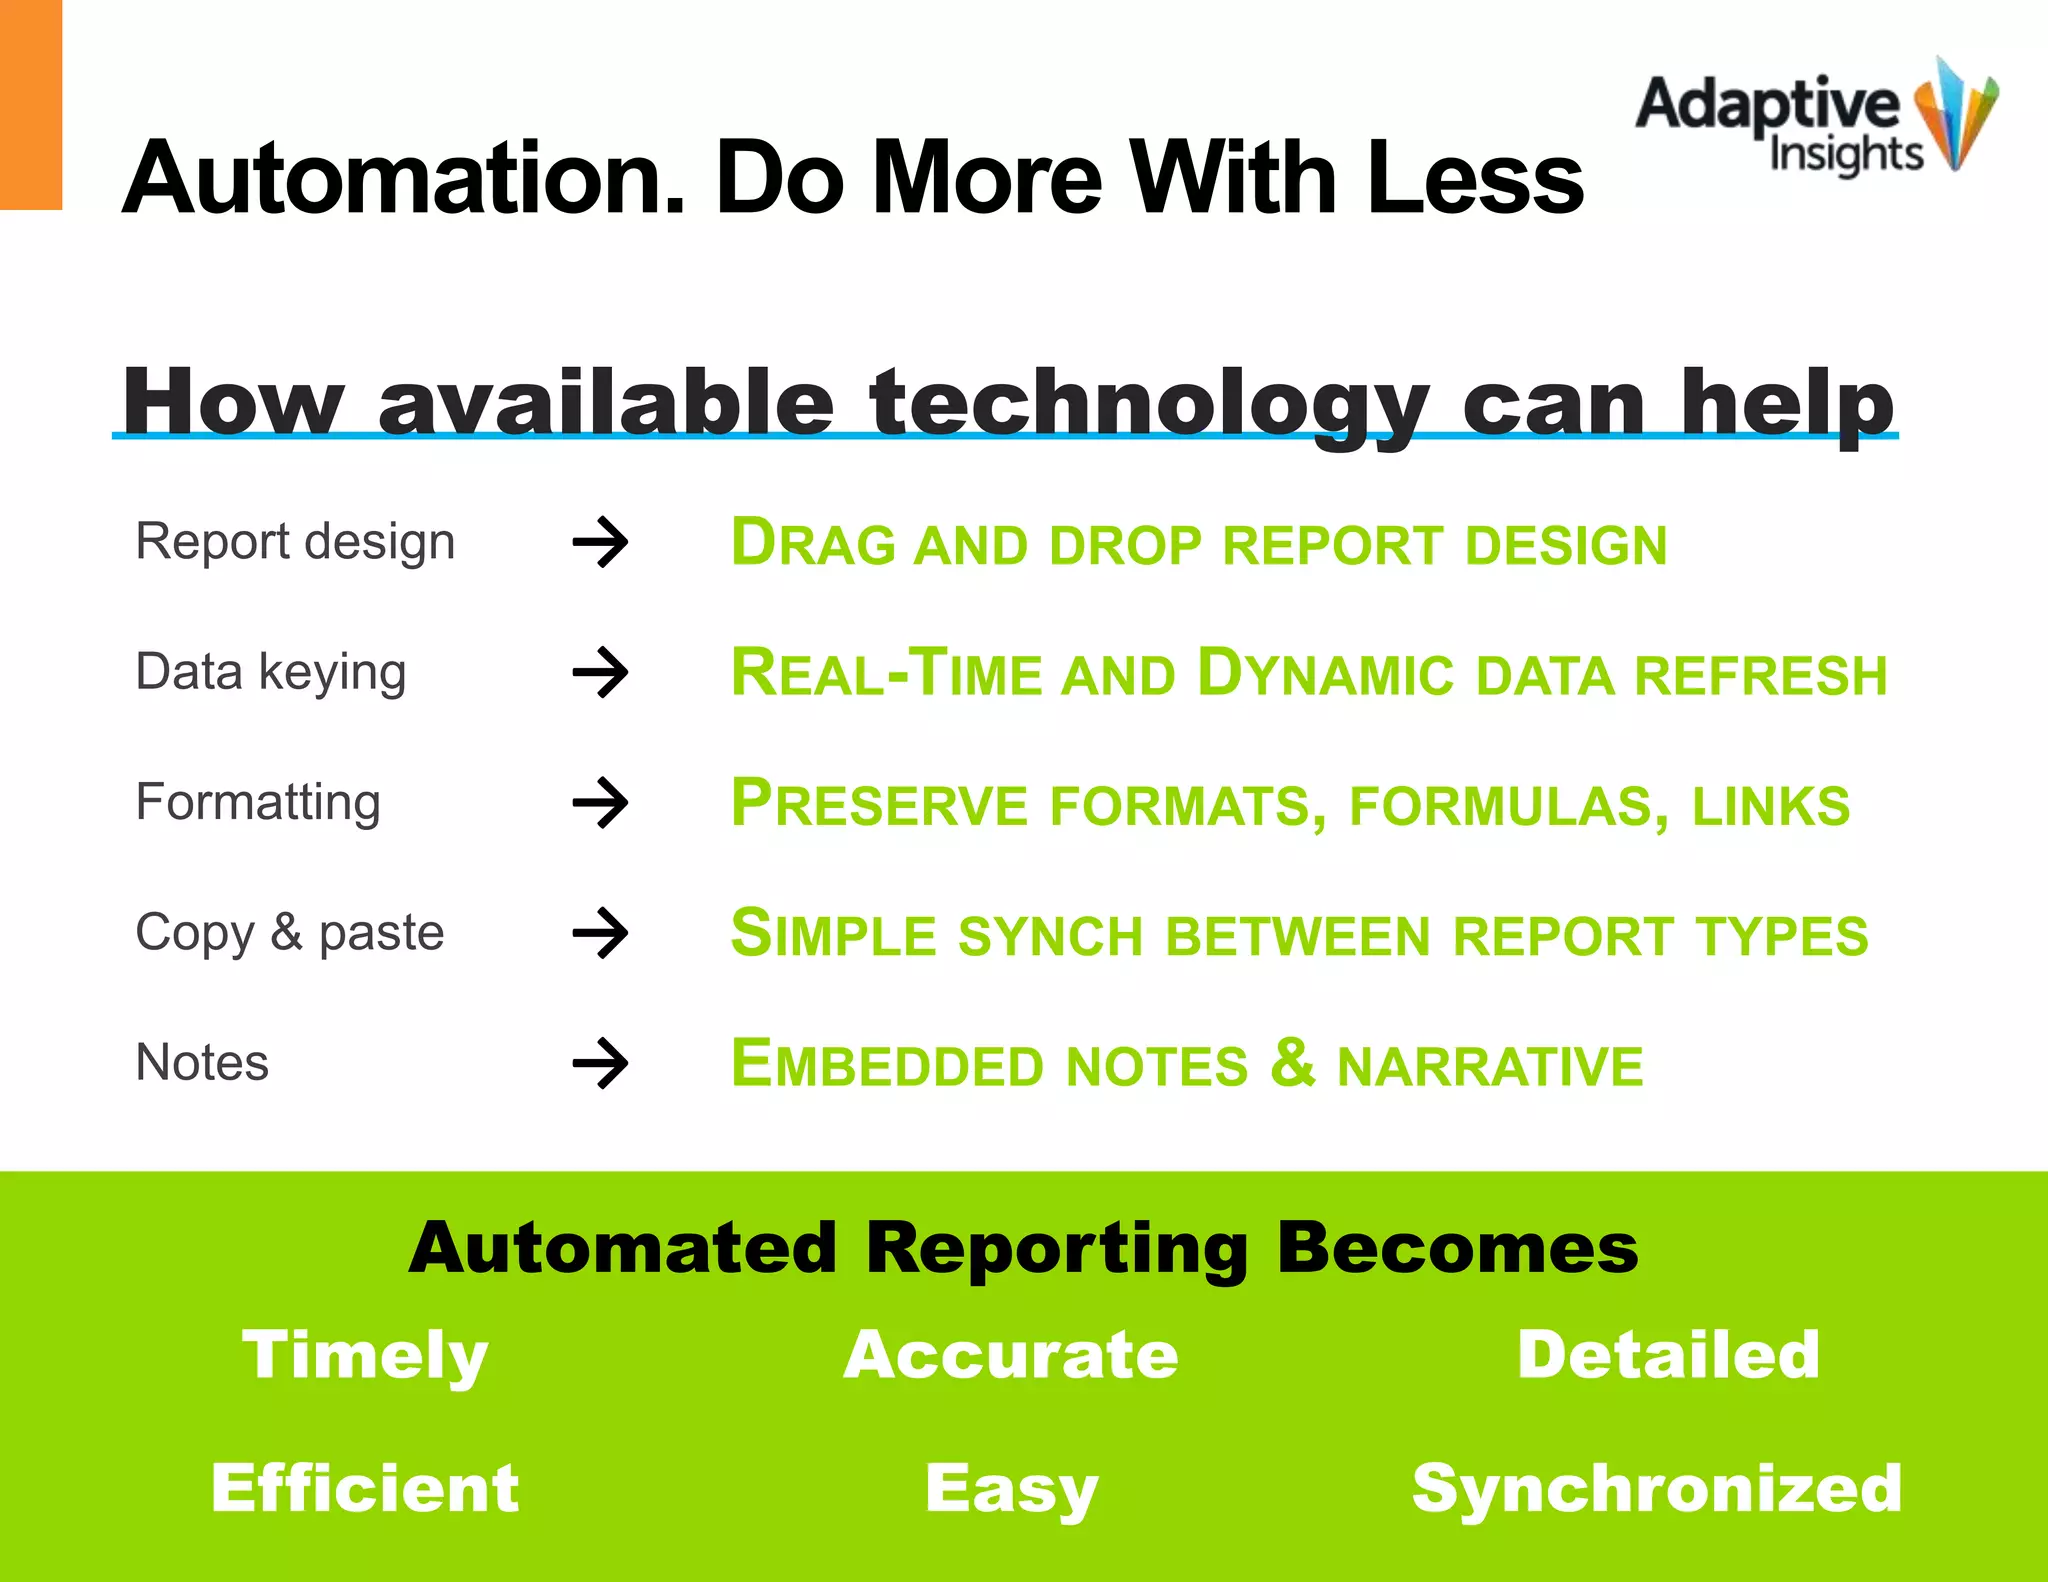
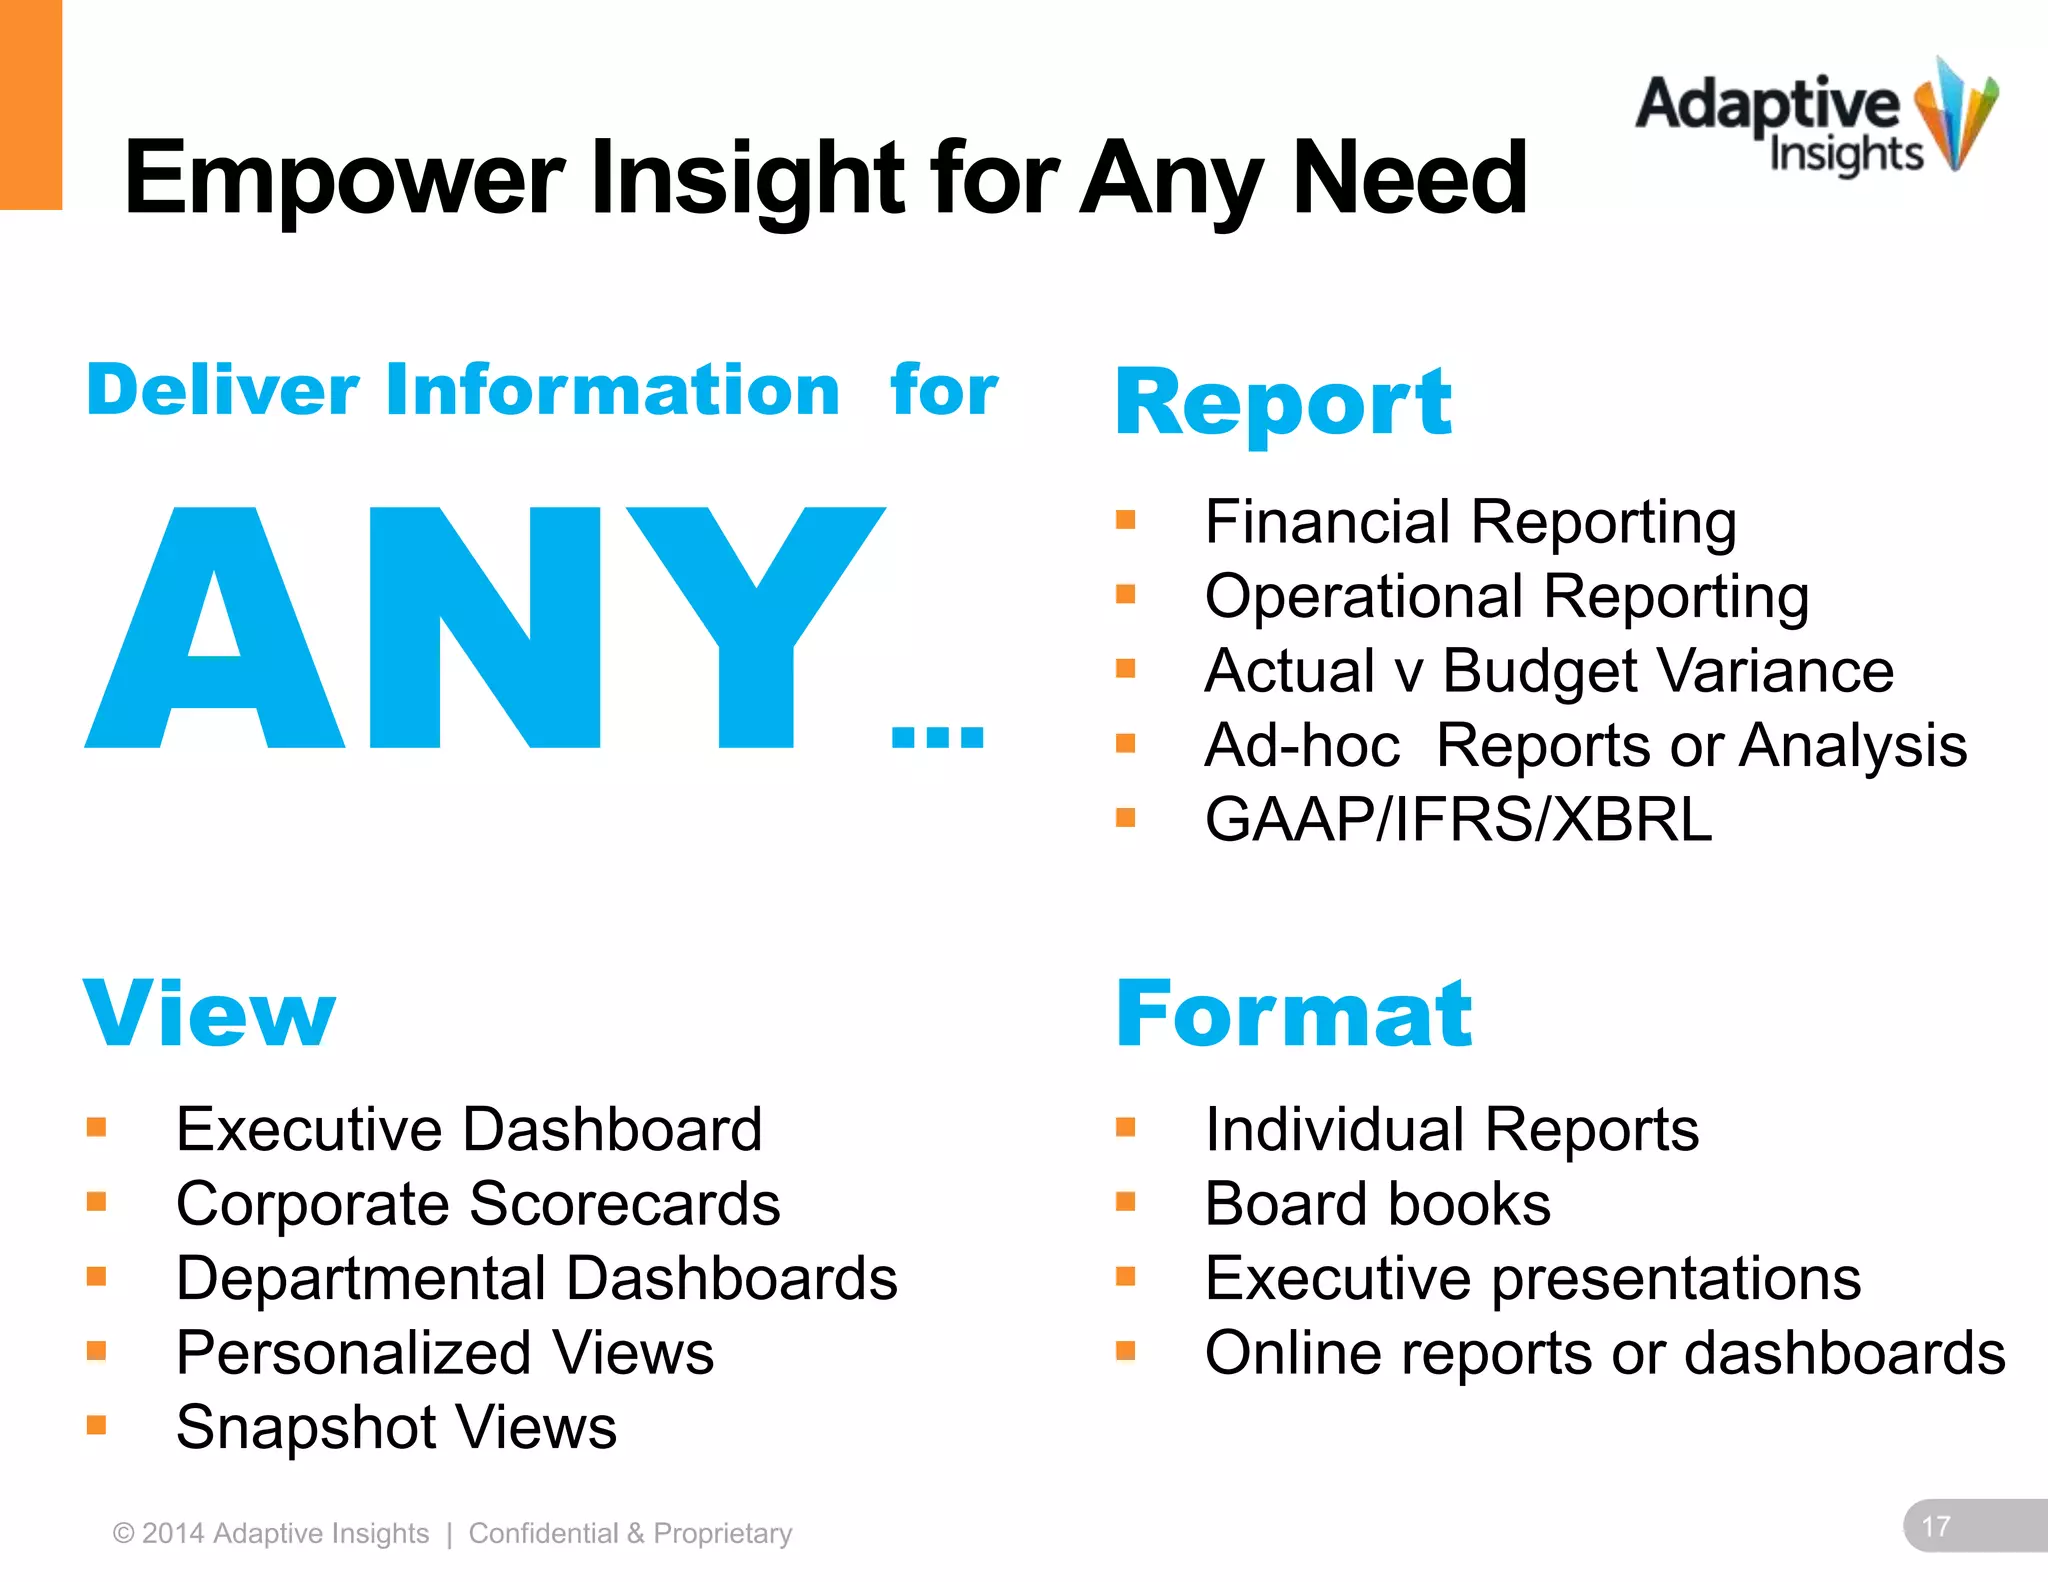
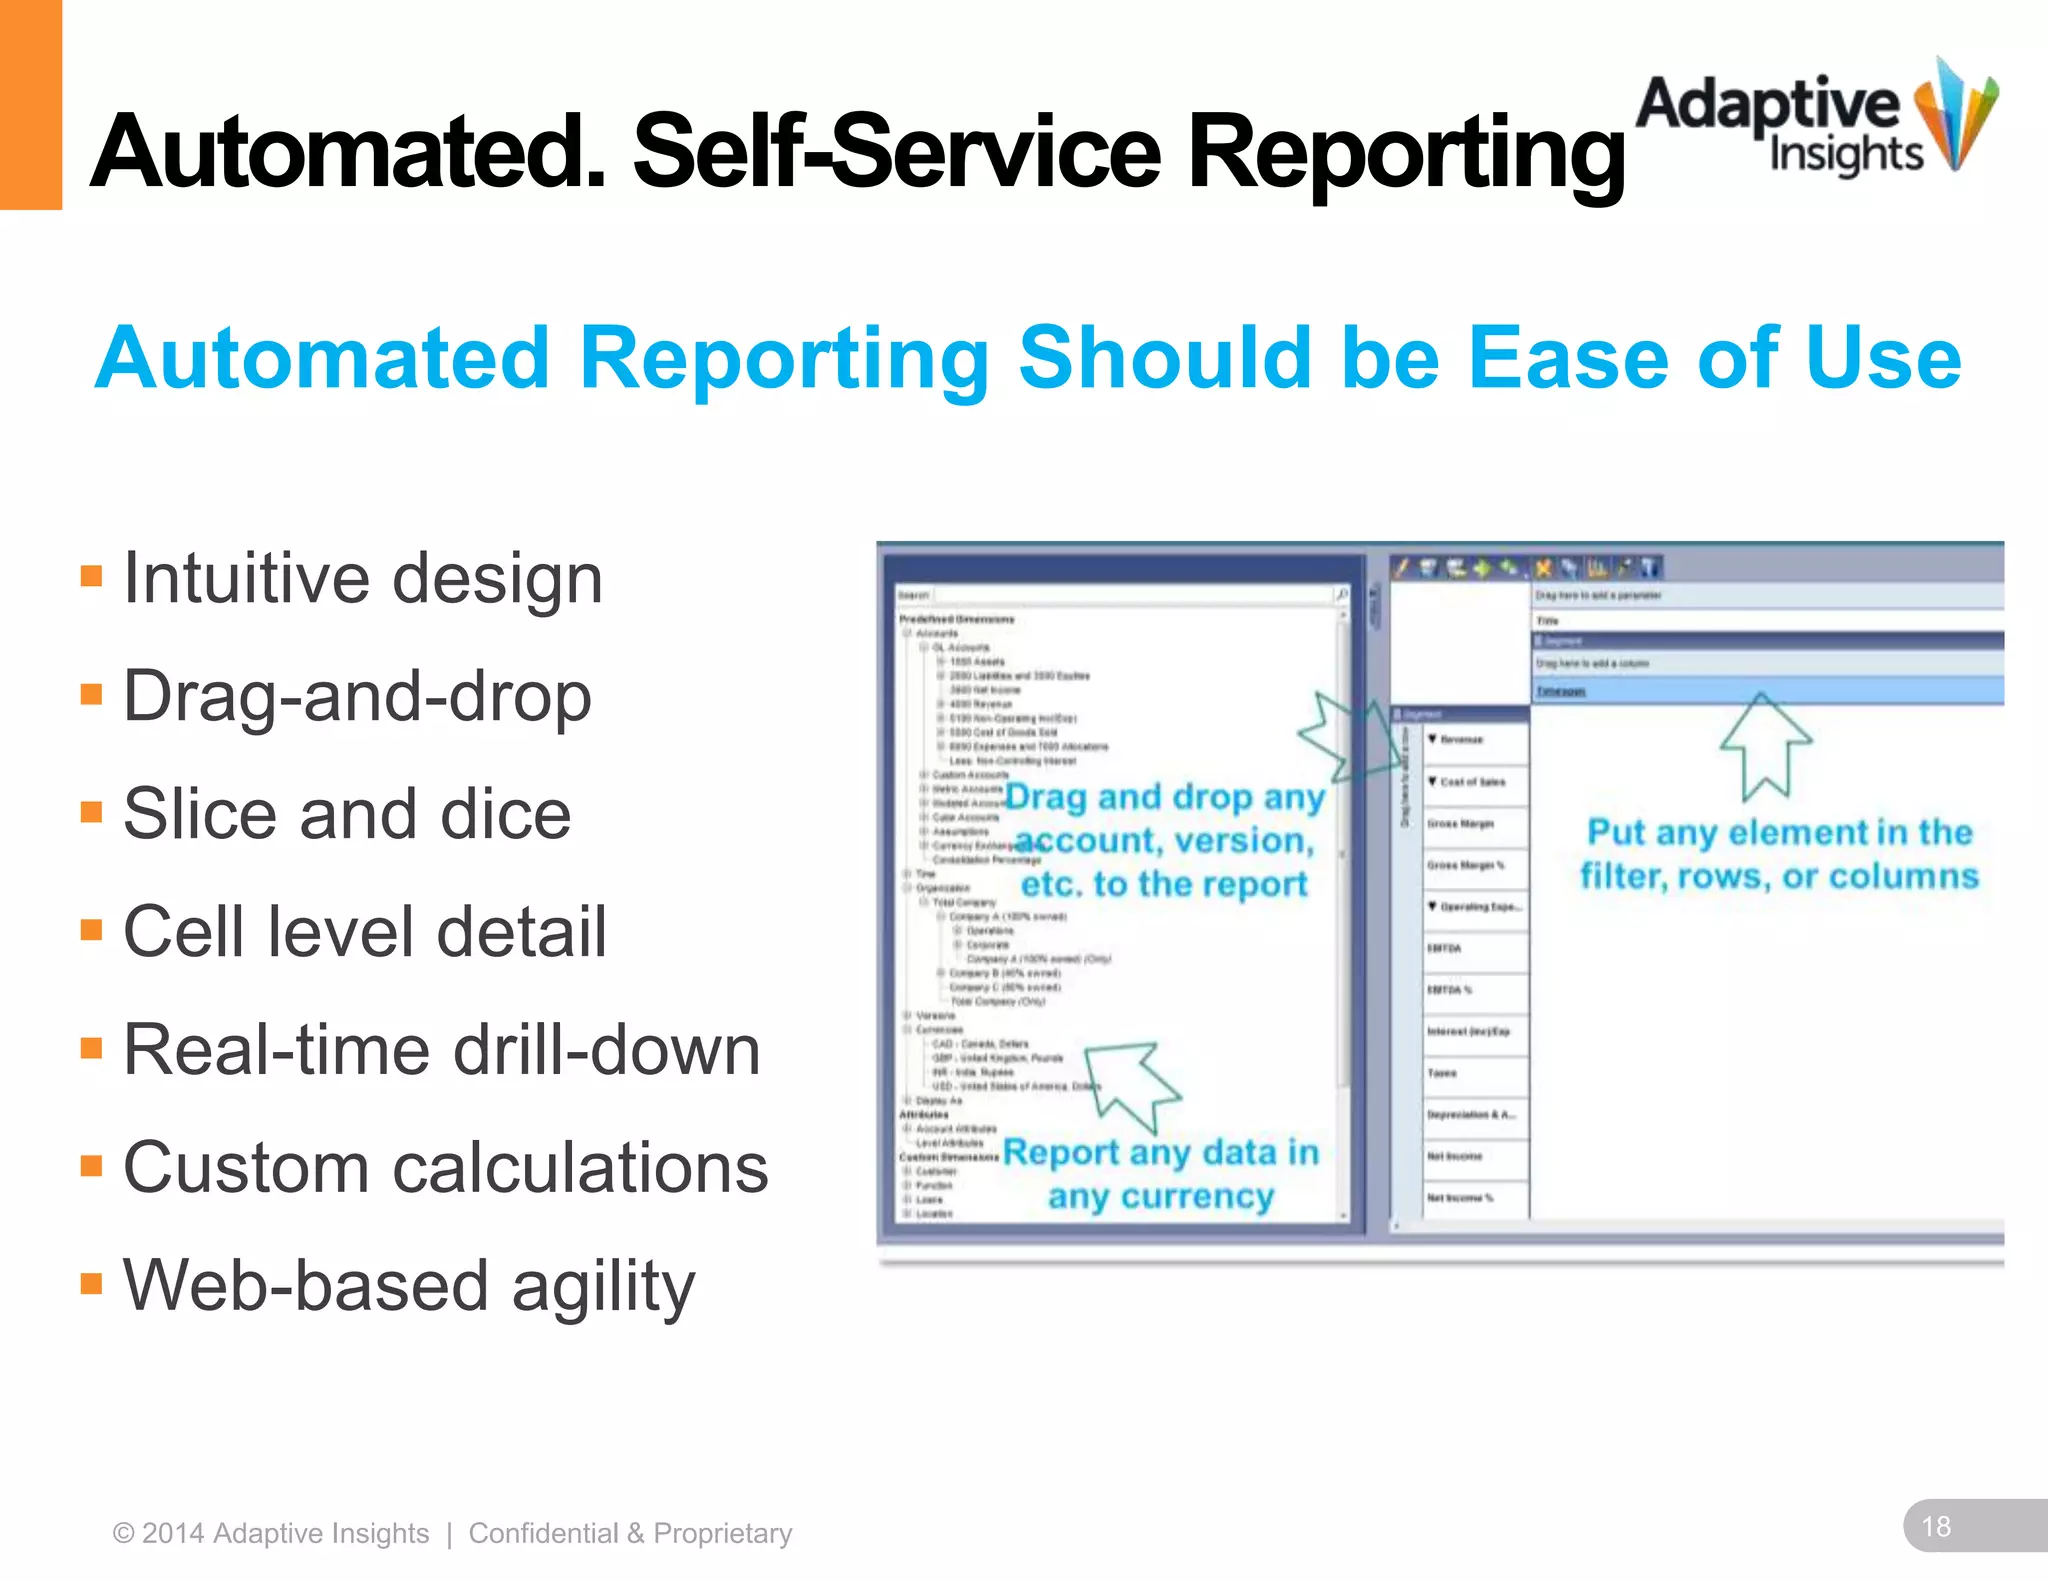
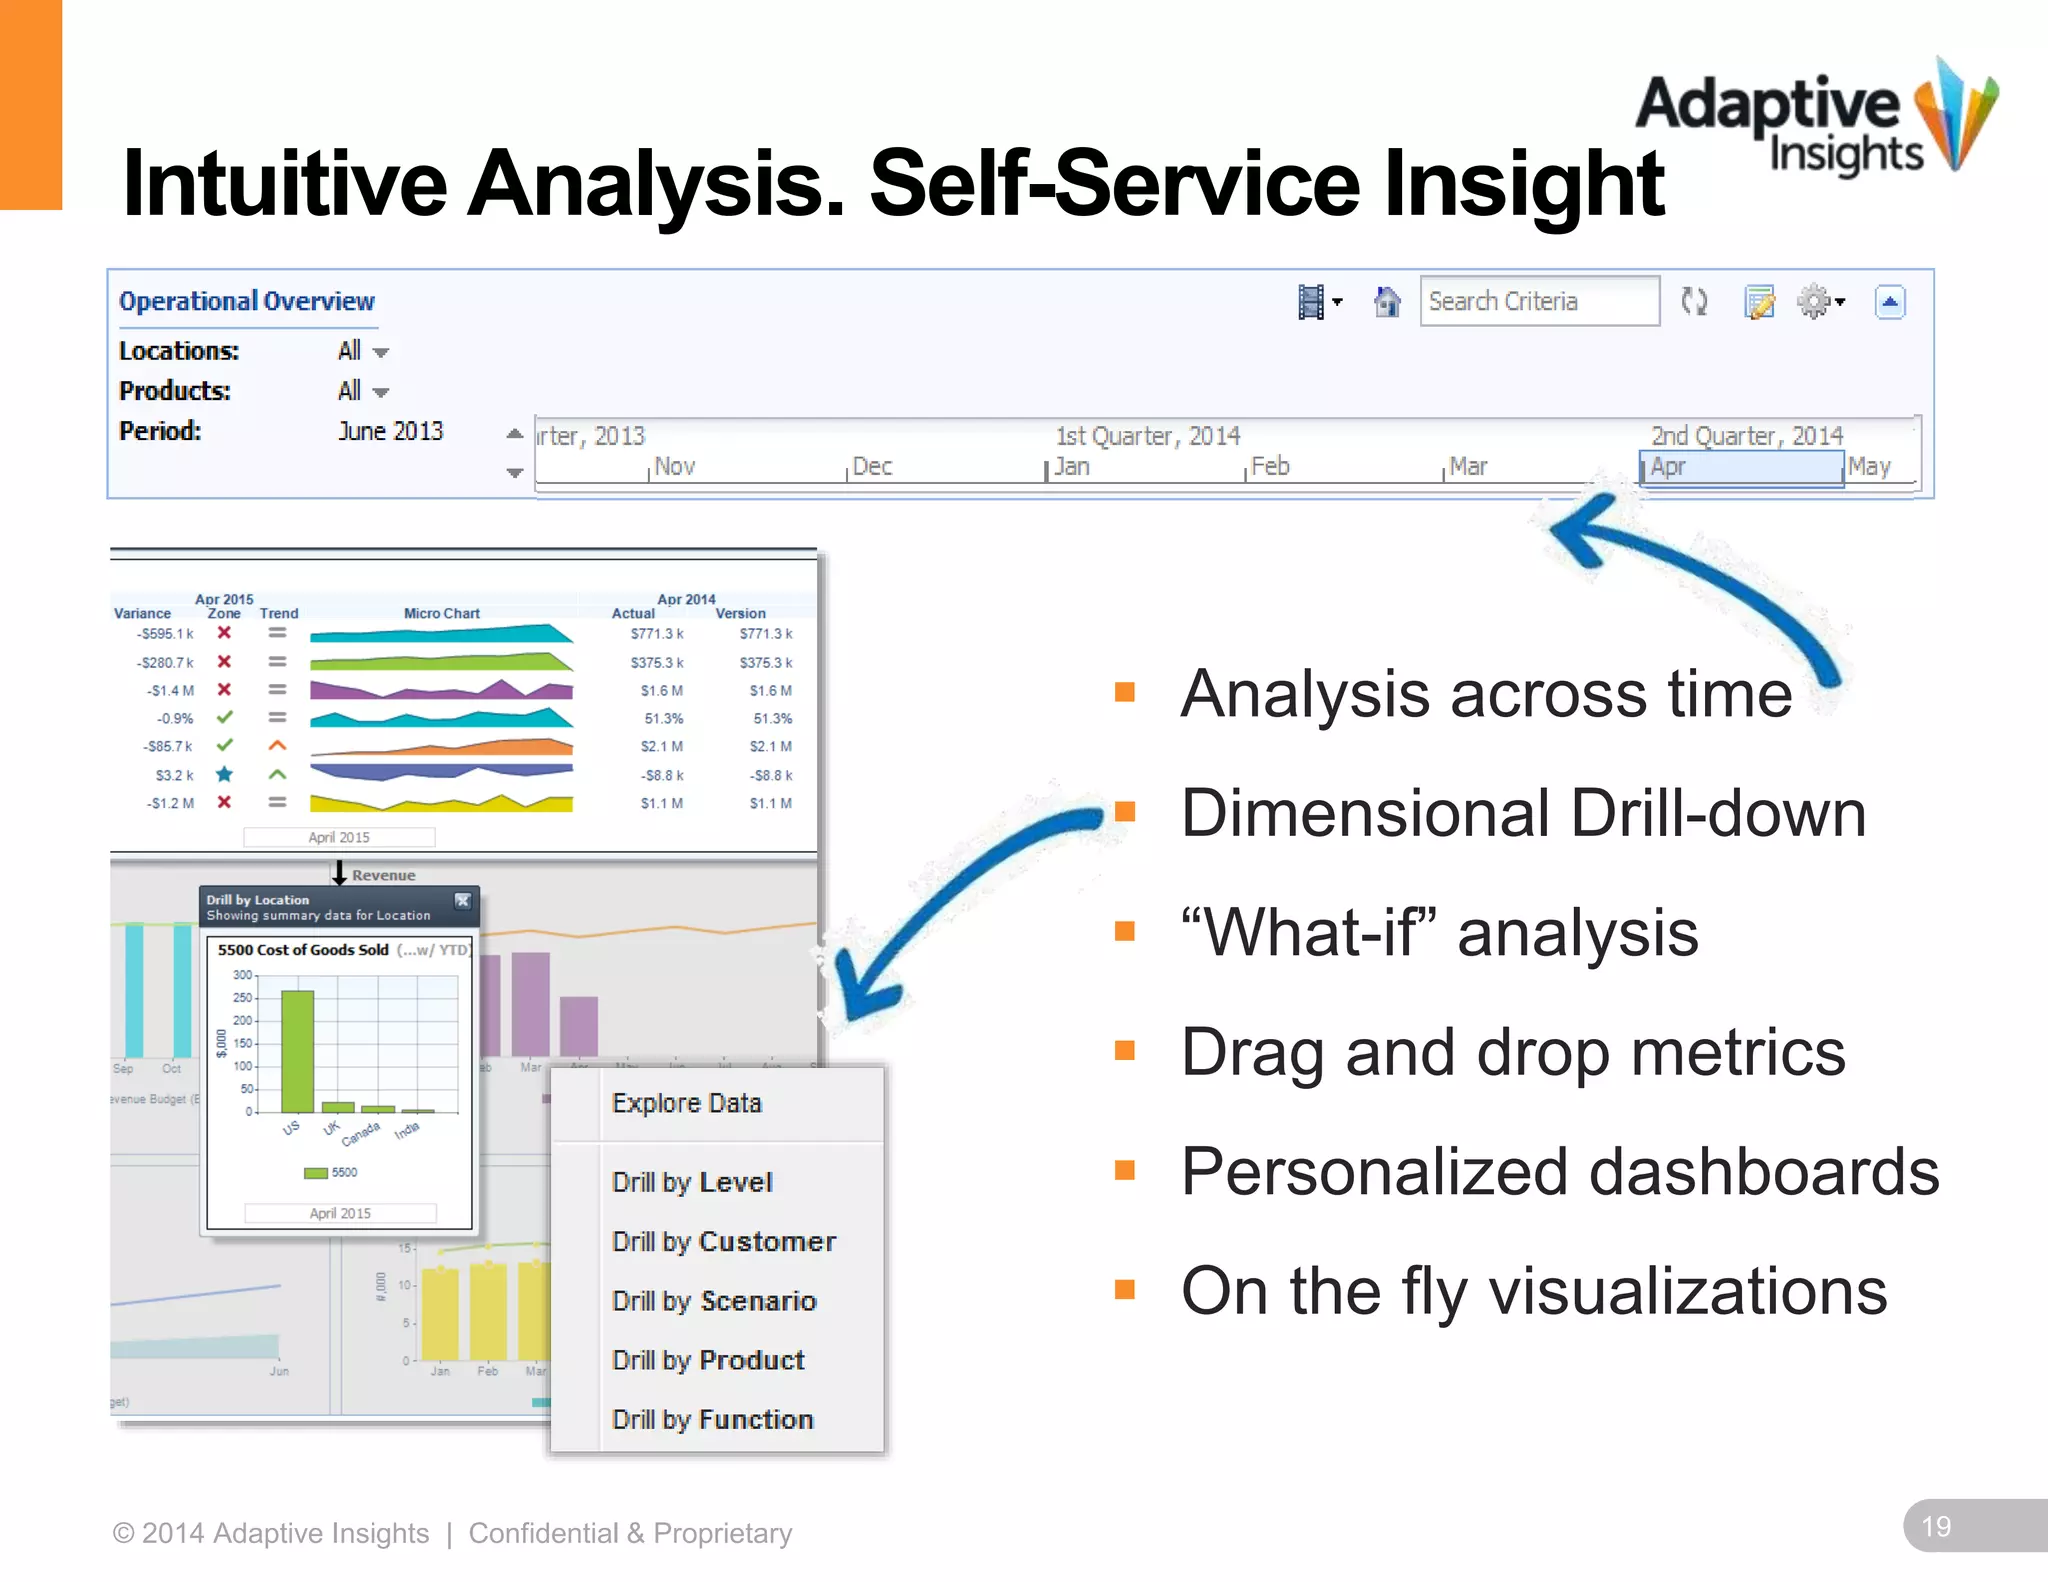
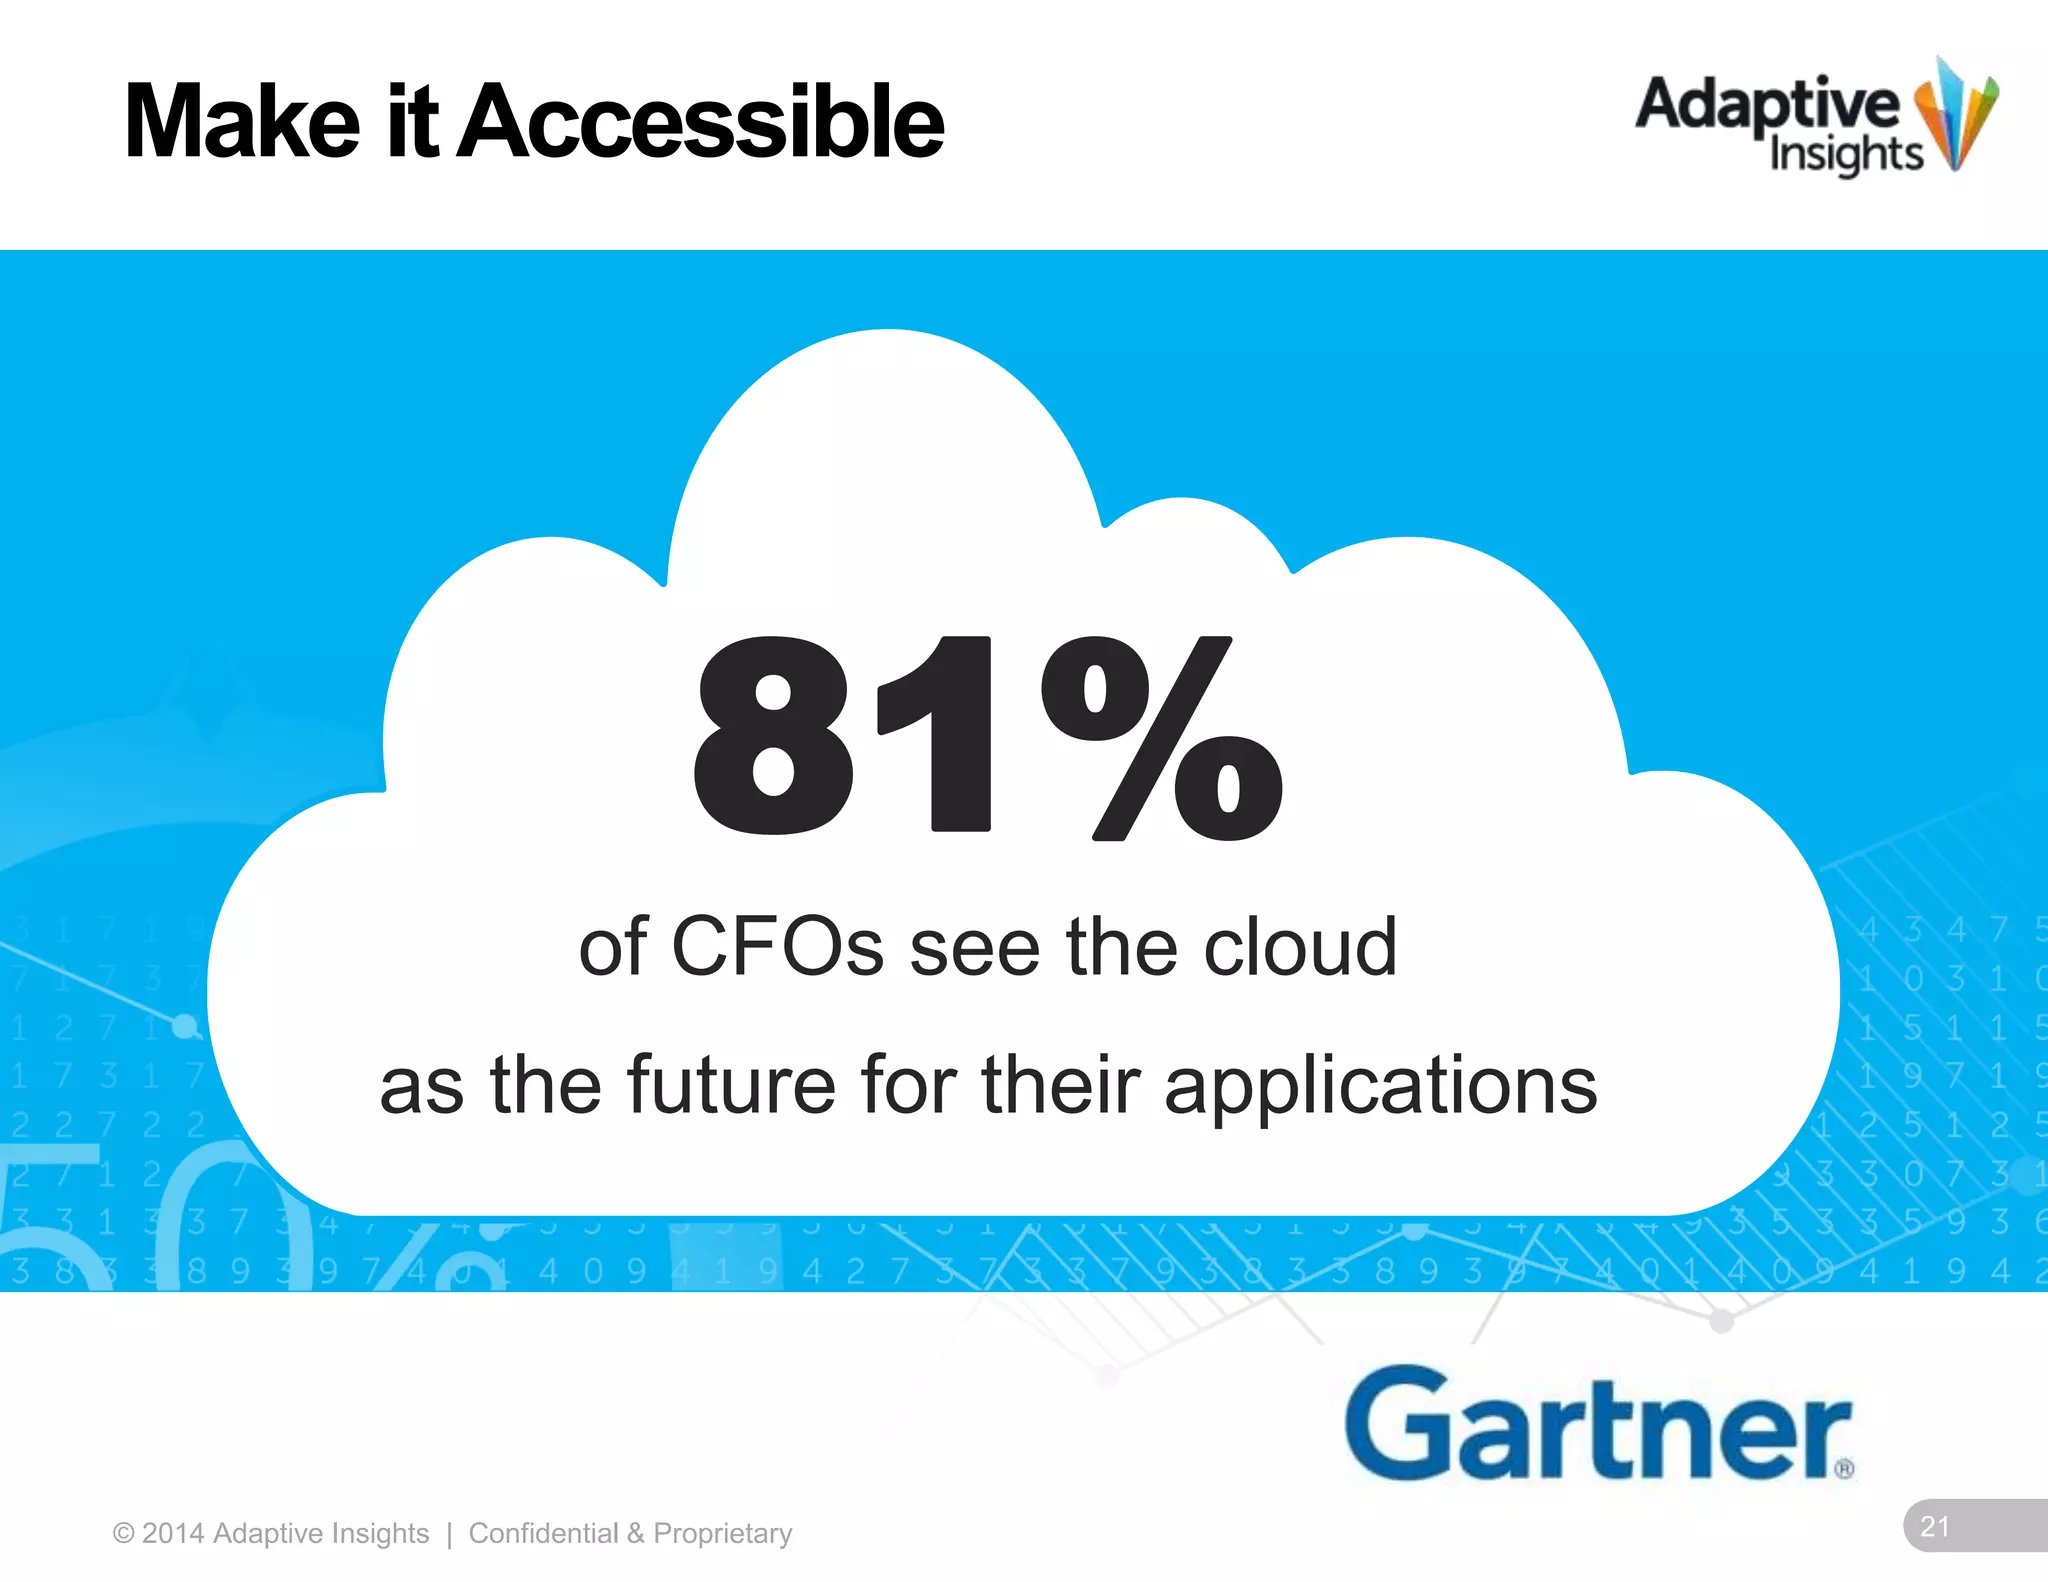
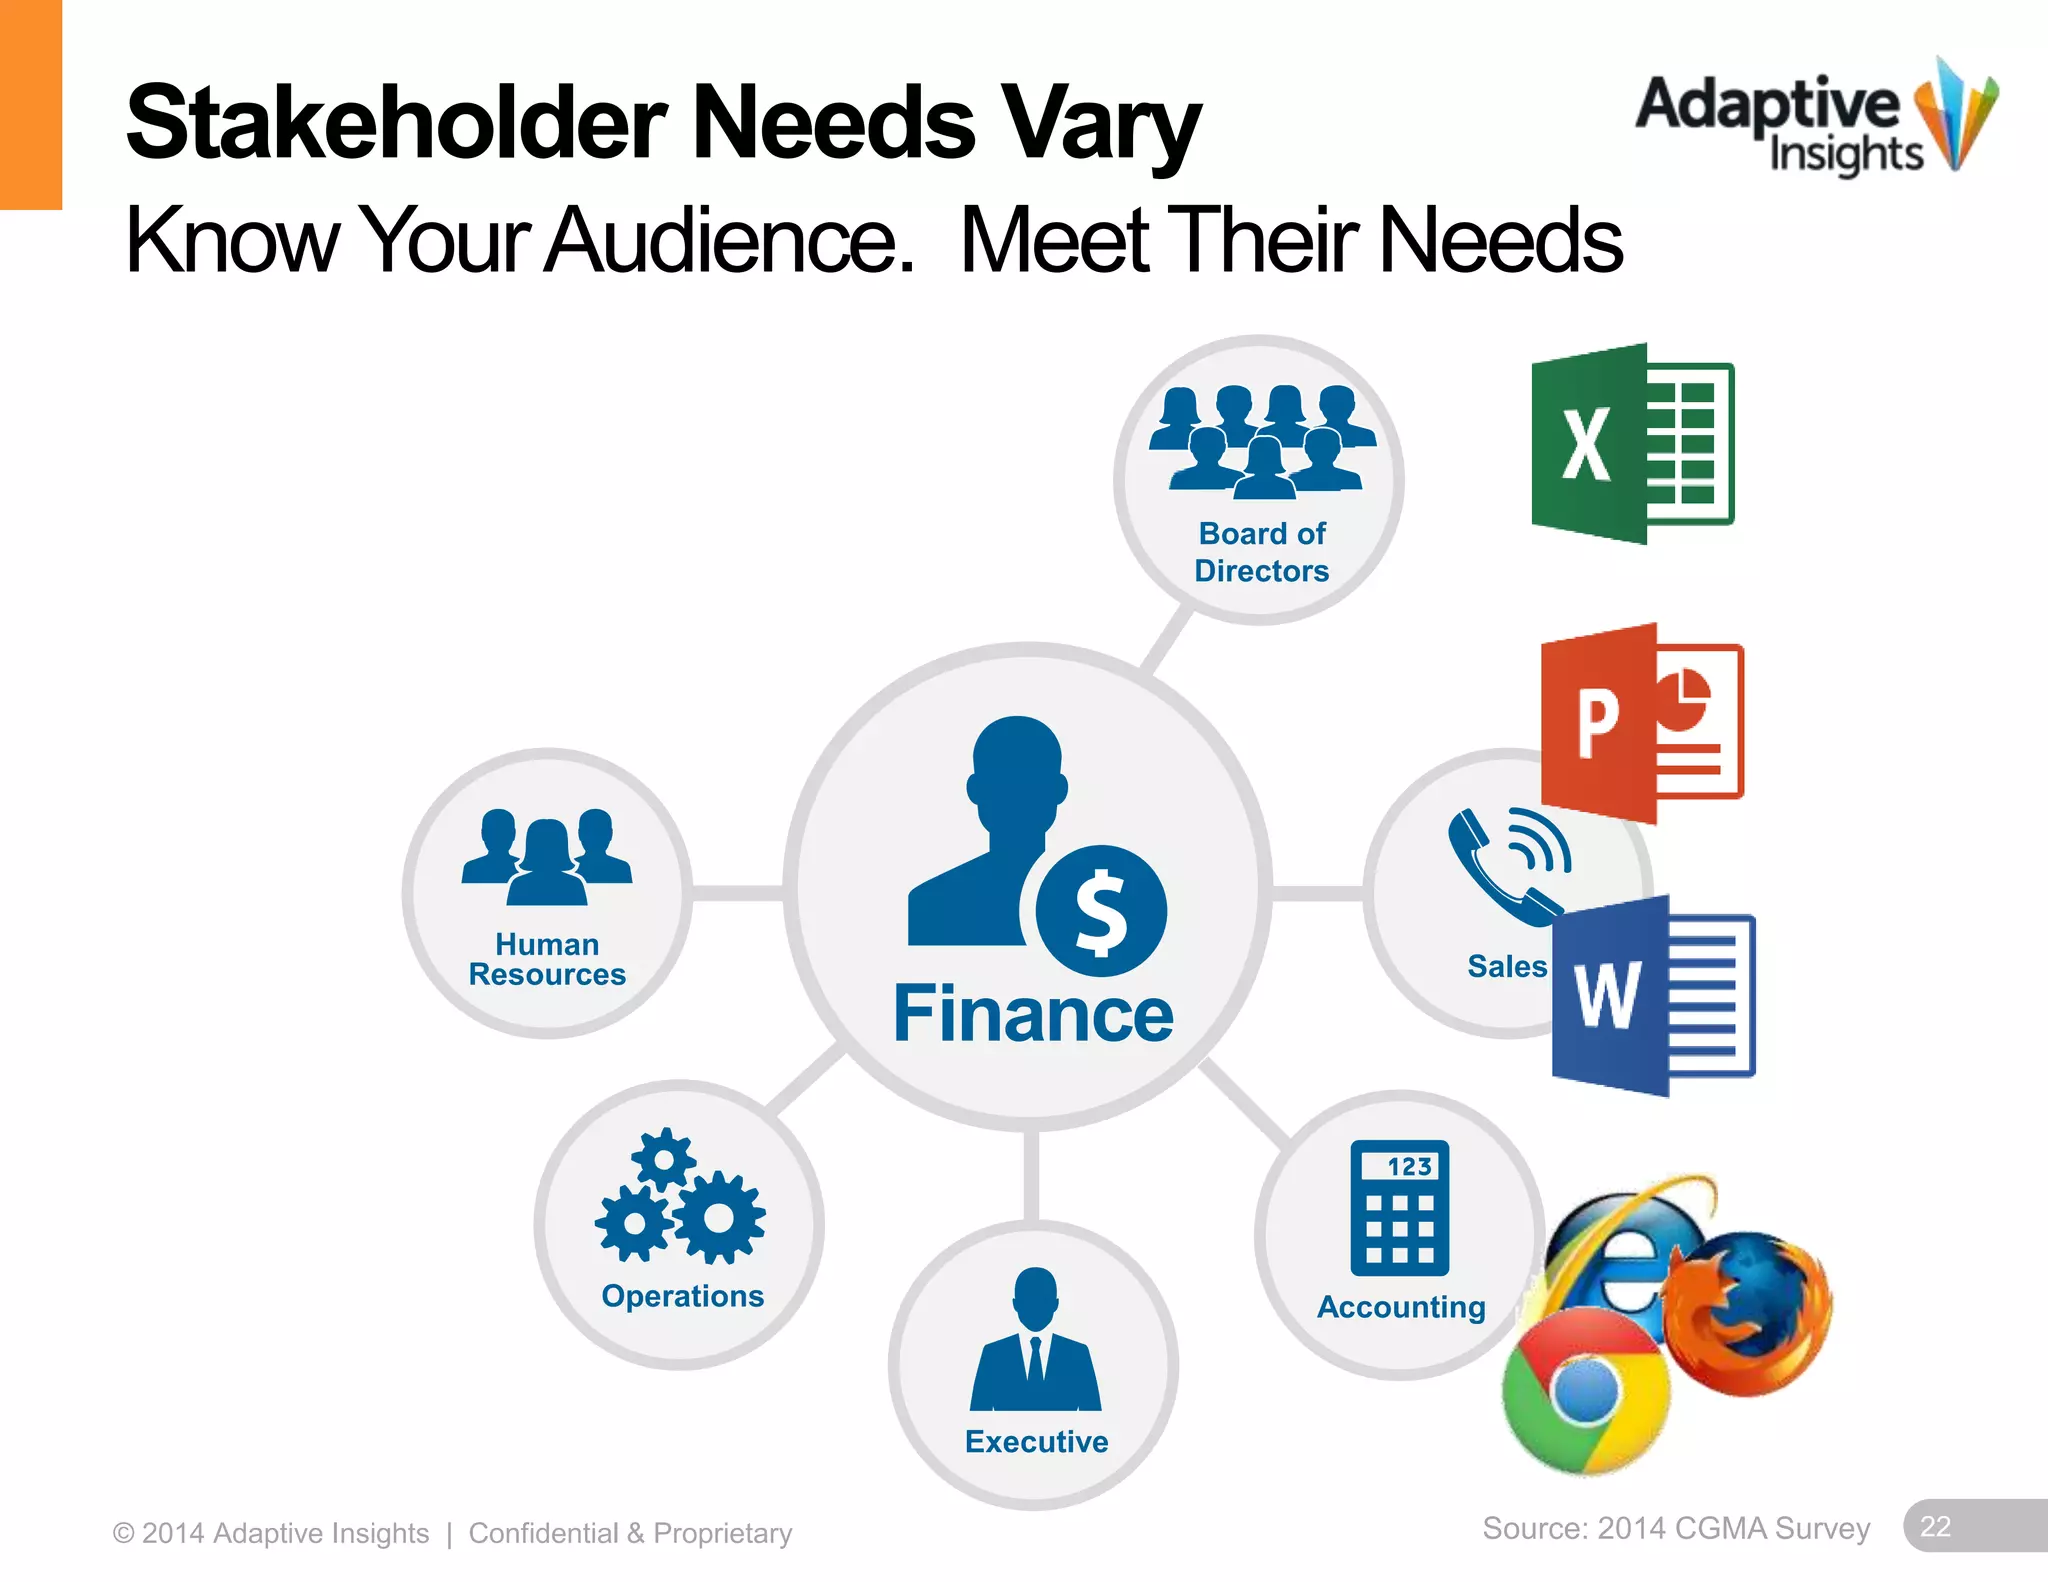
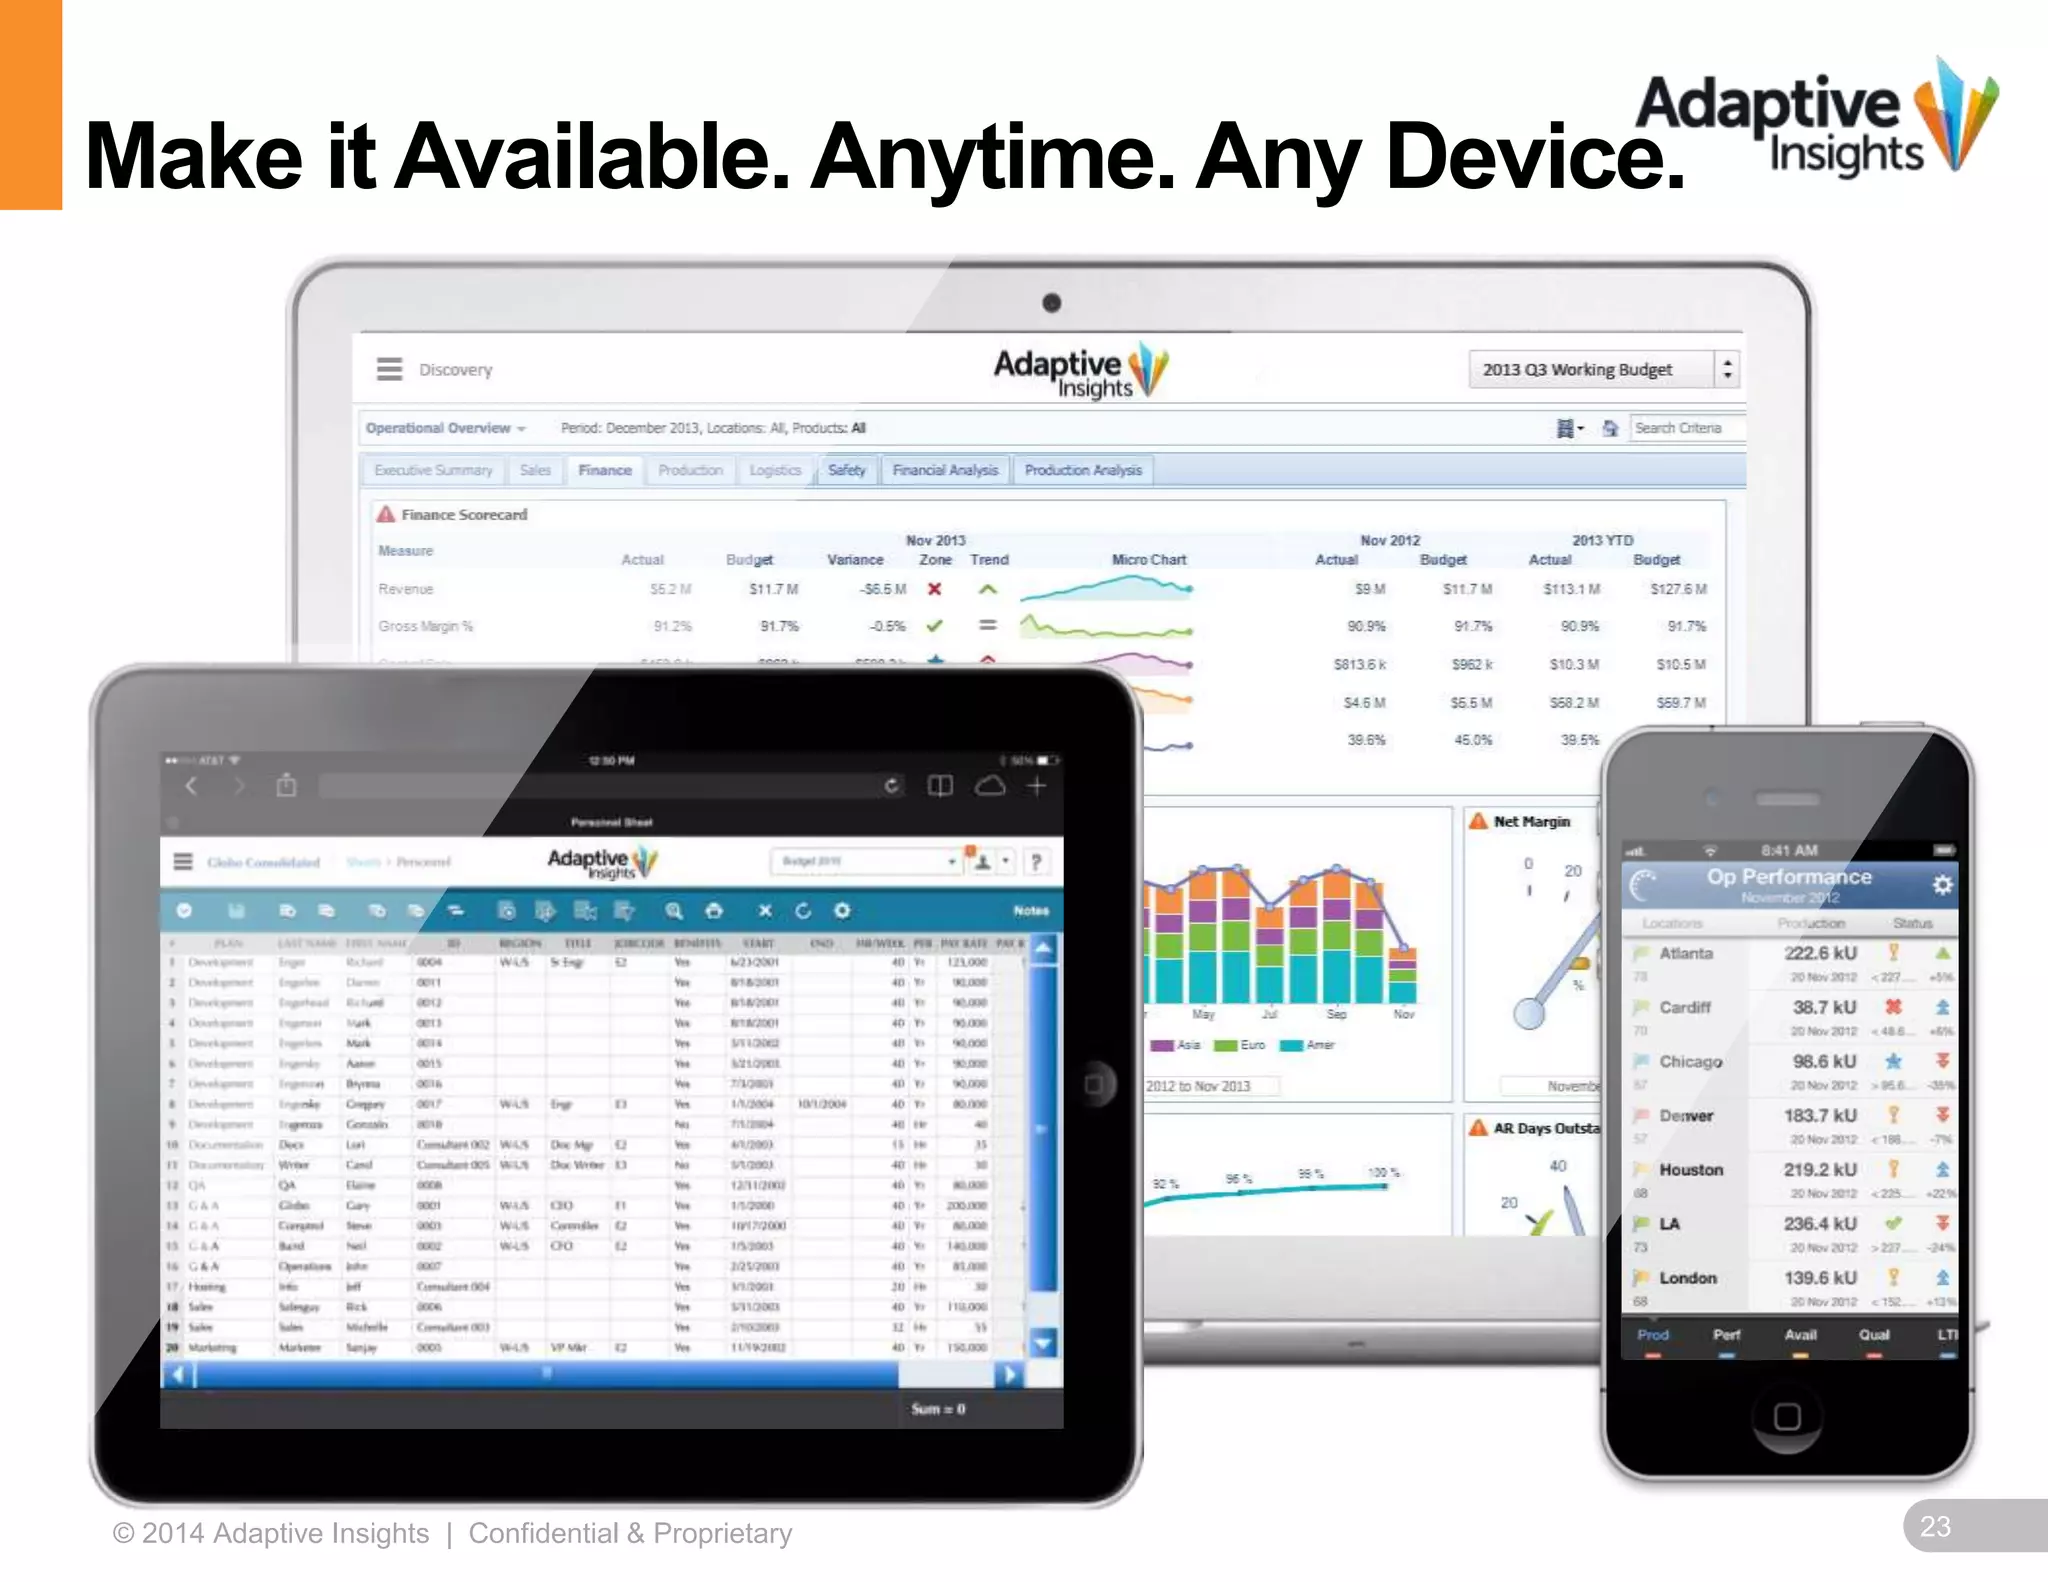
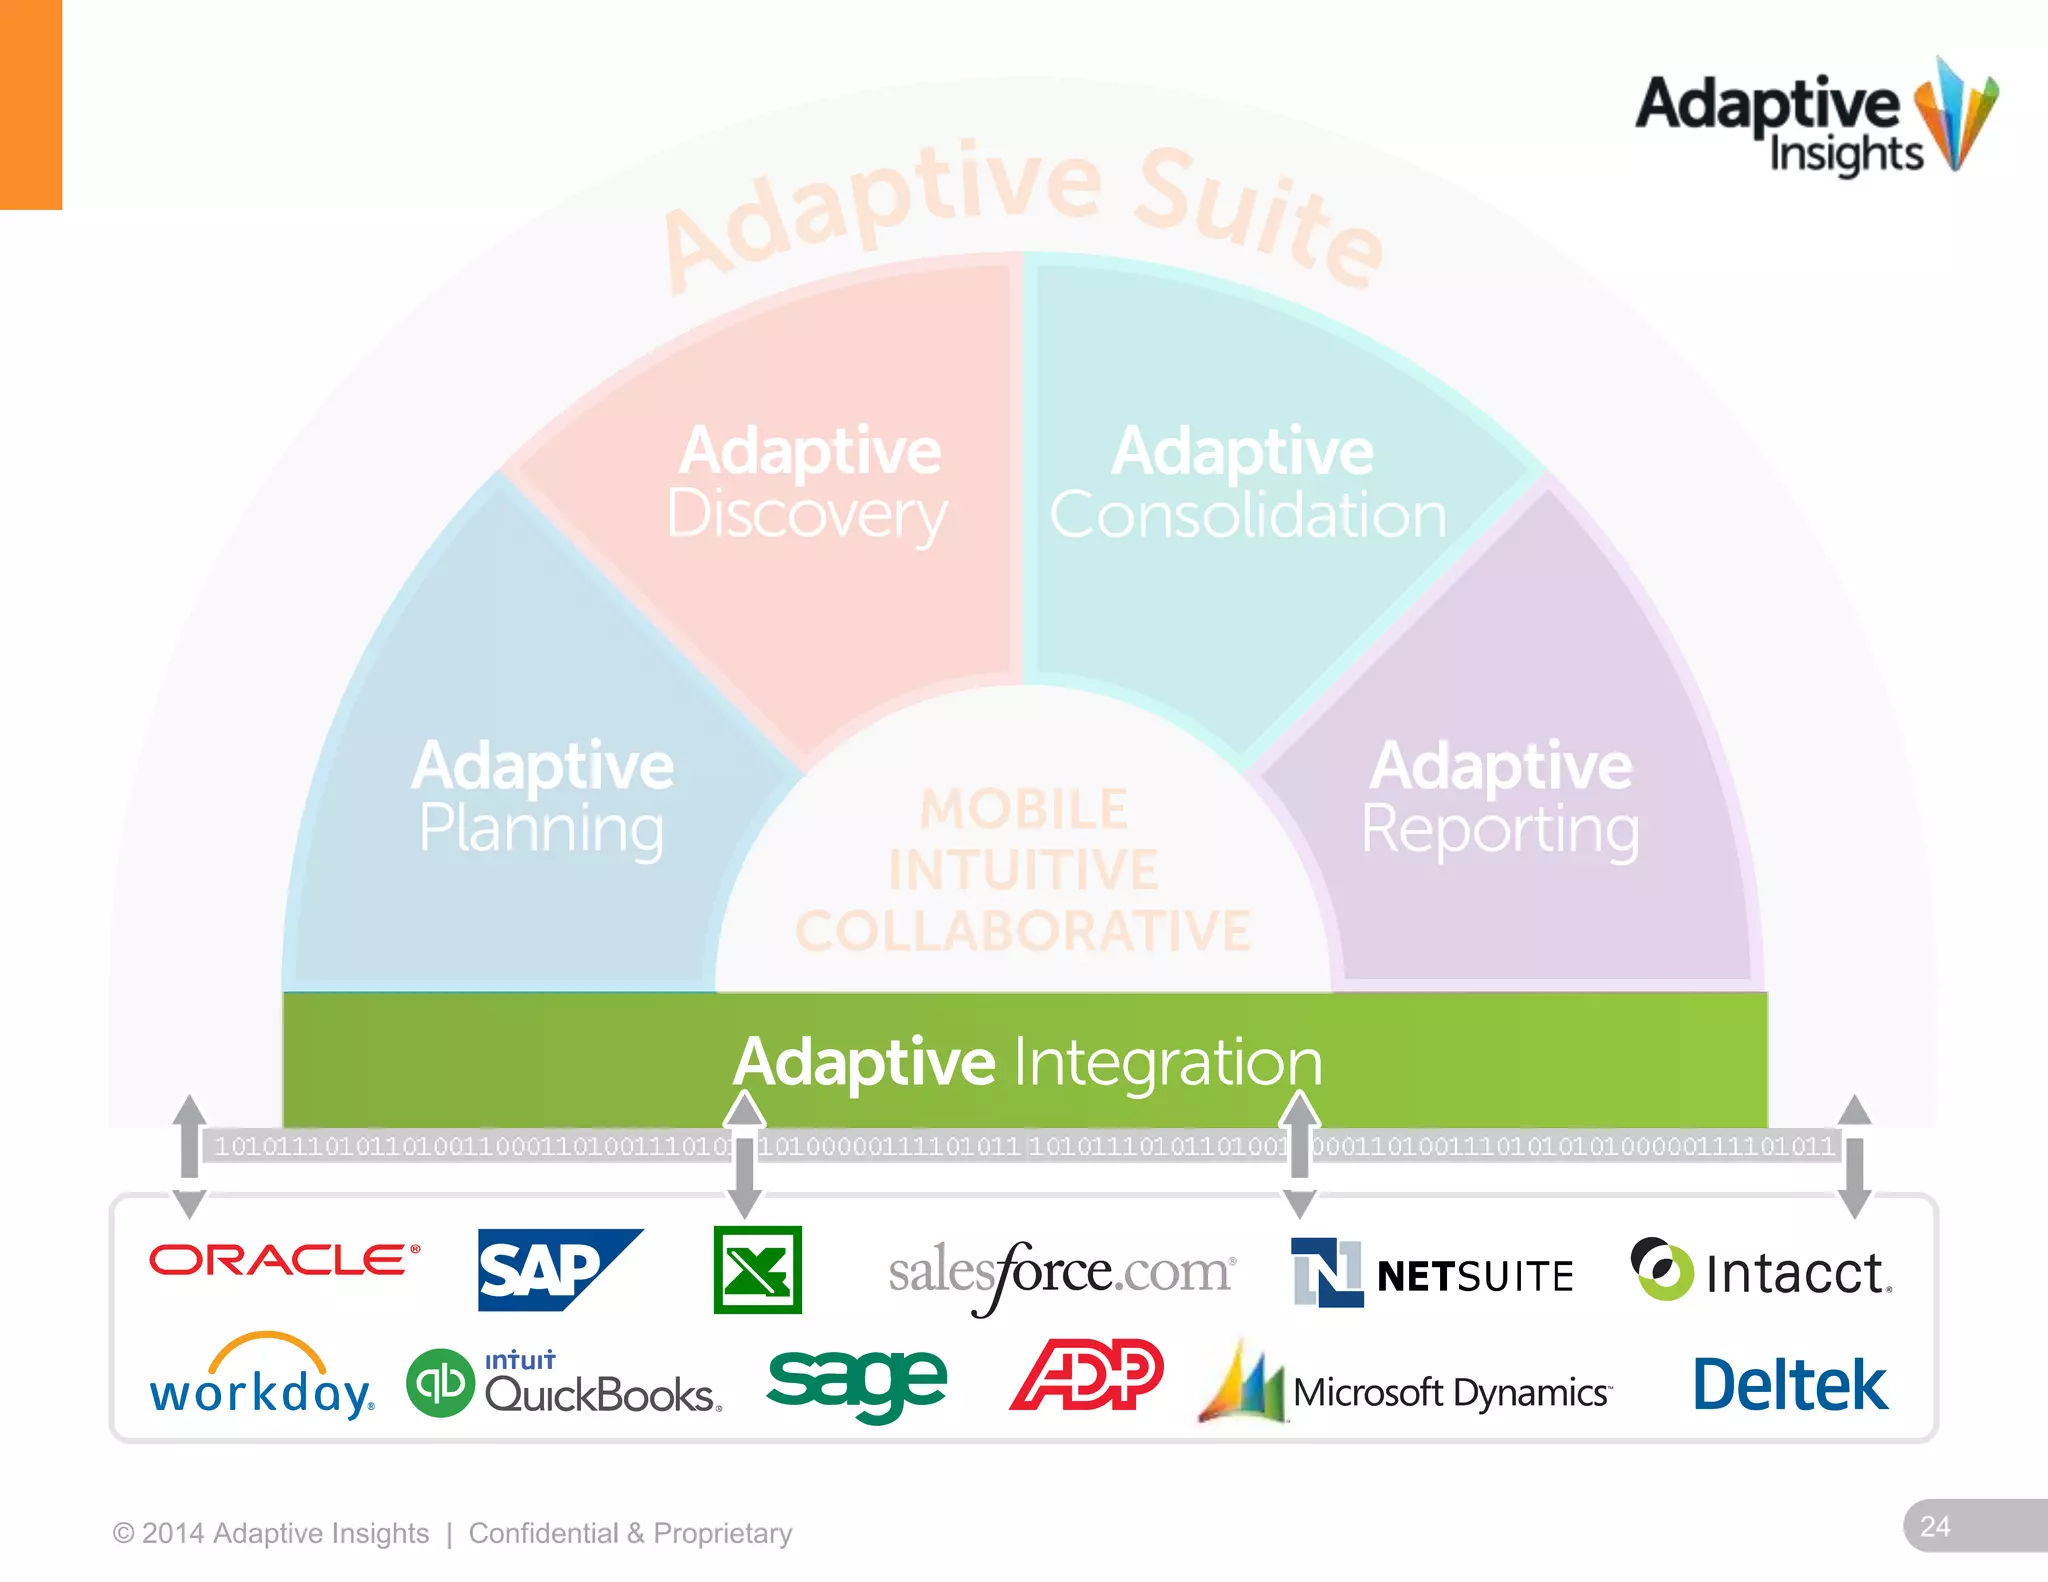
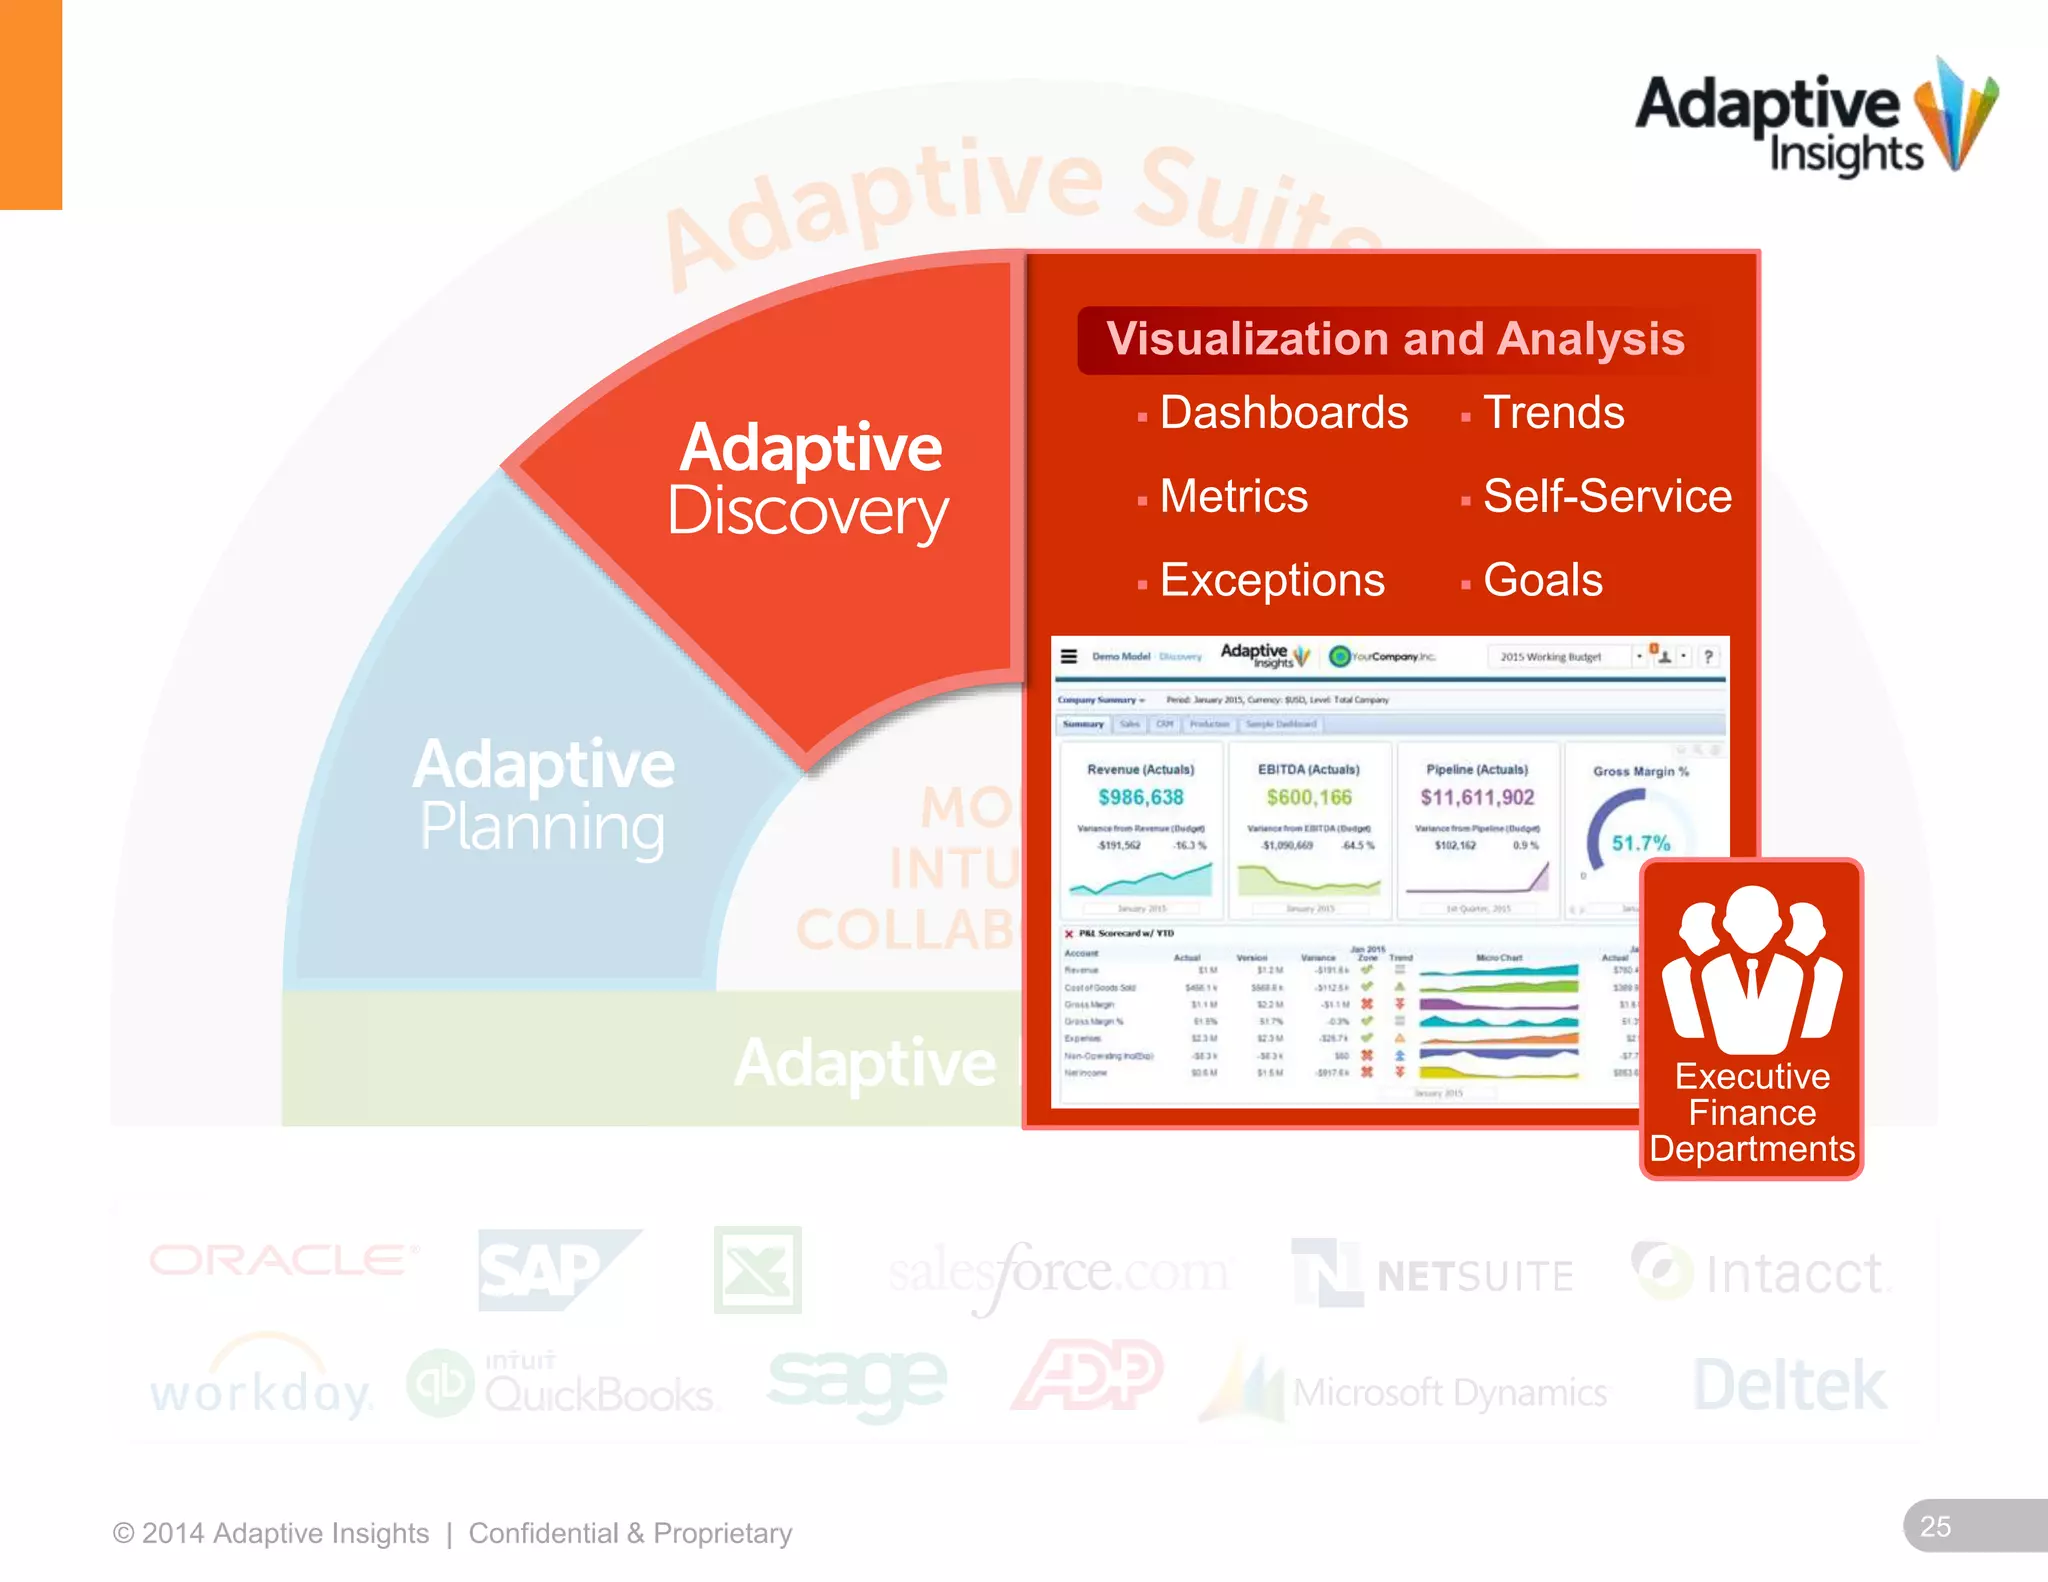
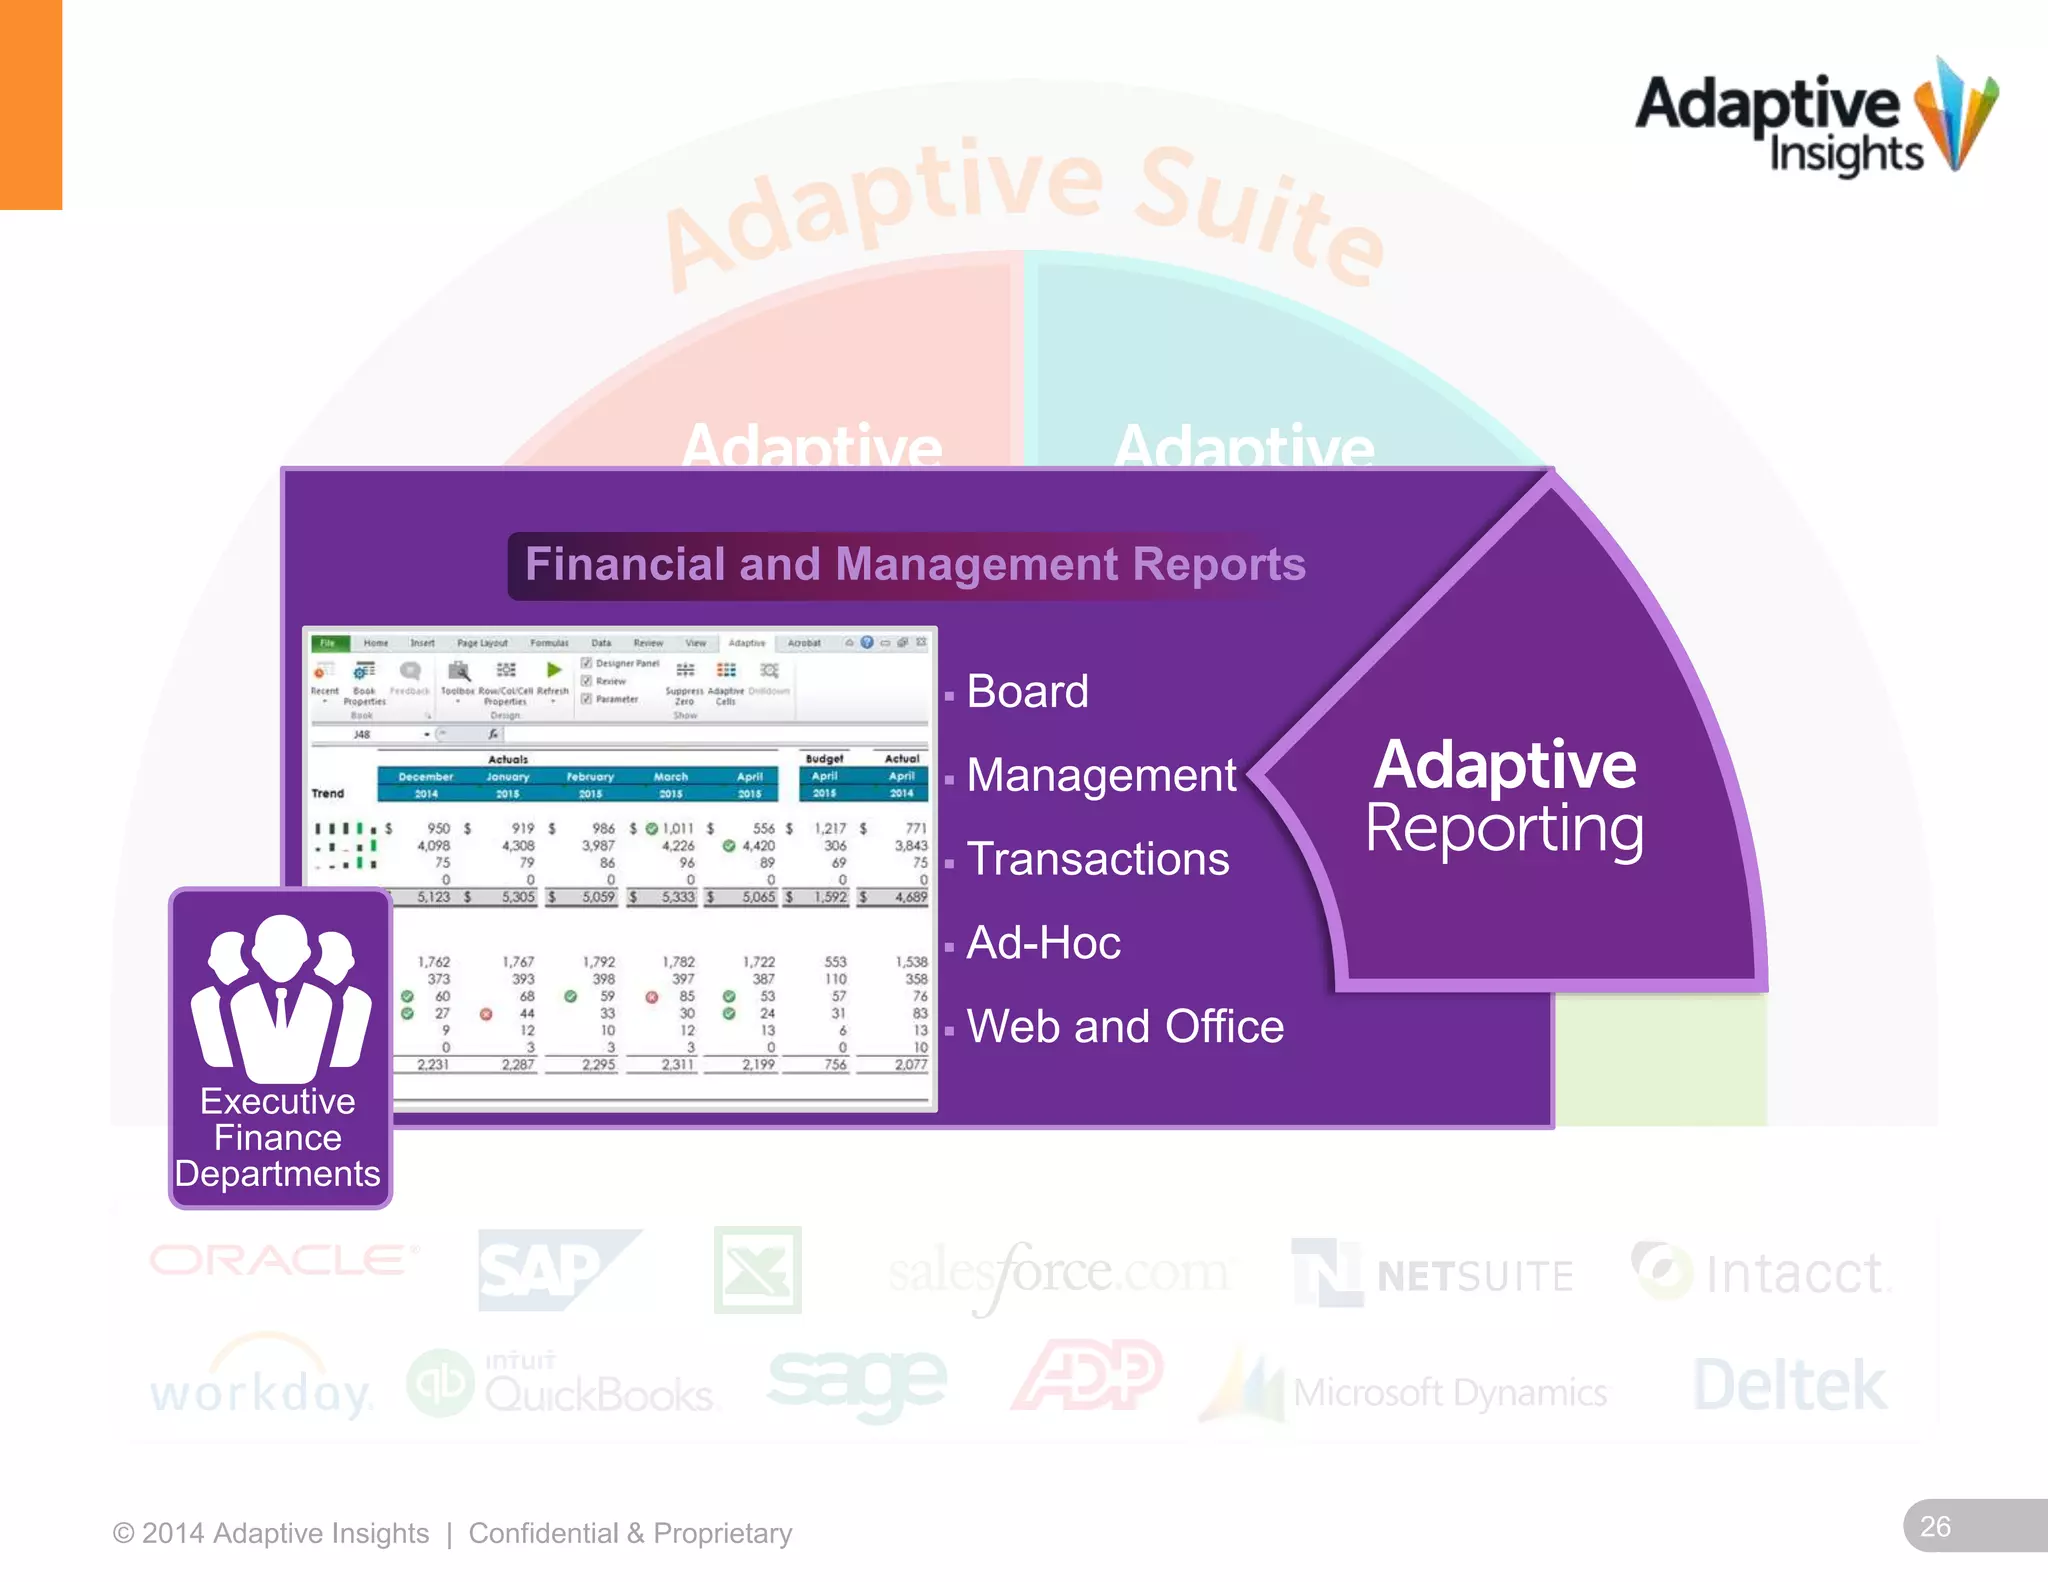
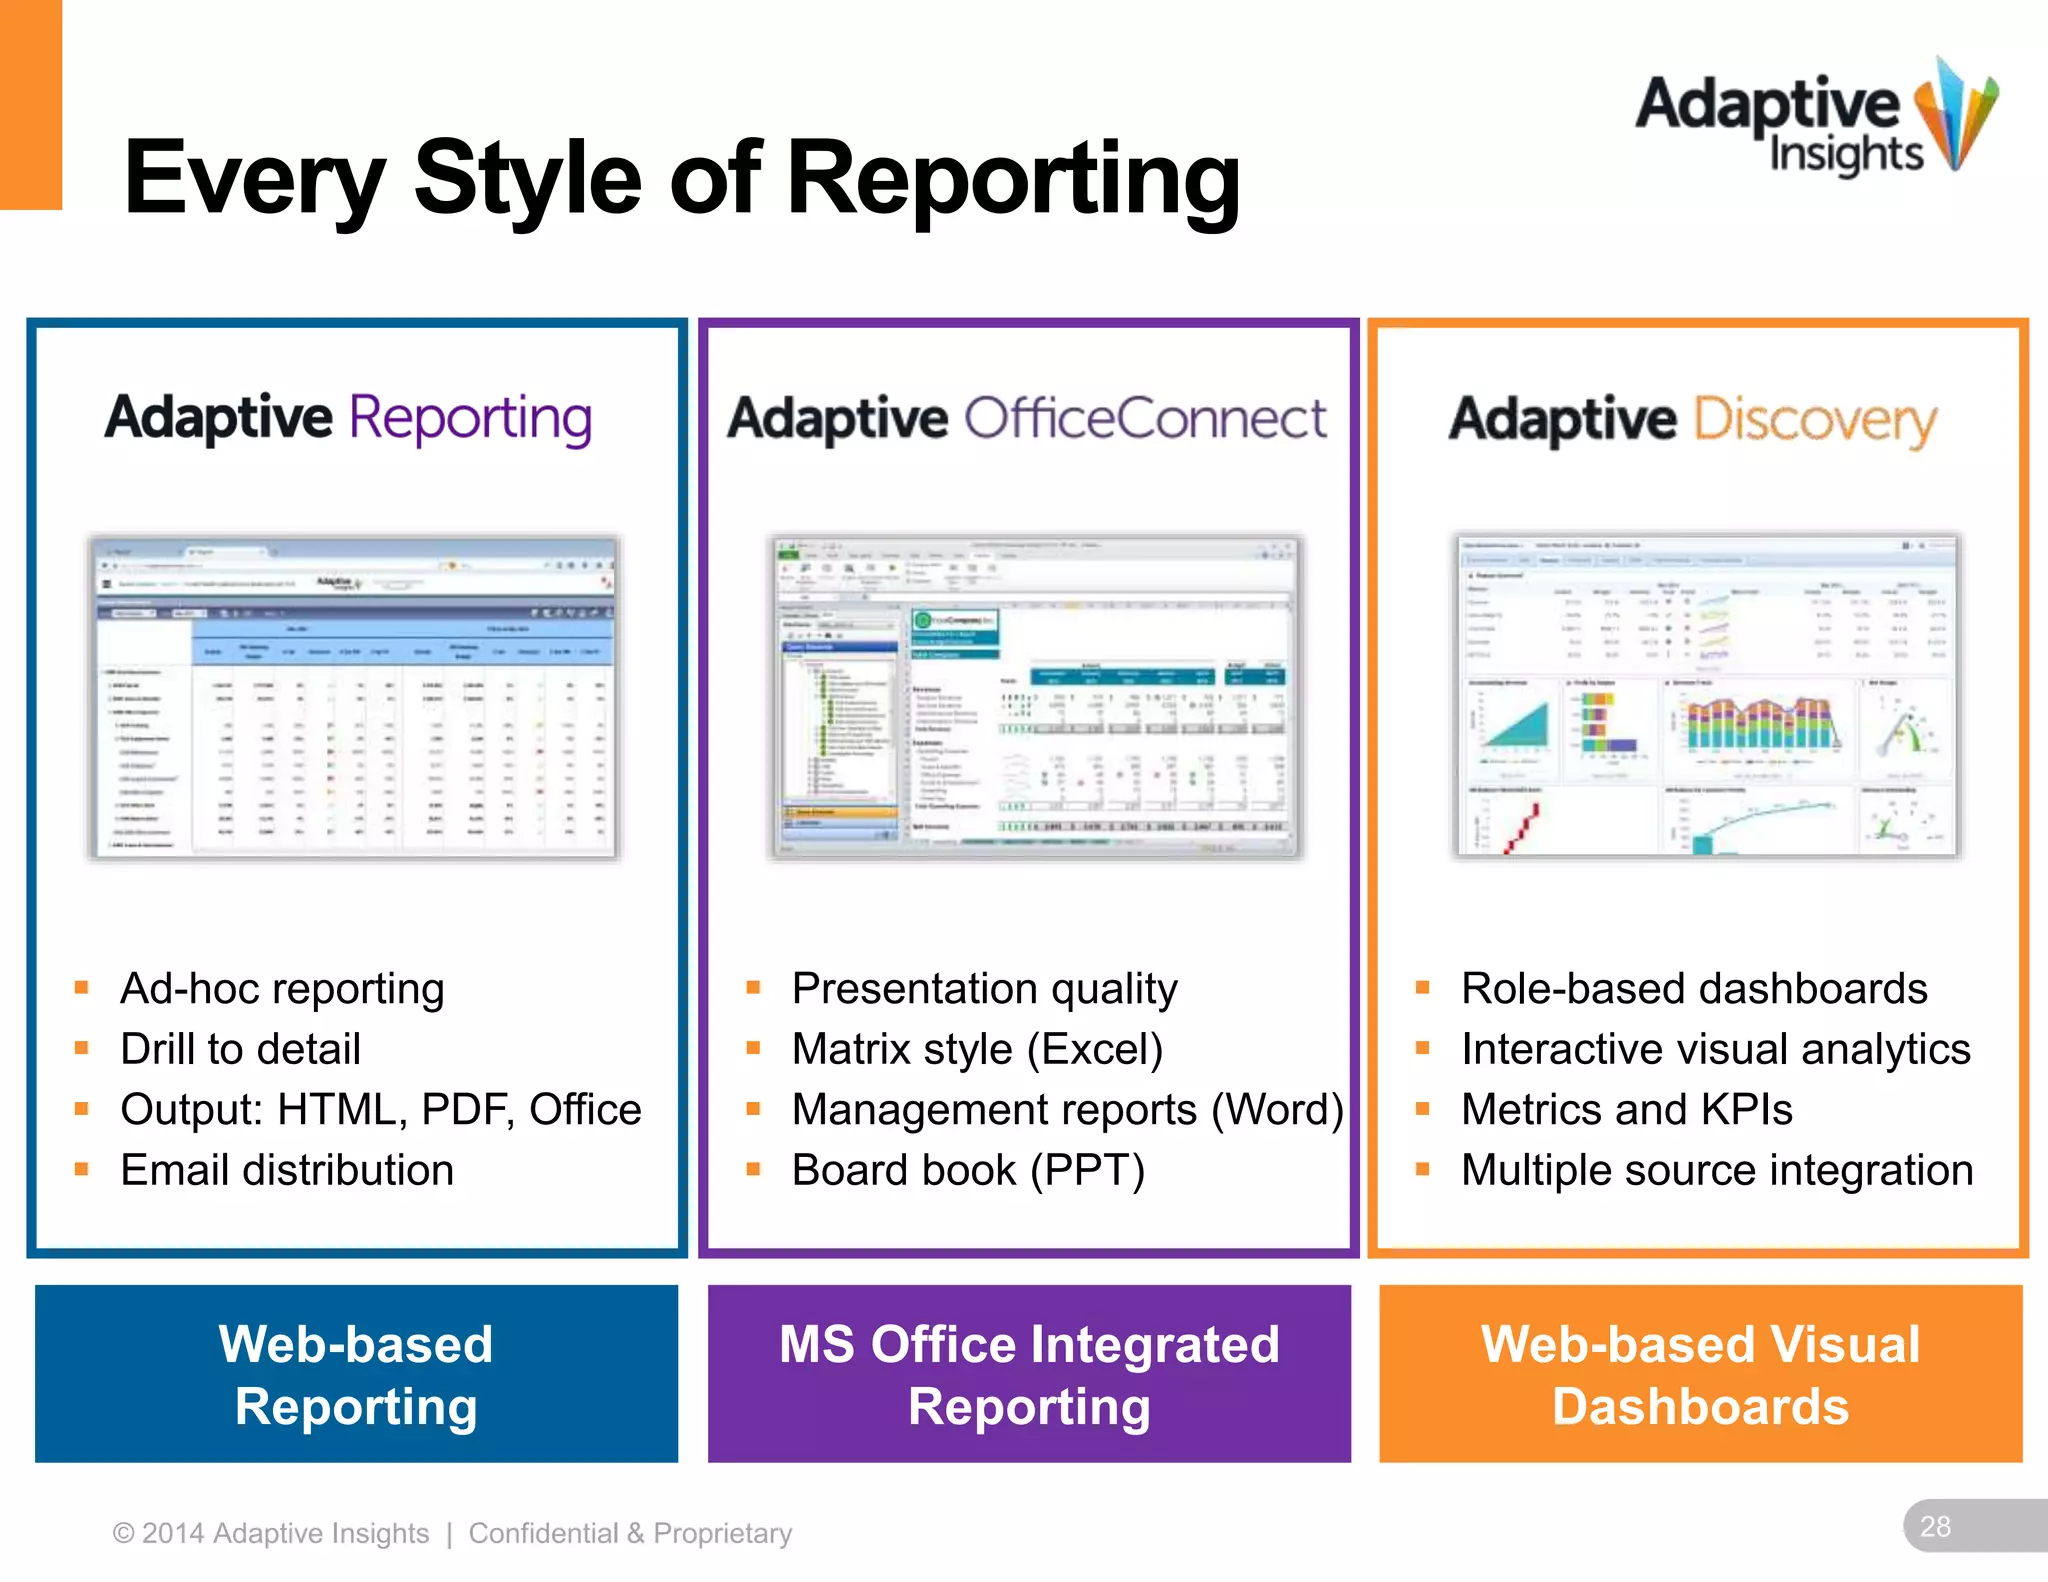
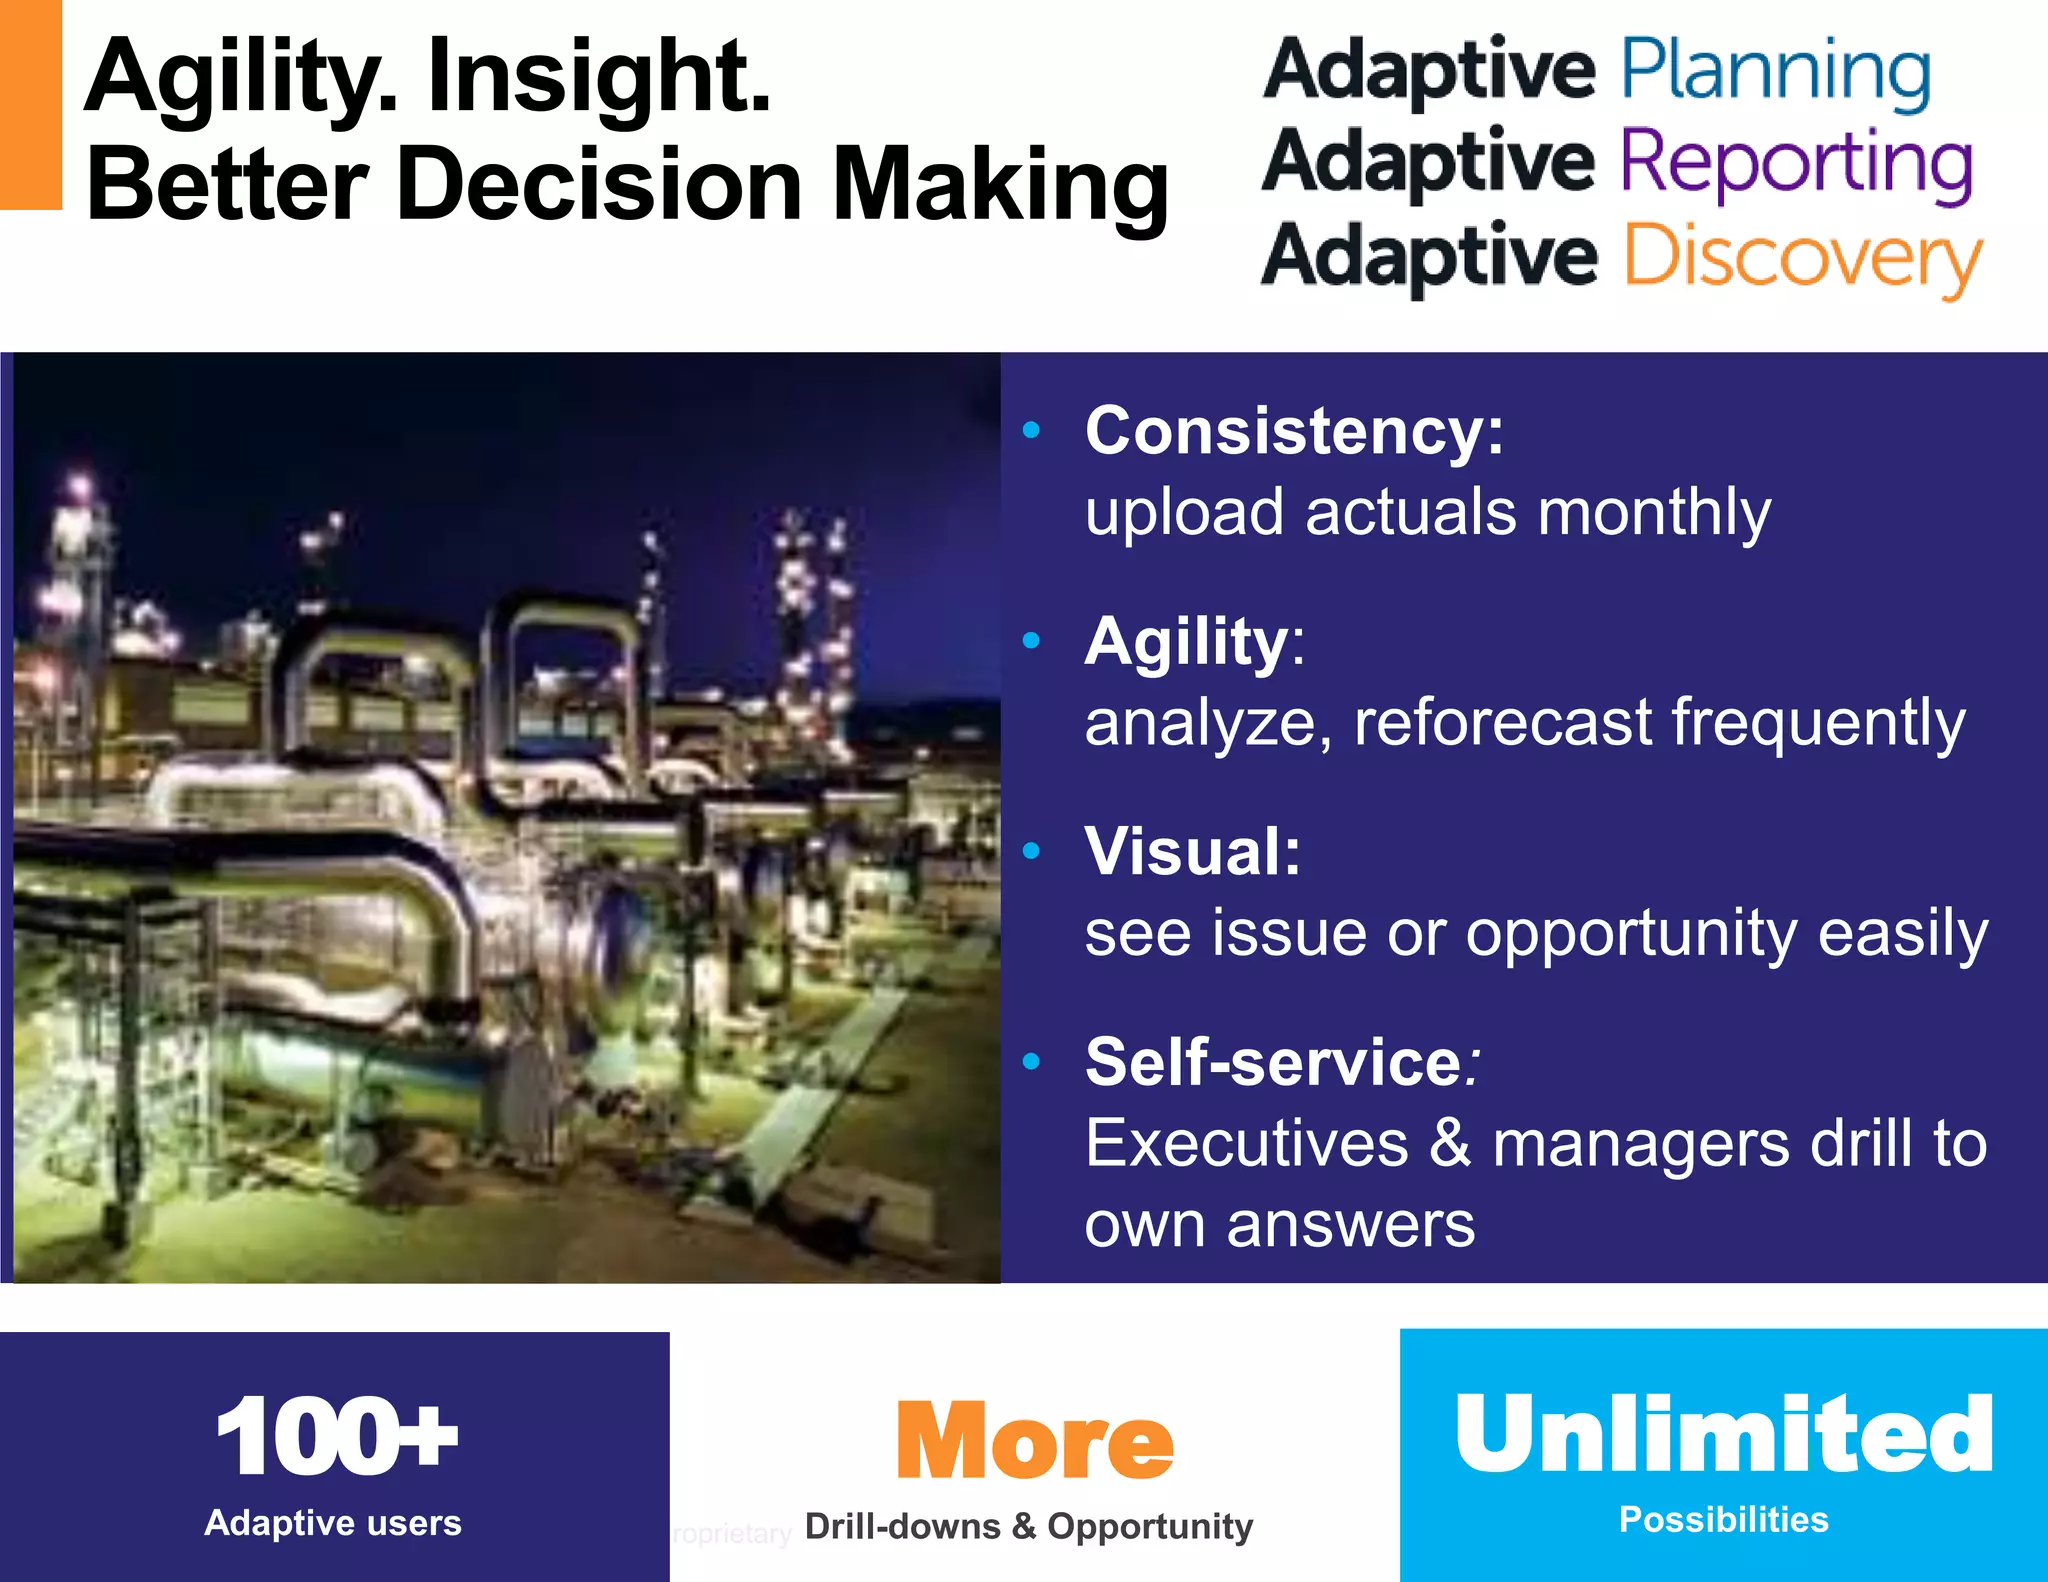
T H E G LO B A L L E A D E R I N C LO U D B I & C PM 
Elevate Your Reports & Dashboards to 
New Heights 
Paul Turner, Senior Director Strategy, Adaptive Insights 
© 2014 Adaptive Insights | Confidential & Proprietary 1
Why the Need to Elevate 
Reports & Dashboards 
© 2014 Adaptive Insights | Confidential & Proprietary 2
The Modern CFO 
Tactician to Strategist 
© 2014 Adaptive Insights | Confidential & Proprietary 3
#1 
Priority 
Leaders Want Better Analysis & Decision Making 
© 2014 Adaptive Insights | Confidential & Proprietary 4
Current State of Business Intelligence 
0% 10% 20% 30% 40% 50% 60% 70% 80% 90%100% 
Takes too long 
Labor-intensive 
Data integrity/accuracy/reliability issues 
Calculations are difficult to audit 
Limited communication/collaboration 
Functionality doesn't meet enough of my needs 
Difficult to make changes 
Limited ownership/accountability 
End result is often already out of date 
Not integrated with performance reporting system 
All other responses 
BPM Pulse Survey Results, December 2013 
© 2014 Adaptive Insights | Confidential & Proprietary 5
Data to Reports: Mind the Gap 
1. Gather data 
2. Rekey some data 
3. Generate report 
4. Export to Excel 
5. Rekey additional data 
6. Copy & Paste 
− into Word for Mgmt Books 
− into PPT for Board Book 
7. Print and bind 
− Word and PPT for Board Meeting 
8. Ooops… 
− journal entry missed 
− Restatement required 
− Need page inserted 
Industry ERP 
Data Reports 
9. Make correction 
10. n 
Repeat 3 – 7 
(at 11th hour) 
© 2014 Adaptive Insights | Confidential & Proprietary 6
Need for Enterprise-Wide Data 
There’s a growing recognition 
that it is vital to combine data 
from across the organization. 
35% 
2005 
Source: Forbes, March 7, 2014 
82% 
2014 
Source: 2014 CGMA Survey 
© 2014 Adaptive Insights | Confidential & Proprietary 7
Growing Report Requirements 
Accessibility 
Decision Maker 
Requirements 
Multiple 
Systems 
Regulatory 
Requirements 
ONLINE 
OFFLINE 
FORMATTED 
AD-HOC 
BOARDBOOK 
EXCEL 
ERPCRMHCMCPM 
CLOUDON-PREM 
IFRSFASBGAAP 
10K10Q 
XBRLSOX 
© 2014 Adaptive Insights | Confidential & Proprietary 8
3 Keys to Better Insights 
© 2014 Adaptive Insights | Confidential & Proprietary 9
1 
Make it Easy to Access Data 
© 2014 Adaptive Insights | Confidential & Proprietary 10
Your Business Data. Everywhere. 
Internal system 
Data warehouse 
Spreadmart 
CRM 
Sales Forecast 
Discounting 
ERP & GL 
Revenue & Receivables 
Revenue Recognition 
ROI on Spend 
Recurring revenue 
Renewals 
On-time completion 
Revenue Recognition 
Churn risk 
NPS 
ROI on Spend 
© 2014 Adaptive Insights | Confidential & Proprietary 11
# Systems Adds Data Complexity 
80% companies at least 2 – 3 systems 
25% have 4 – 5 systems 
Number Systems Generating Data for Reporting Process 
# systems ↑ as company grows (size & revenue) 
© 2014 Adaptive Insights | Confidential & Proprietary 12 
*> $50M Rev) 
*
Data Gathering Time Consuming 
60% of companies need to integrate six sources, 
20% need to integration even more 
© 2014 Adaptive Insights | Confidential & Proprietary 13
A Universal View 
 Report 
 Drill-down 
 Pivot 
 Visualize 
 Analyze 
 Model 
 Decide 
 Take Action 
One Place for Everything 
ACTUALS 
BUDGE T 
FORECAST 
Central 
Source 
of Insight 
REPORTING 
DASHBOARDS 
ANALYTICS 
© 2014 Adaptive Insights | Confidential & Proprietary 14
Automation. Do More With Less 
How available technology can help 
Report design → DRAG AND DROP REPORT DESIGN 
Data keying → REAL-TIME AND DYNAMIC DATA REFRESH 
Formatting → PRESERVE FORMATS, FORMULAS, LINKS 
Copy & paste → SIMPLE SYNCH BETWEEN REPORT TYPES 
Notes → EMBEDDED NOTES & NARRATIVE 
Automated Reporting Becomes 
Timely Accurate Detailed 
Efficient Easy Synchronized 
© 2014 Adaptive Insights | Confidential & Proprietary 15
2 
Make it Easy to Use 
© 2014 Adaptive Insights | Confidential & Proprietary 16
Empower Insight for Any Need 
Report 
 Financial Reporting 
 Operational Reporting 
 Actual v Budget Variance 
 Ad-hoc Reports or Analysis 
 GAAP/IFRS/XBRL 
Deliver Information for 
ANY 
… 
View Format 
 Executive Dashboard 
 Corporate Scorecards 
 Departmental Dashboards 
 Personalized Views 
 Snapshot Views 
 Individual Reports 
 Board books 
 Executive presentations 
 Online reports or dashboards 
© 2014 Adaptive Insights | Confidential & Proprietary 17
Automated. Self-Service Reporting 
Automated Reporting Should be Ease of Use 
 Intuitive design 
 Drag-and-drop 
 Slice and dice 
 Cell level detail 
 Real-time drill-down 
 Custom calculations 
Web-based agility 
© 2014 Adaptive Insights | Confidential & Proprietary 18
Intuitive Analysis. Self-Service Insight 
 Analysis across time 
 Dimensional Drill-down 
 “What-if” analysis 
 Drag and drop metrics 
 Personalized dashboards 
 On the fly visualizations 
© 2014 Adaptive Insights | Confidential & Proprietary 19
3 
Make it Easy to Consume 
© 2014 Adaptive Insights | Confidential & Proprietary 20
Make it Accessible 
81% 
of CFOs see the cloud 
as the future for their applications 
© 2014 Adaptive Insights | Confidential & Proprietary 21
Stakeholder Needs Vary 
Know Your Audience. Meet Their Needs 
Sales 
Finance 
© 2014 Adaptive Insights | Confidential & Proprietary Source: 2014 CGMA Survey 
22 
Human 
Resources 
Operations Accounting 
Executive 
Board of 
Directors
Make it Available. Anytime. Any Device. 
© 2014 Adaptive Insights | Confidential & Proprietary 23
Single Version of the Truth 
Connectors Data Detail Automated 
© 2014 Adaptive Insights | Confidential & Proprietary 24
Visualization and Analysis 
 Dashboards 
 Metrics 
 Exceptions 
 Self-Service 
Executive 
Finance 
Departments 
 Trends 
 Goals 
© 2014 Adaptive Insights | Confidential & Proprietary 25
Financial and Management Reports 
 Board 
 Management 
 Transactions 
 Ad-Hoc 
Web and Office 
Executive 
Finance 
Departments 
© 2014 Adaptive Insights | Confidential & Proprietary 26
© 2014 Adaptive Insights | Confidential & Proprietary 27
Every Style of Reporting 
 Presentation quality 
 Matrix style (Excel) 
 Management reports (Word) 
 Board book (PPT) 
 Ad-hoc reporting 
 Drill to detail 
 Output: HTML, PDF, Office 
 Email distribution 
Web-based 
Reporting 
MS Office Integrated 
Reporting 
 Role-based dashboards 
 Interactive visual analytics 
 Metrics and KPIs 
 Multiple source integration 
Web-based Visual 
Dashboards 
© 2014 Adaptive Insights | Confidential & Proprietary 28
Demonstration 
© 2014 Adaptive Insights | Confidential & Proprietary 29
© 2014 Adaptive Insights | Confidential & Proprietary 30
OIL & GAS 
Calgary, Canada 
$2B 
Revenue 
11K+ 
Employees 
10 
Dimensions per level 
5 – 10 
Different Business Lines 
© 2014 Adaptive Insights | Confidential & Proprietary 31
Agility. Insight. 
Better Decision Making 
• Consistency: 
upload actuals monthly 
• Agility: 
analyze, reforecast frequently 
• Visual: 
see issue or opportunity easily 
• Self-service: 
Executives & managers drill to 
own answers 
Unlimited 
Possibilities 
More 
Drill-downs & Opportunity 
OIL & GAS 
100+ 
Adaptive users 
© 2014 Adaptive Insights | Confidential & Proprietary 32
Q&A 
© 2014 Adaptive Insights | Confidential & Proprietary 33
Talk to us anytime! 
Paul Turner 
Senior Director 
pturner@adaptiveinsights.com 
John Sindel 
Solution Specialist 
jsindel@adaptiveinsights.com 
Take the next step! 
 Visit Adaptive Insights Web Site: 
– Complete Demo: 
http://www.adaptiveinsights.com/demo_recorded.php 
– Free Trial: 
http://www.adaptiveinsights.com/enterprise_trial/ 
 Custom Demo: Find out if Adaptive can help 
your organization 
 Don’t forget to download your copy of the 
Harvard Business Review paper, 
“Communication By The Numbers” 
 For CPE credit, complete the survey at the 
end of the webinar 
 Attend the Adaptive “Finance Best Practice” 
Forum 
© 2014 Adaptive Insights | Confidential & Proprietary 34
Thank You for Being Adaptive! 
© 2014 Adaptive Insights | Confidential & Proprietary 35

Elevate Your Reports Dashboards to New Heights

  • 1.
    T H EG LO B A L L E A D E R I N C LO U D B I & C PM Elevate Your Reports & Dashboards to New Heights Paul Turner, Senior Director Strategy, Adaptive Insights © 2014 Adaptive Insights | Confidential & Proprietary 1
  • 2.
    Why the Needto Elevate Reports & Dashboards © 2014 Adaptive Insights | Confidential & Proprietary 2
  • 3.
    The Modern CFO Tactician to Strategist © 2014 Adaptive Insights | Confidential & Proprietary 3
  • 4.
    #1 Priority LeadersWant Better Analysis & Decision Making © 2014 Adaptive Insights | Confidential & Proprietary 4
  • 5.
    Current State ofBusiness Intelligence 0% 10% 20% 30% 40% 50% 60% 70% 80% 90%100% Takes too long Labor-intensive Data integrity/accuracy/reliability issues Calculations are difficult to audit Limited communication/collaboration Functionality doesn't meet enough of my needs Difficult to make changes Limited ownership/accountability End result is often already out of date Not integrated with performance reporting system All other responses BPM Pulse Survey Results, December 2013 © 2014 Adaptive Insights | Confidential & Proprietary 5
  • 6.
    Data to Reports:Mind the Gap 1. Gather data 2. Rekey some data 3. Generate report 4. Export to Excel 5. Rekey additional data 6. Copy & Paste − into Word for Mgmt Books − into PPT for Board Book 7. Print and bind − Word and PPT for Board Meeting 8. Ooops… − journal entry missed − Restatement required − Need page inserted Industry ERP Data Reports 9. Make correction 10. n Repeat 3 – 7 (at 11th hour) © 2014 Adaptive Insights | Confidential & Proprietary 6
  • 7.
    Need for Enterprise-WideData There’s a growing recognition that it is vital to combine data from across the organization. 35% 2005 Source: Forbes, March 7, 2014 82% 2014 Source: 2014 CGMA Survey © 2014 Adaptive Insights | Confidential & Proprietary 7
  • 8.
    Growing Report Requirements Accessibility Decision Maker Requirements Multiple Systems Regulatory Requirements ONLINE OFFLINE FORMATTED AD-HOC BOARDBOOK EXCEL ERPCRMHCMCPM CLOUDON-PREM IFRSFASBGAAP 10K10Q XBRLSOX © 2014 Adaptive Insights | Confidential & Proprietary 8
  • 9.
    3 Keys toBetter Insights © 2014 Adaptive Insights | Confidential & Proprietary 9
  • 10.
    1 Make itEasy to Access Data © 2014 Adaptive Insights | Confidential & Proprietary 10
  • 11.
    Your Business Data.Everywhere. Internal system Data warehouse Spreadmart CRM Sales Forecast Discounting ERP & GL Revenue & Receivables Revenue Recognition ROI on Spend Recurring revenue Renewals On-time completion Revenue Recognition Churn risk NPS ROI on Spend © 2014 Adaptive Insights | Confidential & Proprietary 11
  • 12.
    # Systems AddsData Complexity 80% companies at least 2 – 3 systems 25% have 4 – 5 systems Number Systems Generating Data for Reporting Process # systems ↑ as company grows (size & revenue) © 2014 Adaptive Insights | Confidential & Proprietary 12 *> $50M Rev) *
  • 13.
    Data Gathering TimeConsuming 60% of companies need to integrate six sources, 20% need to integration even more © 2014 Adaptive Insights | Confidential & Proprietary 13
  • 14.
    A Universal View  Report  Drill-down  Pivot  Visualize  Analyze  Model  Decide  Take Action One Place for Everything ACTUALS BUDGE T FORECAST Central Source of Insight REPORTING DASHBOARDS ANALYTICS © 2014 Adaptive Insights | Confidential & Proprietary 14
  • 15.
    Automation. Do MoreWith Less How available technology can help Report design → DRAG AND DROP REPORT DESIGN Data keying → REAL-TIME AND DYNAMIC DATA REFRESH Formatting → PRESERVE FORMATS, FORMULAS, LINKS Copy & paste → SIMPLE SYNCH BETWEEN REPORT TYPES Notes → EMBEDDED NOTES & NARRATIVE Automated Reporting Becomes Timely Accurate Detailed Efficient Easy Synchronized © 2014 Adaptive Insights | Confidential & Proprietary 15
  • 16.
    2 Make itEasy to Use © 2014 Adaptive Insights | Confidential & Proprietary 16
  • 17.
    Empower Insight forAny Need Report  Financial Reporting  Operational Reporting  Actual v Budget Variance  Ad-hoc Reports or Analysis  GAAP/IFRS/XBRL Deliver Information for ANY … View Format  Executive Dashboard  Corporate Scorecards  Departmental Dashboards  Personalized Views  Snapshot Views  Individual Reports  Board books  Executive presentations  Online reports or dashboards © 2014 Adaptive Insights | Confidential & Proprietary 17
  • 18.
    Automated. Self-Service Reporting Automated Reporting Should be Ease of Use  Intuitive design  Drag-and-drop  Slice and dice  Cell level detail  Real-time drill-down  Custom calculations Web-based agility © 2014 Adaptive Insights | Confidential & Proprietary 18
  • 19.
    Intuitive Analysis. Self-ServiceInsight  Analysis across time  Dimensional Drill-down  “What-if” analysis  Drag and drop metrics  Personalized dashboards  On the fly visualizations © 2014 Adaptive Insights | Confidential & Proprietary 19
  • 20.
    3 Make itEasy to Consume © 2014 Adaptive Insights | Confidential & Proprietary 20
  • 21.
    Make it Accessible 81% of CFOs see the cloud as the future for their applications © 2014 Adaptive Insights | Confidential & Proprietary 21
  • 22.
    Stakeholder Needs Vary Know Your Audience. Meet Their Needs Sales Finance © 2014 Adaptive Insights | Confidential & Proprietary Source: 2014 CGMA Survey 22 Human Resources Operations Accounting Executive Board of Directors
  • 23.
    Make it Available.Anytime. Any Device. © 2014 Adaptive Insights | Confidential & Proprietary 23
  • 24.
    Single Version ofthe Truth Connectors Data Detail Automated © 2014 Adaptive Insights | Confidential & Proprietary 24
  • 25.
    Visualization and Analysis  Dashboards  Metrics  Exceptions  Self-Service Executive Finance Departments  Trends  Goals © 2014 Adaptive Insights | Confidential & Proprietary 25
  • 26.
    Financial and ManagementReports  Board  Management  Transactions  Ad-Hoc Web and Office Executive Finance Departments © 2014 Adaptive Insights | Confidential & Proprietary 26
  • 27.
    © 2014 AdaptiveInsights | Confidential & Proprietary 27
  • 28.
    Every Style ofReporting  Presentation quality  Matrix style (Excel)  Management reports (Word)  Board book (PPT)  Ad-hoc reporting  Drill to detail  Output: HTML, PDF, Office  Email distribution Web-based Reporting MS Office Integrated Reporting  Role-based dashboards  Interactive visual analytics  Metrics and KPIs  Multiple source integration Web-based Visual Dashboards © 2014 Adaptive Insights | Confidential & Proprietary 28
  • 29.
    Demonstration © 2014Adaptive Insights | Confidential & Proprietary 29
  • 30.
    © 2014 AdaptiveInsights | Confidential & Proprietary 30
  • 31.
    OIL & GAS Calgary, Canada $2B Revenue 11K+ Employees 10 Dimensions per level 5 – 10 Different Business Lines © 2014 Adaptive Insights | Confidential & Proprietary 31
  • 32.
    Agility. Insight. BetterDecision Making • Consistency: upload actuals monthly • Agility: analyze, reforecast frequently • Visual: see issue or opportunity easily • Self-service: Executives & managers drill to own answers Unlimited Possibilities More Drill-downs & Opportunity OIL & GAS 100+ Adaptive users © 2014 Adaptive Insights | Confidential & Proprietary 32
  • 33.
    Q&A © 2014Adaptive Insights | Confidential & Proprietary 33
  • 34.
    Talk to usanytime! Paul Turner Senior Director pturner@adaptiveinsights.com John Sindel Solution Specialist jsindel@adaptiveinsights.com Take the next step!  Visit Adaptive Insights Web Site: – Complete Demo: http://www.adaptiveinsights.com/demo_recorded.php – Free Trial: http://www.adaptiveinsights.com/enterprise_trial/  Custom Demo: Find out if Adaptive can help your organization  Don’t forget to download your copy of the Harvard Business Review paper, “Communication By The Numbers”  For CPE credit, complete the survey at the end of the webinar  Attend the Adaptive “Finance Best Practice” Forum © 2014 Adaptive Insights | Confidential & Proprietary 34
  • 35.
    Thank You forBeing Adaptive! © 2014 Adaptive Insights | Confidential & Proprietary 35

Editor's Notes

  • #11 http://www.epmchannel.com/wp-content/uploads/2012/12/K03956-Fortifying-the-Close-to-Disclose-Process-20121015.pdf Fortifying the Close to Disclose Process - Mary Driscoll , Senior Research Fellow , APQC Strengthen alignment between the data used for regulatory reporting and the data used for planning and resource allocation by internal P&L owners. The point is to improve the quality of information used by internal decision makers. A best practice in this regard is to embrace what’s called driver-based planning—and that requires that financial data and operational metrics are aligned in the context of performance reporting. Information quality, broken down in this sense, has equal parts of accuracy, freshness, consistency, and accessibility. APQC research indicates that more senior executives working today at large, complex organizations are asking for financial data governance models that ensure performance is accurately measured and tracked consistently across the enterprise. Such an ideal would tend to rule out a heavy reliance on manual data entry and (unmanaged) spreadsheets during the close-to-disclose process.
  • #13 http://www.epmchannel.com/wp-content/uploads/2012/12/K03956-Fortifying-the-Close-to-Disclose-Process-20121015.pdf Fortifying the Close to Disclose Process - Mary Driscoll , Senior Research Fellow , APQC For many, a big source of this problem has to do with the ungainly need to (a) take transaction data that had previously been pulled into the the general ledger by automated systems and (b) pour that data into manual processes for the final steps of close-to-disclose. What’s more, many large companies are burdened by the number of entities that have to be consolidated and the number of secondary systems that have to be tapped (e.g., treasury, tax, fixed assets, and non-FM databases such as those used in sales and marketing). An interesting perspective on this (Figures 2 and Figure 3) comes from Leinani Malig, president of Kauleo Consulting, and Trevor Gillespie, audit partner at Mohler, Nixon & Williams.
  • #15 Nirvana - Errors creep in when you have multiple versions of the truth. With so many people changing calculations, and so many different versions, it’s no wonder errors are common. Move all of your hierarches, calculations, data, and security to one place for everyone. It means if there’s an error, there’s only one place to change it. Then give your business users the power to explore the data – drill down, pivot and analyze results, annotate and share insights. Everyone has the same view, and everyone is checking the same data for quality. Goodbye, errors.
  • #16 Eliminate the negative ~ Accentuate the Positive Page 6 – ¾ respondents thought useful if could connecct spreadsheets to their source data systems. Extracting Value from Automation: KPMG Extracting value from automation As most CFOs will attest, one of their greatest challenges is the constant need to balance multiple priorities with limited resources. Recently, CFO attention has moved away from the heavy focus on cost control and frugality, towards supporting the business and enabling strategically-driven growth. This was seen in the 2010 IBM Global CFO Study , in which over 1,900 CFOs and senior finance leaders worldwide ranked ‘providing inputs into enterprise strategy’ as the most important aspect of their role in the near term. The ability to provide inputs into strategy depends on the finance function’s capacity to produce financial and performance data for management, boards and external stakeholders in a timely manner. To support decision- making, it is essential that this information gets to the right users at the right time. The challenge is to improve these activities in the current cost-constrained environment Automated Process & Technology Should… copying pasting Without repaginating when a new page needs inserting into report or budget books…
  • #17 http://www.epmchannel.com/wp-content/uploads/2012/12/K03956-Fortifying-the-Close-to-Disclose-Process-20121015.pdf Fortifying the Close to Disclose Process - Mary Driscoll , Senior Research Fellow , APQC Strengthen alignment between the data used for regulatory reporting and the data used for planning and resource allocation by internal P&L owners. The point is to improve the quality of information used by internal decision makers. A best practice in this regard is to embrace what’s called driver-based planning—and that requires that financial data and operational metrics are aligned in the context of performance reporting. Information quality, broken down in this sense, has equal parts of accuracy, freshness, consistency, and accessibility. APQC research indicates that more senior executives working today at large, complex organizations are asking for financial data governance models that ensure performance is accurately measured and tracked consistently across the enterprise. Such an ideal would tend to rule out a heavy reliance on manual data entry and (unmanaged) spreadsheets during the close-to-disclose process.
  • #20 A key here is that for dashboards and analysis to be effective it shouldn’t be reliant on IT. It should be in the hands of the business, so with Adaptive Discovery analytics is self-service. Everything from picking time periods – to drilling down – it’s all business user friendly. Most importantly – this helps with adoption, making it easy for everyone to get started and get their own questions answered.
  • #21 http://www.epmchannel.com/wp-content/uploads/2012/12/K03956-Fortifying-the-Close-to-Disclose-Process-20121015.pdf Fortifying the Close to Disclose Process - Mary Driscoll , Senior Research Fellow , APQC Strengthen alignment between the data used for regulatory reporting and the data used for planning and resource allocation by internal P&L owners. The point is to improve the quality of information used by internal decision makers. A best practice in this regard is to embrace what’s called driver-based planning—and that requires that financial data and operational metrics are aligned in the context of performance reporting. Information quality, broken down in this sense, has equal parts of accuracy, freshness, consistency, and accessibility. APQC research indicates that more senior executives working today at large, complex organizations are asking for financial data governance models that ensure performance is accurately measured and tracked consistently across the enterprise. Such an ideal would tend to rule out a heavy reliance on manual data entry and (unmanaged) spreadsheets during the close-to-disclose process.
  • #23 What’s the company model that will give the strategic, cross-enterprise view that the new finance org needs? Esp in a world where less than half CFOs think they are effective at performance management and 77% think they have a substantial role in gaining insight from data. That model has finance in the center, gathering and synthesizing data from across the org, with tools for perf mgmt and extracting insight from data.
  • #24 Anoher aspect of delivering analytics easily, is accessibility. You want people to be able to access the inforematino and analytis they need, with any devide. Once again, Cloud offers benefits here as well because with the cloud the information can be accessed from anywhere, same way access Amazon or Google , can access dashboards KPISa from tablet, phone, desktop Delivering analytics easily is a vital part of meeting the final ACID test. The cloud is helping strategic finance leaders do just that. Our customers value the anytime anywhere delivery that the cloud delivers, from our 100% modern, web based solution – from end users, to development, to administration. Adaptive makes performance management from anywhere easy.
  • #25 Adaptive Suite AI & AD together Paul’s slide on what AI brings (analyst decision maker) We provide the only unified BI & CPM suite built from the “cloud up” – planning, reporting, consolidation and analytics solutions that are innovative, powerful and intuitive for all types of business users. We ensure customer success with the industry’s best service, support, and partner ecosystem.   The Adaptive Suite is the most complete cloud CPM and BI suite, including unified planning, reporting, consolidation and analytics solutions that are modern, powerful and intuitive for all types of business users. The Adaptive Suite is modern at the core, with built-in analytics, web and mobile access, and native collaboration capabilities. Adaptive Planning: Adaptive Planning provides comprehensive budgeting, planning, and forecasting that’s proven to reduce cycle times by up to 90%. With an incredibly intuitive “Excel-like” interface, it’s easy to collaboratively plan and forecast revenue, expenses and headcount, create rolling forecasts, and more. Adaptive Consolidation: Cut time and resources spent closing and reporting with Adaptive Consolidation. With a real-time consolidation engine at the core, it includes journal entry management, intercompany eliminations, account reclassifications, and even collaborative close process management – all as an easy to deploy cloud service. Adaptive Discovery: It’s simple to visually uncover insights into financial, sales, and operational performance with Adaptive Discovery. Intuitive dashboards, interactive scorecards, and even what-if modeling make it easy for every business user to analyze results and trends. Adaptive Reporting: Adaptive Reporting provides comprehensive financial, management, board and transactional reporting, all available through an easy to use web native drag-and-drop report builder. It’s completely self-service reporting for everyone. Adaptive Integration: With a powerful integration platform that connects on-premise and cloud investments to the suite, Adaptive Integration provides a comprehensive range of connectors to leading ERP, CRM, and proprietary and data warehouse sources. It’s easier than ever before to turn data to insight.
  • #26 We provide the only unified BI & CPM suite built from the “cloud up” – planning, reporting, consolidation and analytics solutions that are innovative, powerful and intuitive for all types of business users. We ensure customer success with the industry’s best service, support, and partner ecosystem.   The Adaptive Suite is the most complete cloud CPM and BI suite, including unified planning, reporting, consolidation and analytics solutions that are modern, powerful and intuitive for all types of business users. The Adaptive Suite is modern at the core, with built-in analytics, web and mobile access, and native collaboration capabilities. Adaptive Planning: Adaptive Planning provides comprehensive budgeting, planning, and forecasting that’s proven to reduce cycle times by up to 90%. With an incredibly intuitive “Excel-like” interface, it’s easy to collaboratively plan and forecast revenue, expenses and headcount, create rolling forecasts, and more. Adaptive Consolidation: Cut time and resources spent closing and reporting with Adaptive Consolidation. With a real-time consolidation engine at the core, it includes journal entry management, intercompany eliminations, account reclassifications, and even collaborative close process management – all as an easy to deploy cloud service. Adaptive Discovery: It’s simple to visually uncover insights into financial, sales, and operational performance with Adaptive Discovery. Intuitive dashboards, interactive scorecards, and even what-if modeling make it easy for every business user to analyze results and trends. Adaptive Reporting: Adaptive Reporting provides comprehensive financial, management, board and transactional reporting, all available through an easy to use web native drag-and-drop report builder. It’s completely self-service reporting for everyone. Adaptive Integration: With a powerful integration platform that connects on-premise and cloud investments to the suite, Adaptive Integration provides a comprehensive range of connectors to leading ERP, CRM, and proprietary and data warehouse sources. It’s easier than ever before to turn data to insight.
  • #27 We provide the only unified BI & CPM suite built from the “cloud up” – planning, reporting, consolidation and analytics solutions that are innovative, powerful and intuitive for all types of business users. We ensure customer success with the industry’s best service, support, and partner ecosystem.   The Adaptive Suite is the most complete cloud CPM and BI suite, including unified planning, reporting, consolidation and analytics solutions that are modern, powerful and intuitive for all types of business users. The Adaptive Suite is modern at the core, with built-in analytics, web and mobile access, and native collaboration capabilities. Adaptive Planning: Adaptive Planning provides comprehensive budgeting, planning, and forecasting that’s proven to reduce cycle times by up to 90%. With an incredibly intuitive “Excel-like” interface, it’s easy to collaboratively plan and forecast revenue, expenses and headcount, create rolling forecasts, and more. Adaptive Consolidation: Cut time and resources spent closing and reporting with Adaptive Consolidation. With a real-time consolidation engine at the core, it includes journal entry management, intercompany eliminations, account reclassifications, and even collaborative close process management – all as an easy to deploy cloud service. Adaptive Discovery: It’s simple to visually uncover insights into financial, sales, and operational performance with Adaptive Discovery. Intuitive dashboards, interactive scorecards, and even what-if modeling make it easy for every business user to analyze results and trends. Adaptive Reporting: Adaptive Reporting provides comprehensive financial, management, board and transactional reporting, all available through an easy to use web native drag-and-drop report builder. It’s completely self-service reporting for everyone. Adaptive Integration: With a powerful integration platform that connects on-premise and cloud investments to the suite, Adaptive Integration provides a comprehensive range of connectors to leading ERP, CRM, and proprietary and data warehouse sources. It’s easier than ever before to turn data to insight.
  • #28 We provide the only unified BI & CPM suite built from the “cloud up” – planning, reporting, consolidation and analytics solutions that are innovative, powerful and intuitive for all types of business users. We ensure customer success with the industry’s best service, support, and partner ecosystem.   The Adaptive Suite is the most complete cloud CPM and BI suite, including unified planning, reporting, consolidation and analytics solutions that are modern, powerful and intuitive for all types of business users. The Adaptive Suite is modern at the core, with built-in analytics, web and mobile access, and native collaboration capabilities. Adaptive Planning: Adaptive Planning provides comprehensive budgeting, planning, and forecasting that’s proven to reduce cycle times by up to 90%. With an incredibly intuitive “Excel-like” interface, it’s easy to collaboratively plan and forecast revenue, expenses and headcount, create rolling forecasts, and more. Adaptive Consolidation: Cut time and resources spent closing and reporting with Adaptive Consolidation. With a real-time consolidation engine at the core, it includes journal entry management, intercompany eliminations, account reclassifications, and even collaborative close process management – all as an easy to deploy cloud service. Adaptive Discovery: It’s simple to visually uncover insights into financial, sales, and operational performance with Adaptive Discovery. Intuitive dashboards, interactive scorecards, and even what-if modeling make it easy for every business user to analyze results and trends. Adaptive Reporting: Adaptive Reporting provides comprehensive financial, management, board and transactional reporting, all available through an easy to use web native drag-and-drop report builder. It’s completely self-service reporting for everyone. Adaptive Integration: With a powerful integration platform that connects on-premise and cloud investments to the suite, Adaptive Integration provides a comprehensive range of connectors to leading ERP, CRM, and proprietary and data warehouse sources. It’s easier than ever before to turn data to insight.
  • #31 We provide the only unified BI & CPM suite built from the “cloud up” – planning, reporting, consolidation and analytics solutions that are innovative, powerful and intuitive for all types of business users. We ensure customer success with the industry’s best service, support, and partner ecosystem.   The Adaptive Suite is the most complete cloud CPM and BI suite, including unified planning, reporting, consolidation and analytics solutions that are modern, powerful and intuitive for all types of business users. The Adaptive Suite is modern at the core, with built-in analytics, web and mobile access, and native collaboration capabilities. Adaptive Planning: Adaptive Planning provides comprehensive budgeting, planning, and forecasting that’s proven to reduce cycle times by up to 90%. With an incredibly intuitive “Excel-like” interface, it’s easy to collaboratively plan and forecast revenue, expenses and headcount, create rolling forecasts, and more. Adaptive Consolidation: Cut time and resources spent closing and reporting with Adaptive Consolidation. With a real-time consolidation engine at the core, it includes journal entry management, intercompany eliminations, account reclassifications, and even collaborative close process management – all as an easy to deploy cloud service. Adaptive Discovery: It’s simple to visually uncover insights into financial, sales, and operational performance with Adaptive Discovery. Intuitive dashboards, interactive scorecards, and even what-if modeling make it easy for every business user to analyze results and trends. Adaptive Reporting: Adaptive Reporting provides comprehensive financial, management, board and transactional reporting, all available through an easy to use web native drag-and-drop report builder. It’s completely self-service reporting for everyone. Adaptive Integration: With a powerful integration platform that connects on-premise and cloud investments to the suite, Adaptive Integration provides a comprehensive range of connectors to leading ERP, CRM, and proprietary and data warehouse sources. It’s easier than ever before to turn data to insight.