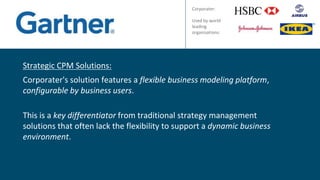
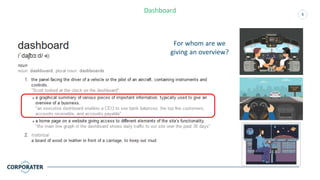
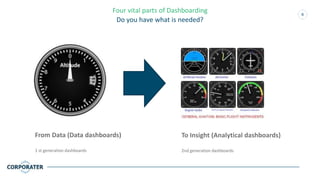
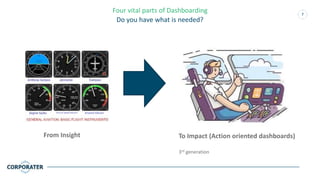
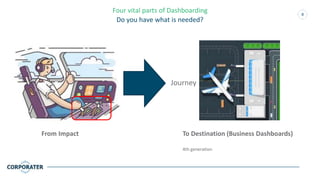
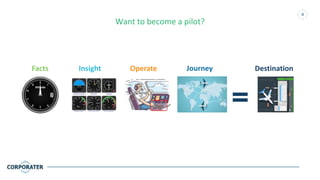
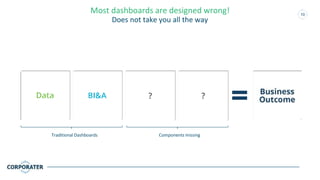
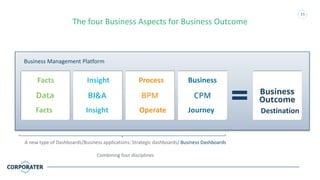
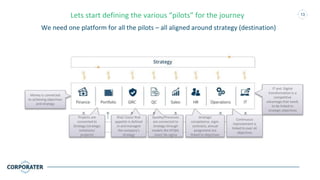
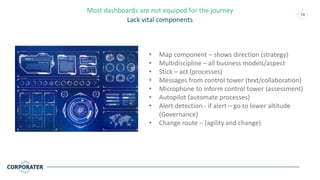
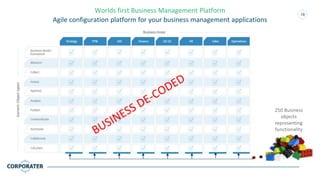
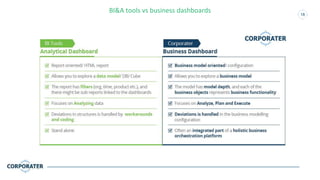
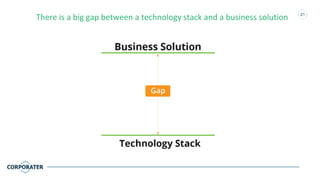
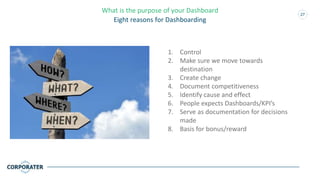
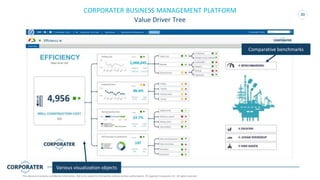
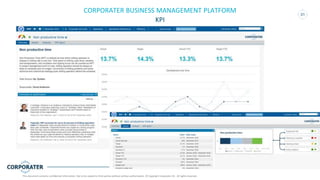
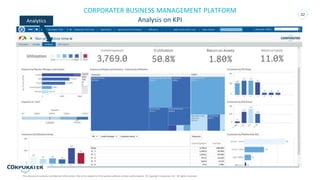
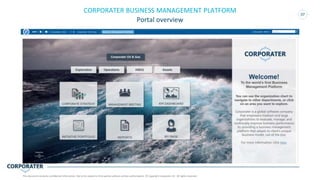
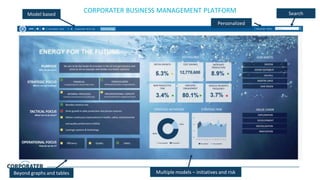
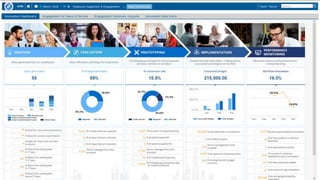
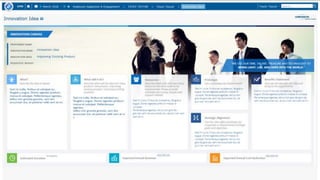
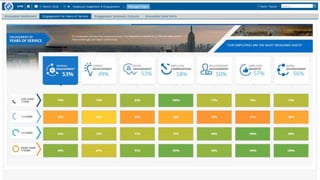
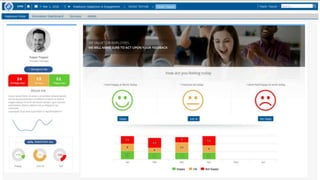
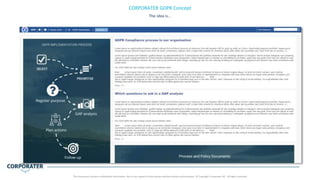
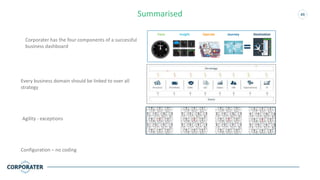
Corporater
How to Design a Strategic Dashboard?
This document contains confidential information. Not to be copied to third parties without written authorization. © Copyright Corporater AS - All rights reserved
2
GLOBAL SOFTWARE COMPANY
Focusing on Business Management
Global software company
95 % customer retention
Founded in 2000
1.000 customers in 50 countries
Offer a disruptive Business Management Platform
30 % yearly growth year on year
Analyst:
Current offices
Cloud:Technology partners: Partners:
Strategic CPM Solutions:
Corporater's solution features a flexible business modeling platform,
configurable by business users.
This is a key differentiator from traditional strategy management
solutions that often lack the flexibility to support a dynamic business
environment.
Corporater:
Used by world
leading
organisations:
5
Dashboard
For whom are we
giving an overview?
6
Four vital parts of Dashboarding
Do you have what is needed?
From Data (Data dashboards)
1 st generation dashboards
To Insight (Analytical dashboards)
2nd generation dashboards
7
Four vital parts of Dashboarding
Do you have what is needed?
From Insight To Impact (Action oriented dashboards)
3rd generation
8
Four vital parts of Dashboarding
Do you have what is needed?
From Impact To Destination (Business Dashboards)
4th generation
Journey
9
Want to become a pilot?
JourneyOperateInsightFacts Destination
10
Most dashboards are designed wrong!
Does not take you all the way
Components missingTraditional Dashboards
11
Business Management Platform
The four Business Aspects for Business Outcome
A new type of Dashboards/Business applications: Strategic dashboards/ Business Dashboards
Combining four disciplines
Facts Insight Process Business
JourneyOperateInsightFacts Destination
How does a Strategic Dashboard look?
13Lets start defining the various “pilots” for the journey
We need one platform for all the pilots – all aligned around strategy (destination)
Money is connected
to achieving objectives
and strategy
Projects are
connected to
Strategy (strategic
initiatives/
projects)
Risk/ Coso/ Risk
appetite is defined
in and managed
the company’s
strategy
Quality/Processes
are connected to
strategy through
models like EFQM,
Lean/ Six sigma
Strategic
competence, mgm.
contracts, annual
assignment are
linked to objectives
IT and Digital
transformation is a
competitive
advantage that needs
to be linked to
strategic objectives
Continuous
improvement is
linked to over all
objectives
14
Most dashboards are not equiped for the journey
Lack vital components
• Map component – shows direction (strategy)
• Multidiscipline – all business models/aspect
• Stick – act (processes)
• Messages from control tower (text/collaboration)
• Microphone to inform control tower (assessment)
• Autopilot (automate processes)
• Alert detection - if alert – go to lower altitude
(Governance)
• Change route – (agility and change)
15
We have researched businesses over the last 20
years and found the building blocks for success
16
Worlds first Business Management Platform
Agile configuration platform for your business management applications
250 Business
objects
representing
functionality
Demo
18
Positioning II BI&A tools vs business dashboards
5 pitfalls
1. Technology stack vs Business Solution
21
There is a big gap between a technology stack and a business solution
22
Our research has identified that critical functionality is lacking
Which can explain why so many BI&A projects are not delivering business value
23
• Business
• Business solution
• Structure, content, objects, model
• Descriptive and qualitative information
• Assessment and verbal input
• Business model frameworks
• Decision making
• Audit, governance
• Decision library
• Accountability
• Collaboration
• Augmented knowledge management
• Process
• Actions and initiatives
• Notifications
• Decision rule execution engine
• Workflow
• Analytics
• Industry benchmarks/ benchmarking clearing houses
• Comparative benchmarks
• Data
• Manual data input/ write back
• Access control and user rights to the solution
• Approvals of content/data/model
• Business metadata
Our research has identified that critical functionality is lacking
Which can explain why so many BI&A projects are not delivering business value
2. Can you tell the story with technology
25
Objective:
Inflated balloon
Action/ Initiative
Use a pump
KPI (driver):
Number of pumps per second
KPI: (driver) Hours used in Gym
KPI (lag):
Pressure level BAR
Risk factor:
Balloon explodesRisk factor:
Hose gets disconnected
Risk factor:
Man gets heart attack
Target:
Pressure level (BAR)?
Story tellers
Business Orchestration
3. A story has a purpose – what is the
purpose of your dashboard
27
What is the purpose of your Dashboard
Eight reasons for Dashboarding
1. Control
2. Make sure we move towards
destination
3. Create change
4. Document competitiveness
5. Identify cause and effect
6. People expects Dashboards/KPI’s
7. Serve as documentation for decisions
made
8. Basis for bonus/reward
4. Analytic is not the business – it
supports the business
29
CORPORATER BUSINESS MANAGEMENT PLATFORMModel based Search
Personalized
Beyond graphs and tables Multiple models – initiatives and risk
30
CORPORATER BUSINESS MANAGEMENT PLATFORM
Value Driver Tree
This document contains confidential information. Not to be copied to third parties without written authorization. © Copyright Corporater AS - All rights reserved.
Various visualization objects
Comparative benchmarks
31
CORPORATER BUSINESS MANAGEMENT PLATFORM
KPI
This document contains confidential information. Not to be copied to third parties without written authorization. © Copyright Corporater AS - All rights reserved.
32
CORPORATER BUSINESS MANAGEMENT PLATFORM
Analysis on KPI
This document contains confidential information. Not to be copied to third parties without written authorization. © Copyright Corporater AS - All rights reserved.
Analytics
5. Software is built fundamentally wrong
– watch out
34
Software is built for an ideal world
Handling exceptions is expensive and gives little flexibility
The belief:
• No exceptions
• No deviations
• Everything can be fit into tables, columns and rows
Reality:
• Exception is the rule
• The real world is not able to fit into the structures we
create (tables, columns and rows)
• We have to find a new way of modelling that has the
flexibility (data modelling vs business modelling)
The Corporater Business Management
Platform and various dashboards
36
37
CORPORATER BUSINESS MANAGEMENT PLATFORM
Portal overview
This document contains confidential information. Not to be copied to third parties without written authorization. © Copyright Corporater AS - All rights reserved.
38
CORPORATER BUSINESS MANAGEMENT PLATFORMModel based Search
Personalized
Beyond graphs and tables Multiple models – initiatives and risk
The idea is…
CORPORATER GDPR Concept
This document contains confidential information. Not to be copied to third parties without written authorization. © Copyright Corporater AS - All rights reserved
GDPR Project dashboard
CORPORATER GDPR Concept
This document contains confidential information. Not to be copied to third parties without written authorization. © Copyright Corporater AS - All rights reserved
46Summarised
JourneyOperateInsightFacts Destination
Corporater has the four components of a successful
business dashboard
Every business domain should be linked to over all
strategy
Configuration – no coding
Agility - exceptions
DELIVERING BETTER BUSINESS OUTCOMES
CORPORATER BUSINESS MANAGEMENT PLATFORM

How to Design a Strategic Dashboard?

  • 1.
    Corporater How to Designa Strategic Dashboard? This document contains confidential information. Not to be copied to third parties without written authorization. © Copyright Corporater AS - All rights reserved
  • 2.
    2 GLOBAL SOFTWARE COMPANY Focusingon Business Management Global software company 95 % customer retention Founded in 2000 1.000 customers in 50 countries Offer a disruptive Business Management Platform 30 % yearly growth year on year Analyst: Current offices Cloud:Technology partners: Partners:
  • 3.
    Strategic CPM Solutions: Corporater'ssolution features a flexible business modeling platform, configurable by business users. This is a key differentiator from traditional strategy management solutions that often lack the flexibility to support a dynamic business environment. Corporater: Used by world leading organisations:
  • 4.
    5 Dashboard For whom arewe giving an overview?
  • 5.
    6 Four vital partsof Dashboarding Do you have what is needed? From Data (Data dashboards) 1 st generation dashboards To Insight (Analytical dashboards) 2nd generation dashboards
  • 6.
    7 Four vital partsof Dashboarding Do you have what is needed? From Insight To Impact (Action oriented dashboards) 3rd generation
  • 7.
    8 Four vital partsof Dashboarding Do you have what is needed? From Impact To Destination (Business Dashboards) 4th generation Journey
  • 8.
    9 Want to becomea pilot? JourneyOperateInsightFacts Destination
  • 9.
    10 Most dashboards aredesigned wrong! Does not take you all the way Components missingTraditional Dashboards
  • 10.
    11 Business Management Platform Thefour Business Aspects for Business Outcome A new type of Dashboards/Business applications: Strategic dashboards/ Business Dashboards Combining four disciplines Facts Insight Process Business JourneyOperateInsightFacts Destination
  • 11.
    How does aStrategic Dashboard look?
  • 12.
    13Lets start definingthe various “pilots” for the journey We need one platform for all the pilots – all aligned around strategy (destination) Money is connected to achieving objectives and strategy Projects are connected to Strategy (strategic initiatives/ projects) Risk/ Coso/ Risk appetite is defined in and managed the company’s strategy Quality/Processes are connected to strategy through models like EFQM, Lean/ Six sigma Strategic competence, mgm. contracts, annual assignment are linked to objectives IT and Digital transformation is a competitive advantage that needs to be linked to strategic objectives Continuous improvement is linked to over all objectives
  • 13.
    14 Most dashboards arenot equiped for the journey Lack vital components • Map component – shows direction (strategy) • Multidiscipline – all business models/aspect • Stick – act (processes) • Messages from control tower (text/collaboration) • Microphone to inform control tower (assessment) • Autopilot (automate processes) • Alert detection - if alert – go to lower altitude (Governance) • Change route – (agility and change)
  • 14.
    15 We have researchedbusinesses over the last 20 years and found the building blocks for success
  • 15.
    16 Worlds first BusinessManagement Platform Agile configuration platform for your business management applications 250 Business objects representing functionality
  • 16.
  • 17.
    18 Positioning II BI&Atools vs business dashboards
  • 18.
  • 19.
    1. Technology stackvs Business Solution
  • 20.
    21 There is abig gap between a technology stack and a business solution
  • 21.
    22 Our research hasidentified that critical functionality is lacking Which can explain why so many BI&A projects are not delivering business value
  • 22.
    23 • Business • Businesssolution • Structure, content, objects, model • Descriptive and qualitative information • Assessment and verbal input • Business model frameworks • Decision making • Audit, governance • Decision library • Accountability • Collaboration • Augmented knowledge management • Process • Actions and initiatives • Notifications • Decision rule execution engine • Workflow • Analytics • Industry benchmarks/ benchmarking clearing houses • Comparative benchmarks • Data • Manual data input/ write back • Access control and user rights to the solution • Approvals of content/data/model • Business metadata Our research has identified that critical functionality is lacking Which can explain why so many BI&A projects are not delivering business value
  • 23.
    2. Can youtell the story with technology
  • 24.
    25 Objective: Inflated balloon Action/ Initiative Usea pump KPI (driver): Number of pumps per second KPI: (driver) Hours used in Gym KPI (lag): Pressure level BAR Risk factor: Balloon explodesRisk factor: Hose gets disconnected Risk factor: Man gets heart attack Target: Pressure level (BAR)? Story tellers Business Orchestration
  • 25.
    3. A storyhas a purpose – what is the purpose of your dashboard
  • 26.
    27 What is thepurpose of your Dashboard Eight reasons for Dashboarding 1. Control 2. Make sure we move towards destination 3. Create change 4. Document competitiveness 5. Identify cause and effect 6. People expects Dashboards/KPI’s 7. Serve as documentation for decisions made 8. Basis for bonus/reward
  • 27.
    4. Analytic isnot the business – it supports the business
  • 28.
    29 CORPORATER BUSINESS MANAGEMENTPLATFORMModel based Search Personalized Beyond graphs and tables Multiple models – initiatives and risk
  • 29.
    30 CORPORATER BUSINESS MANAGEMENTPLATFORM Value Driver Tree This document contains confidential information. Not to be copied to third parties without written authorization. © Copyright Corporater AS - All rights reserved. Various visualization objects Comparative benchmarks
  • 30.
    31 CORPORATER BUSINESS MANAGEMENTPLATFORM KPI This document contains confidential information. Not to be copied to third parties without written authorization. © Copyright Corporater AS - All rights reserved.
  • 31.
    32 CORPORATER BUSINESS MANAGEMENTPLATFORM Analysis on KPI This document contains confidential information. Not to be copied to third parties without written authorization. © Copyright Corporater AS - All rights reserved. Analytics
  • 32.
    5. Software isbuilt fundamentally wrong – watch out
  • 33.
    34 Software is builtfor an ideal world Handling exceptions is expensive and gives little flexibility The belief: • No exceptions • No deviations • Everything can be fit into tables, columns and rows Reality: • Exception is the rule • The real world is not able to fit into the structures we create (tables, columns and rows) • We have to find a new way of modelling that has the flexibility (data modelling vs business modelling)
  • 34.
    The Corporater BusinessManagement Platform and various dashboards
  • 35.
  • 36.
    37 CORPORATER BUSINESS MANAGEMENTPLATFORM Portal overview This document contains confidential information. Not to be copied to third parties without written authorization. © Copyright Corporater AS - All rights reserved.
  • 37.
    38 CORPORATER BUSINESS MANAGEMENTPLATFORMModel based Search Personalized Beyond graphs and tables Multiple models – initiatives and risk
  • 43.
    The idea is… CORPORATERGDPR Concept This document contains confidential information. Not to be copied to third parties without written authorization. © Copyright Corporater AS - All rights reserved
  • 44.
    GDPR Project dashboard CORPORATERGDPR Concept This document contains confidential information. Not to be copied to third parties without written authorization. © Copyright Corporater AS - All rights reserved
  • 45.
    46Summarised JourneyOperateInsightFacts Destination Corporater hasthe four components of a successful business dashboard Every business domain should be linked to over all strategy Configuration – no coding Agility - exceptions
  • 46.
    DELIVERING BETTER BUSINESSOUTCOMES CORPORATER BUSINESS MANAGEMENT PLATFORM