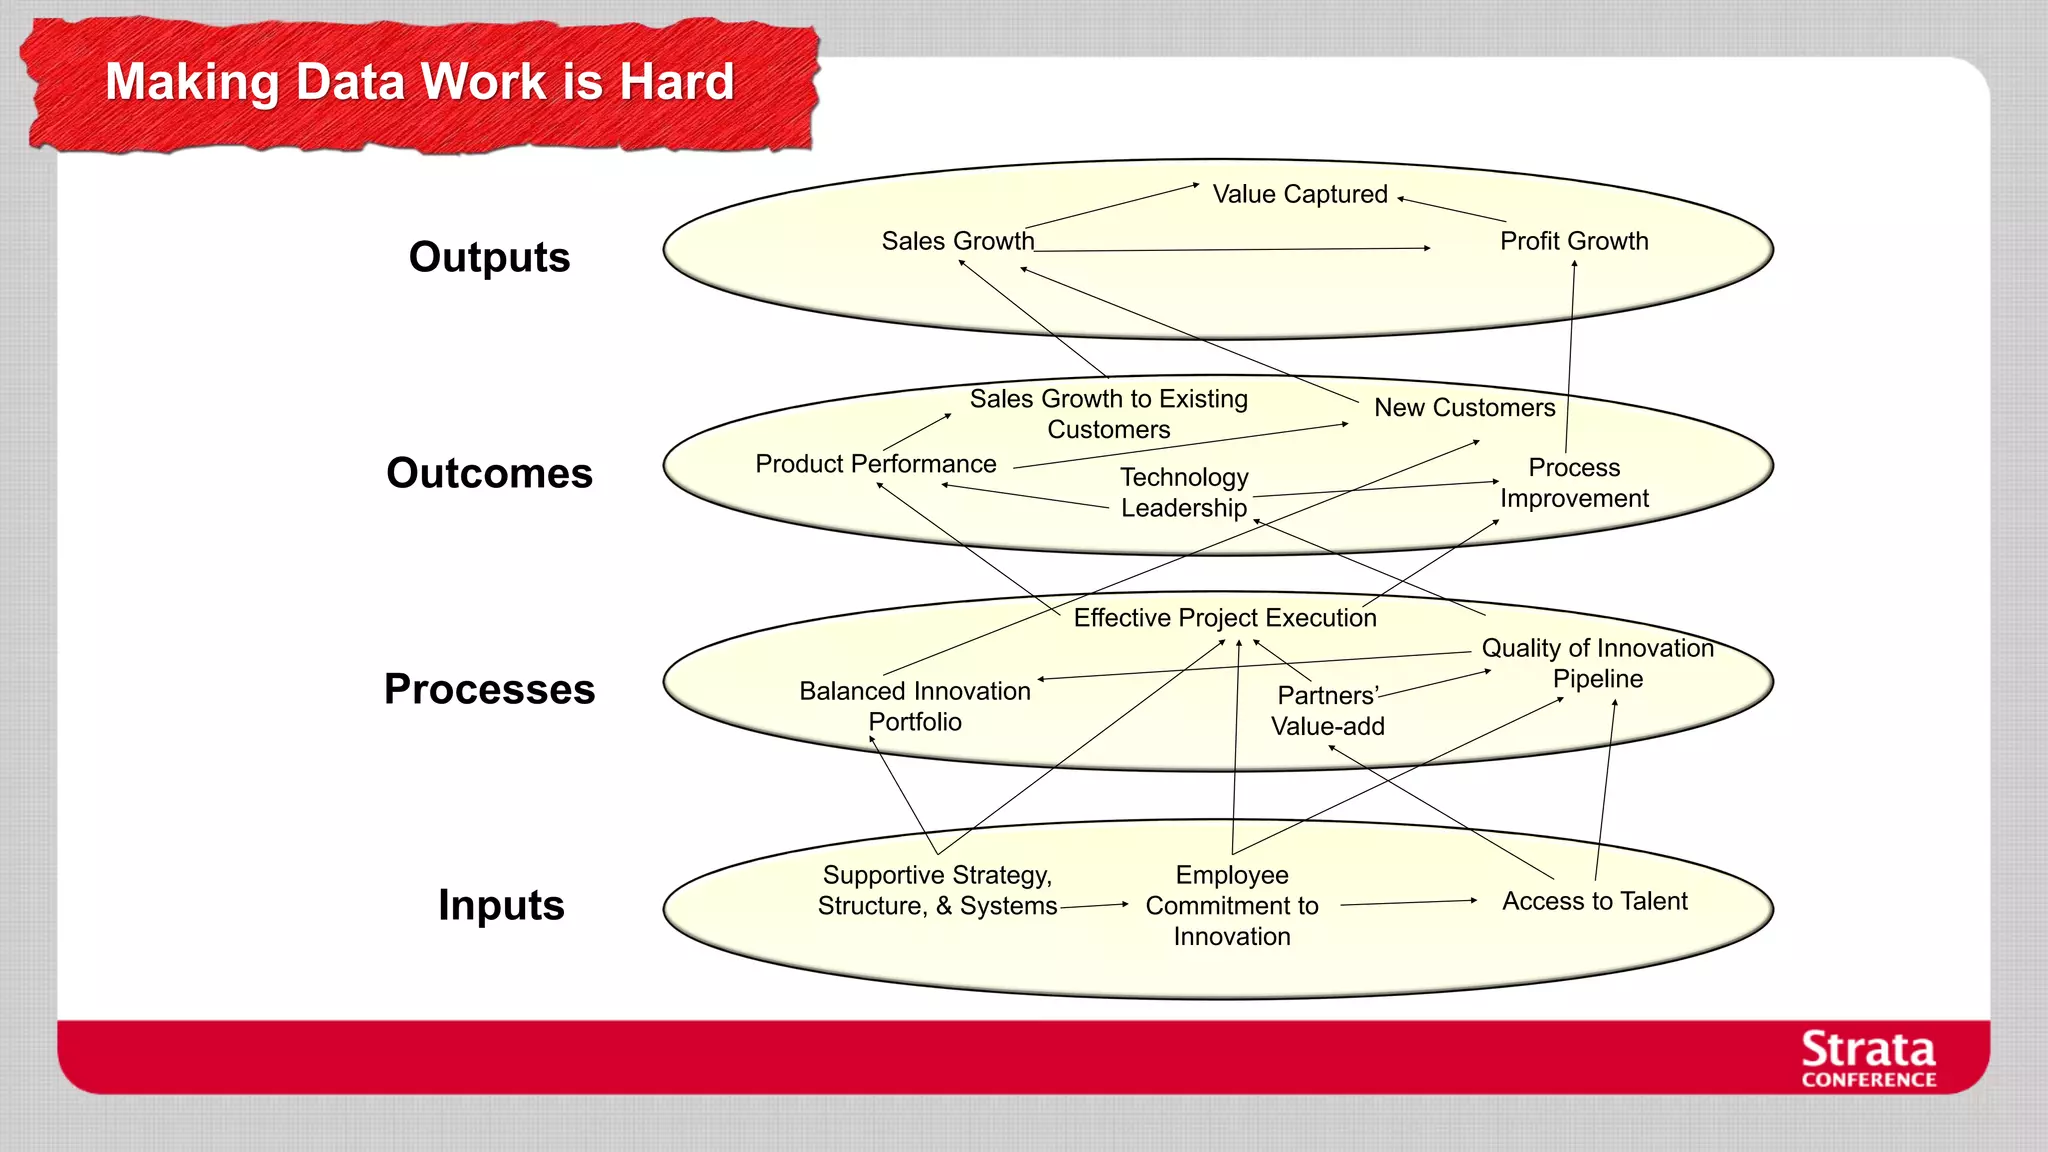
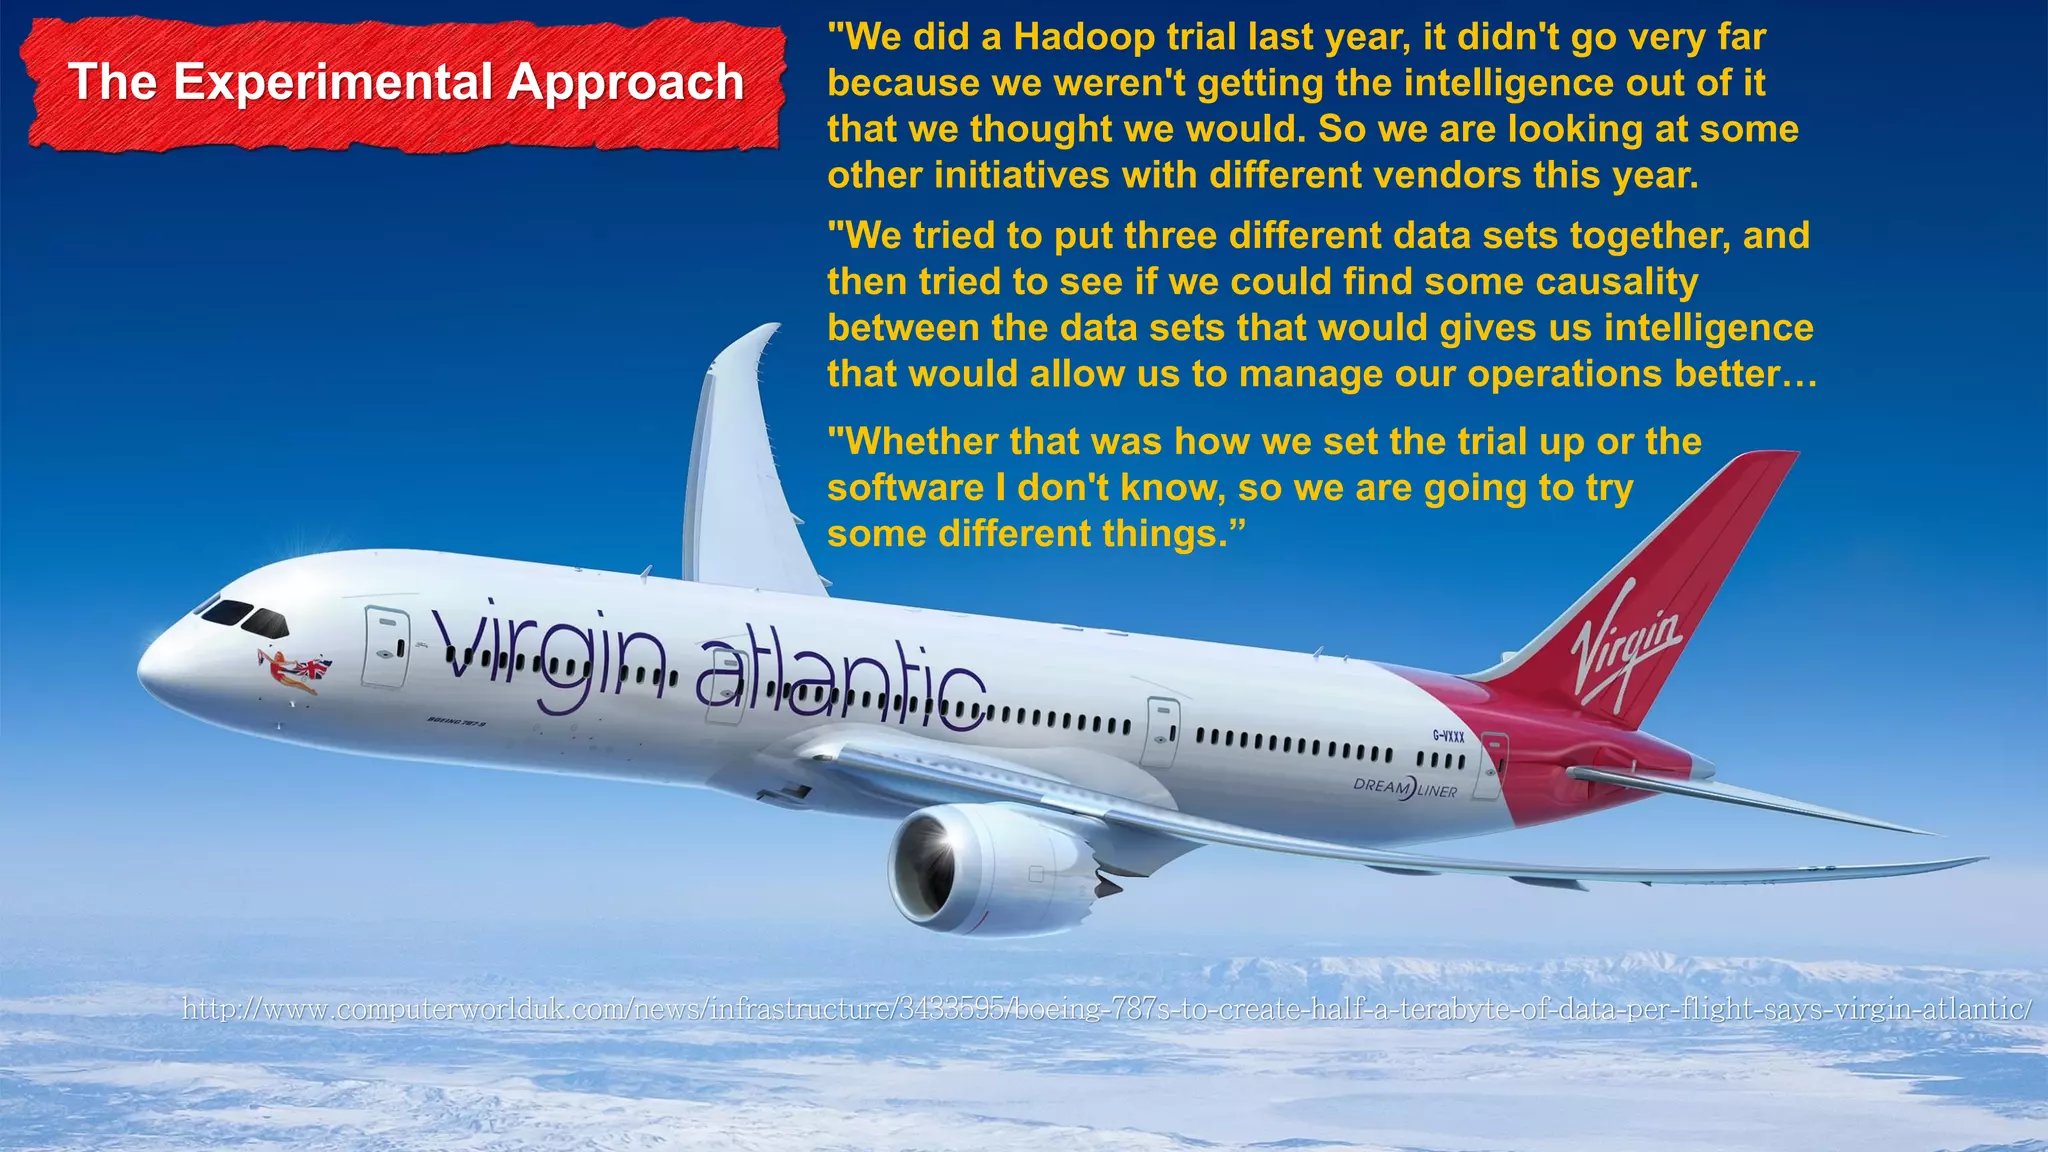
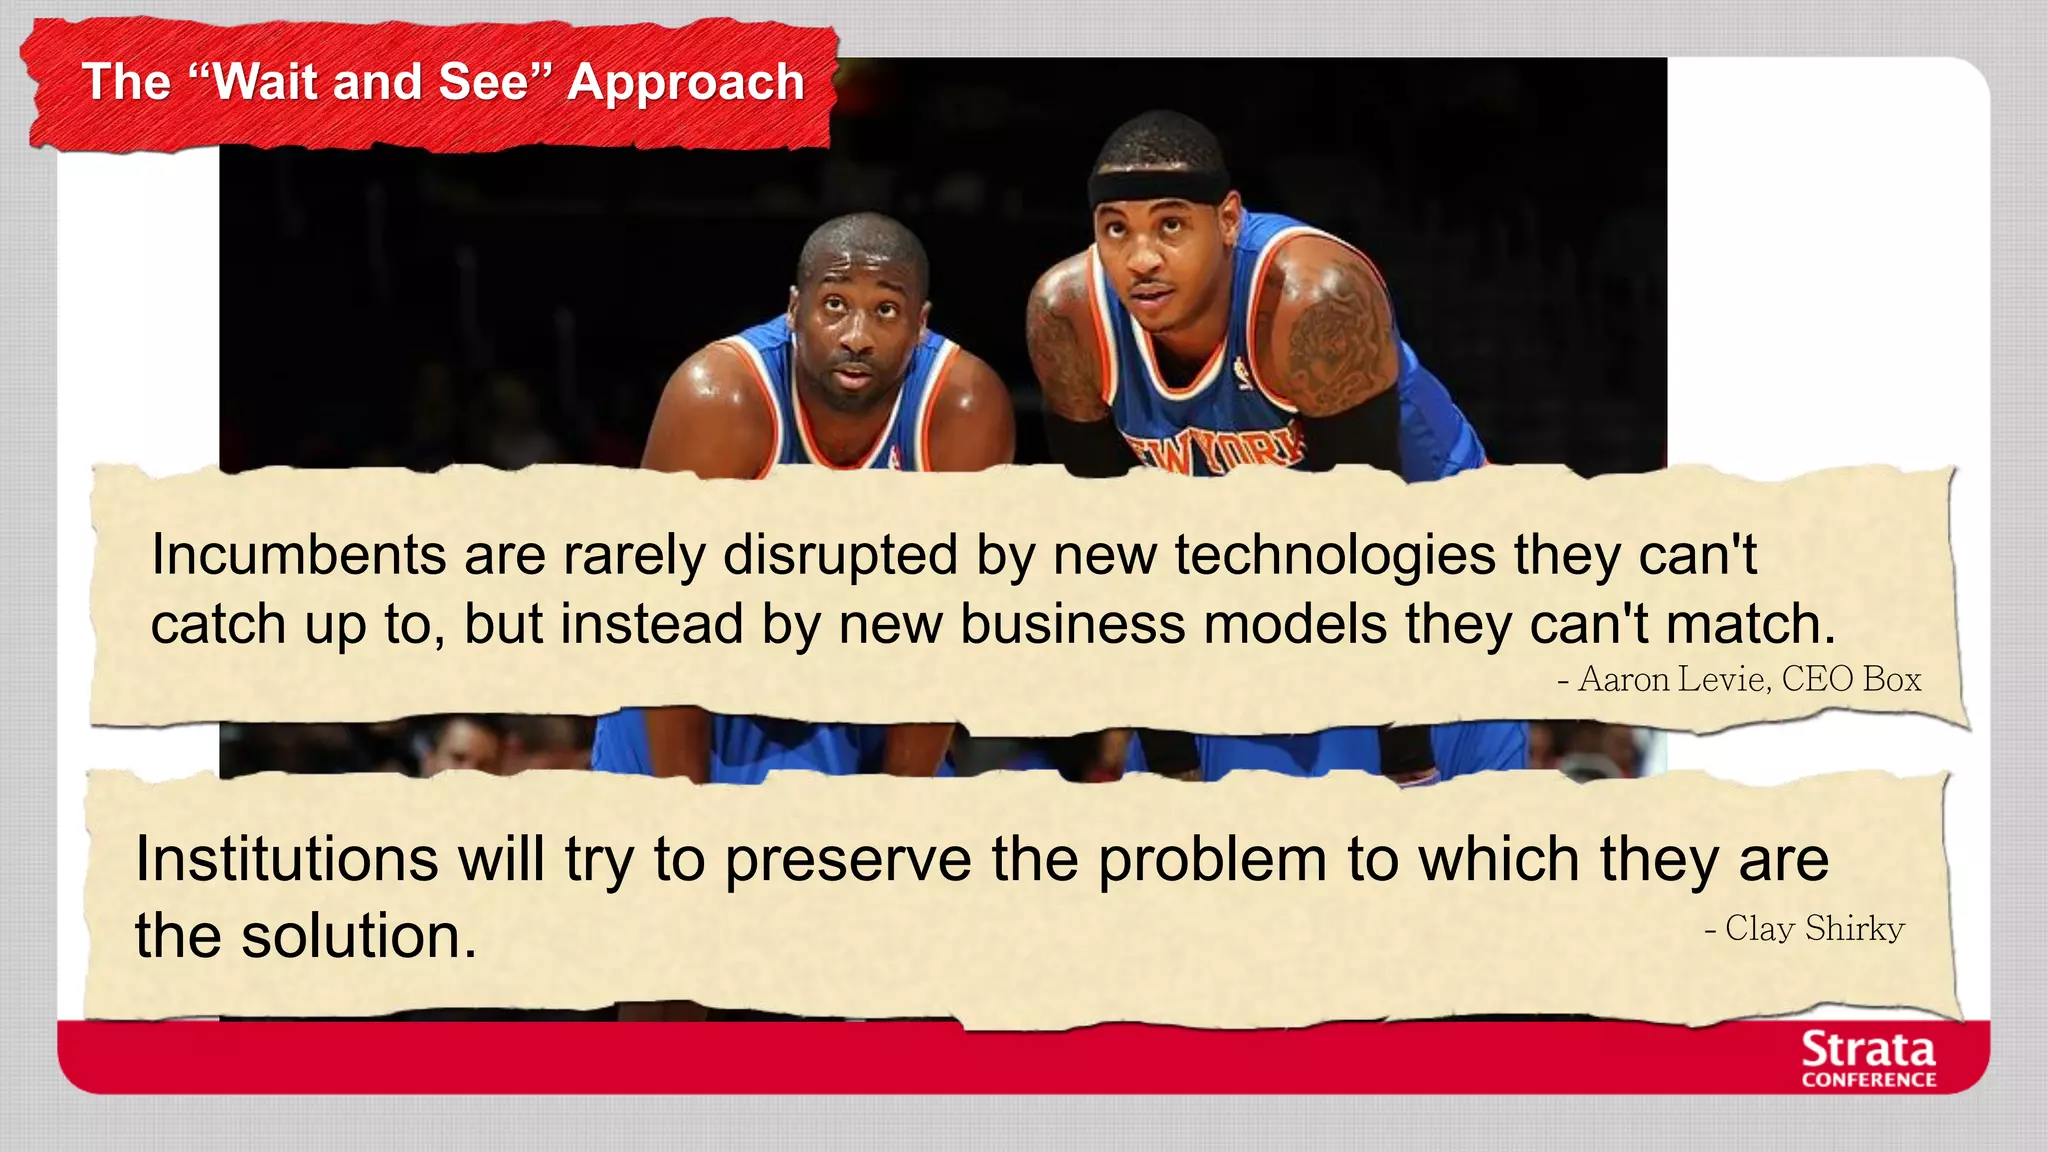
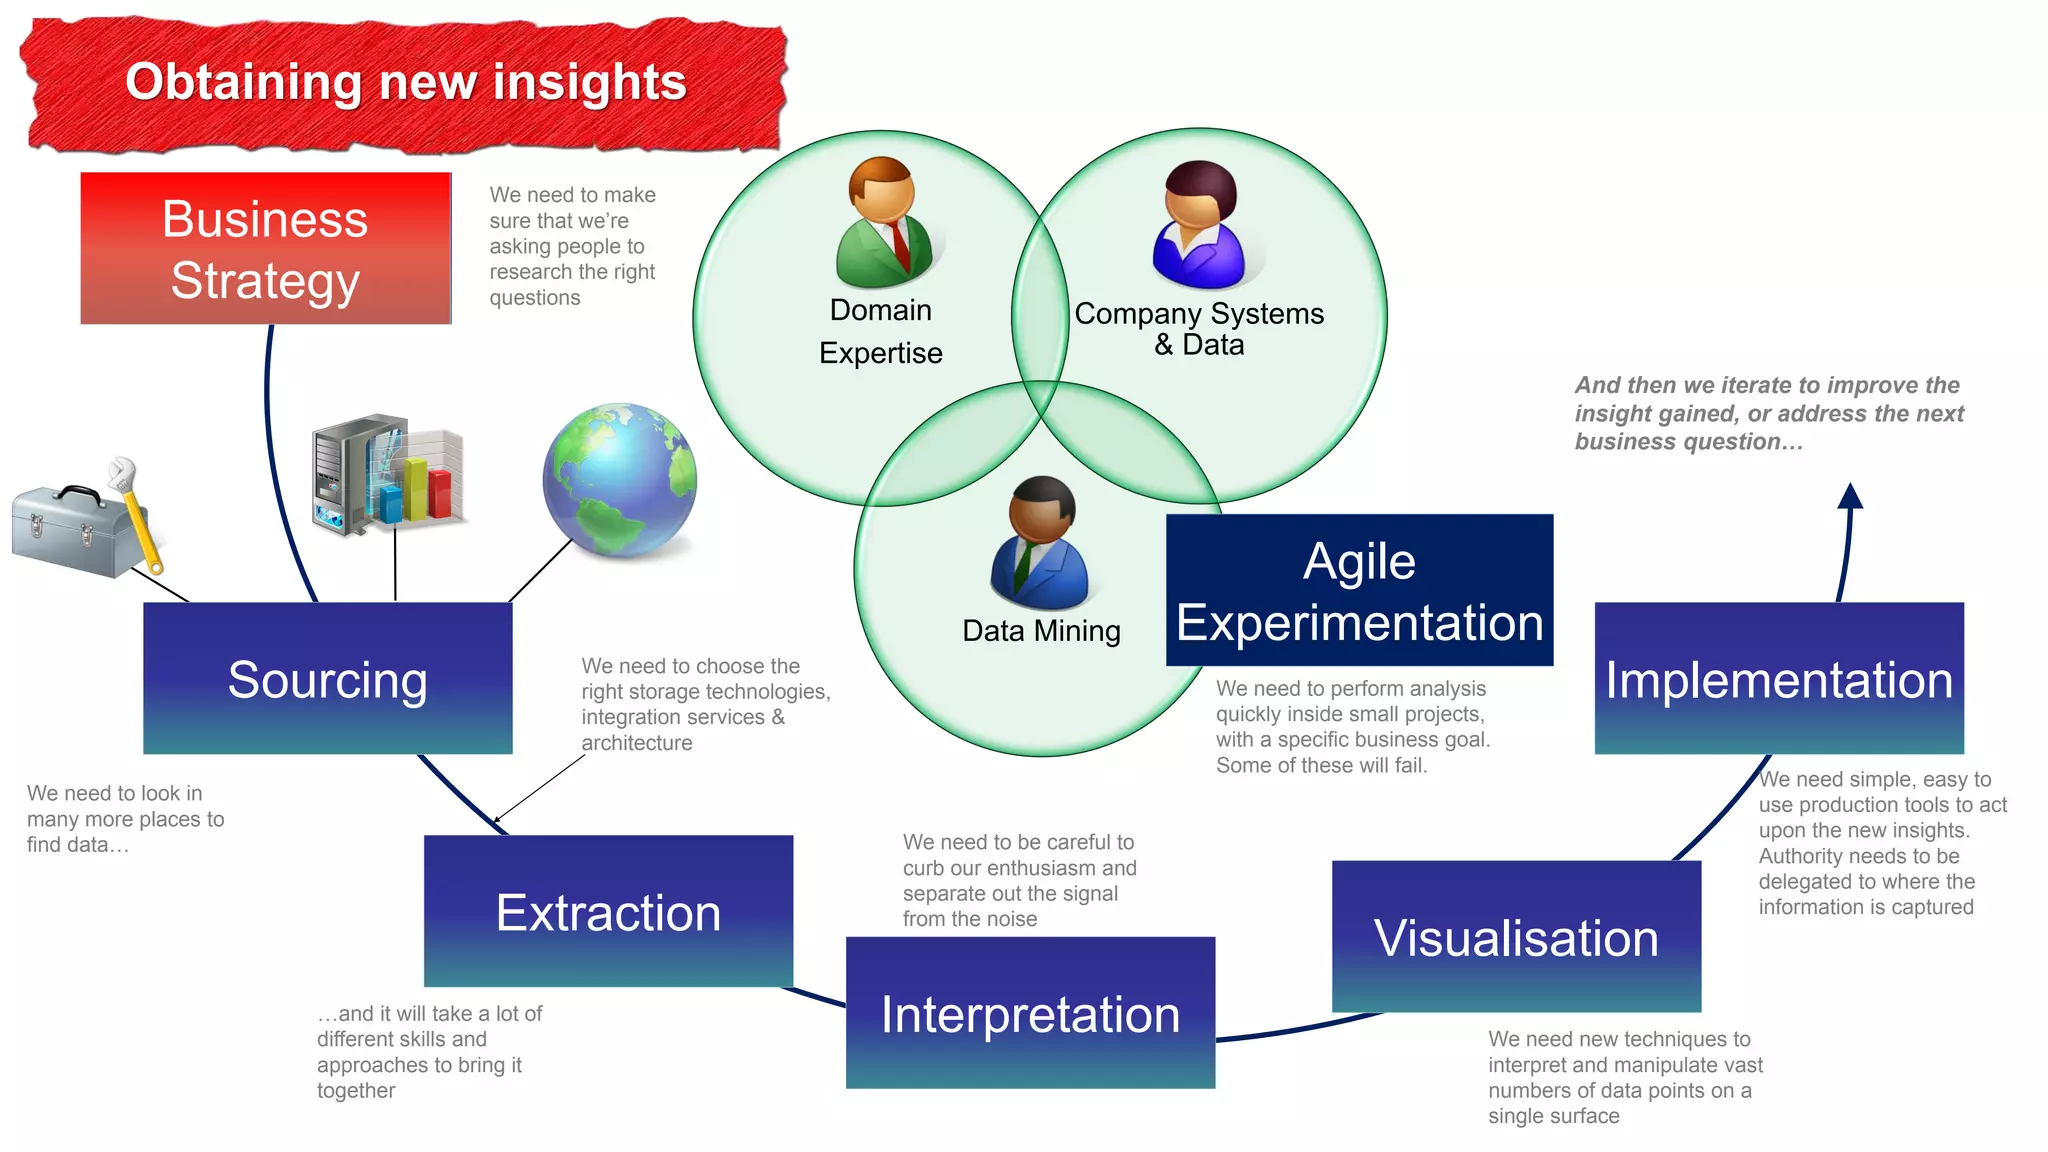
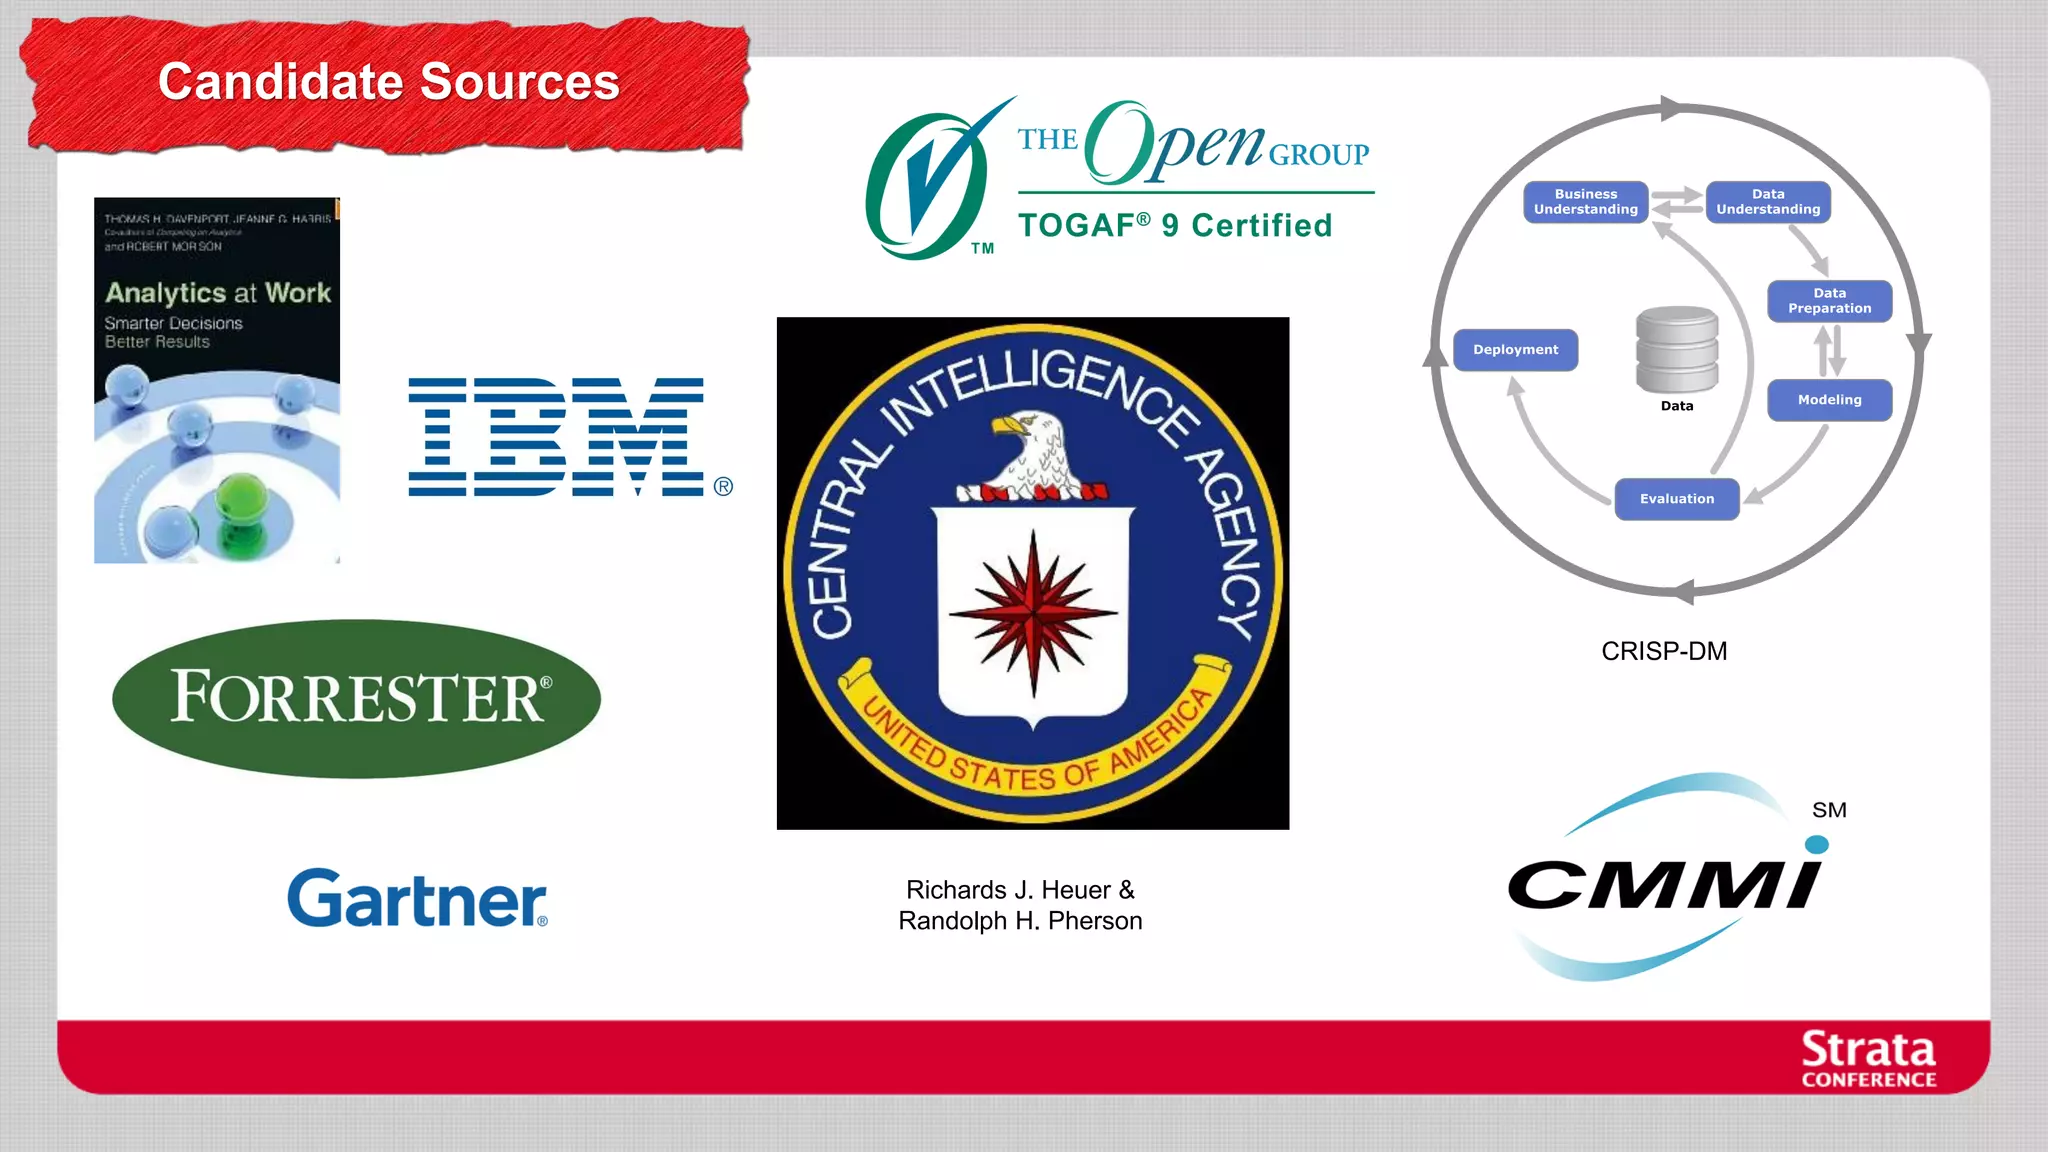
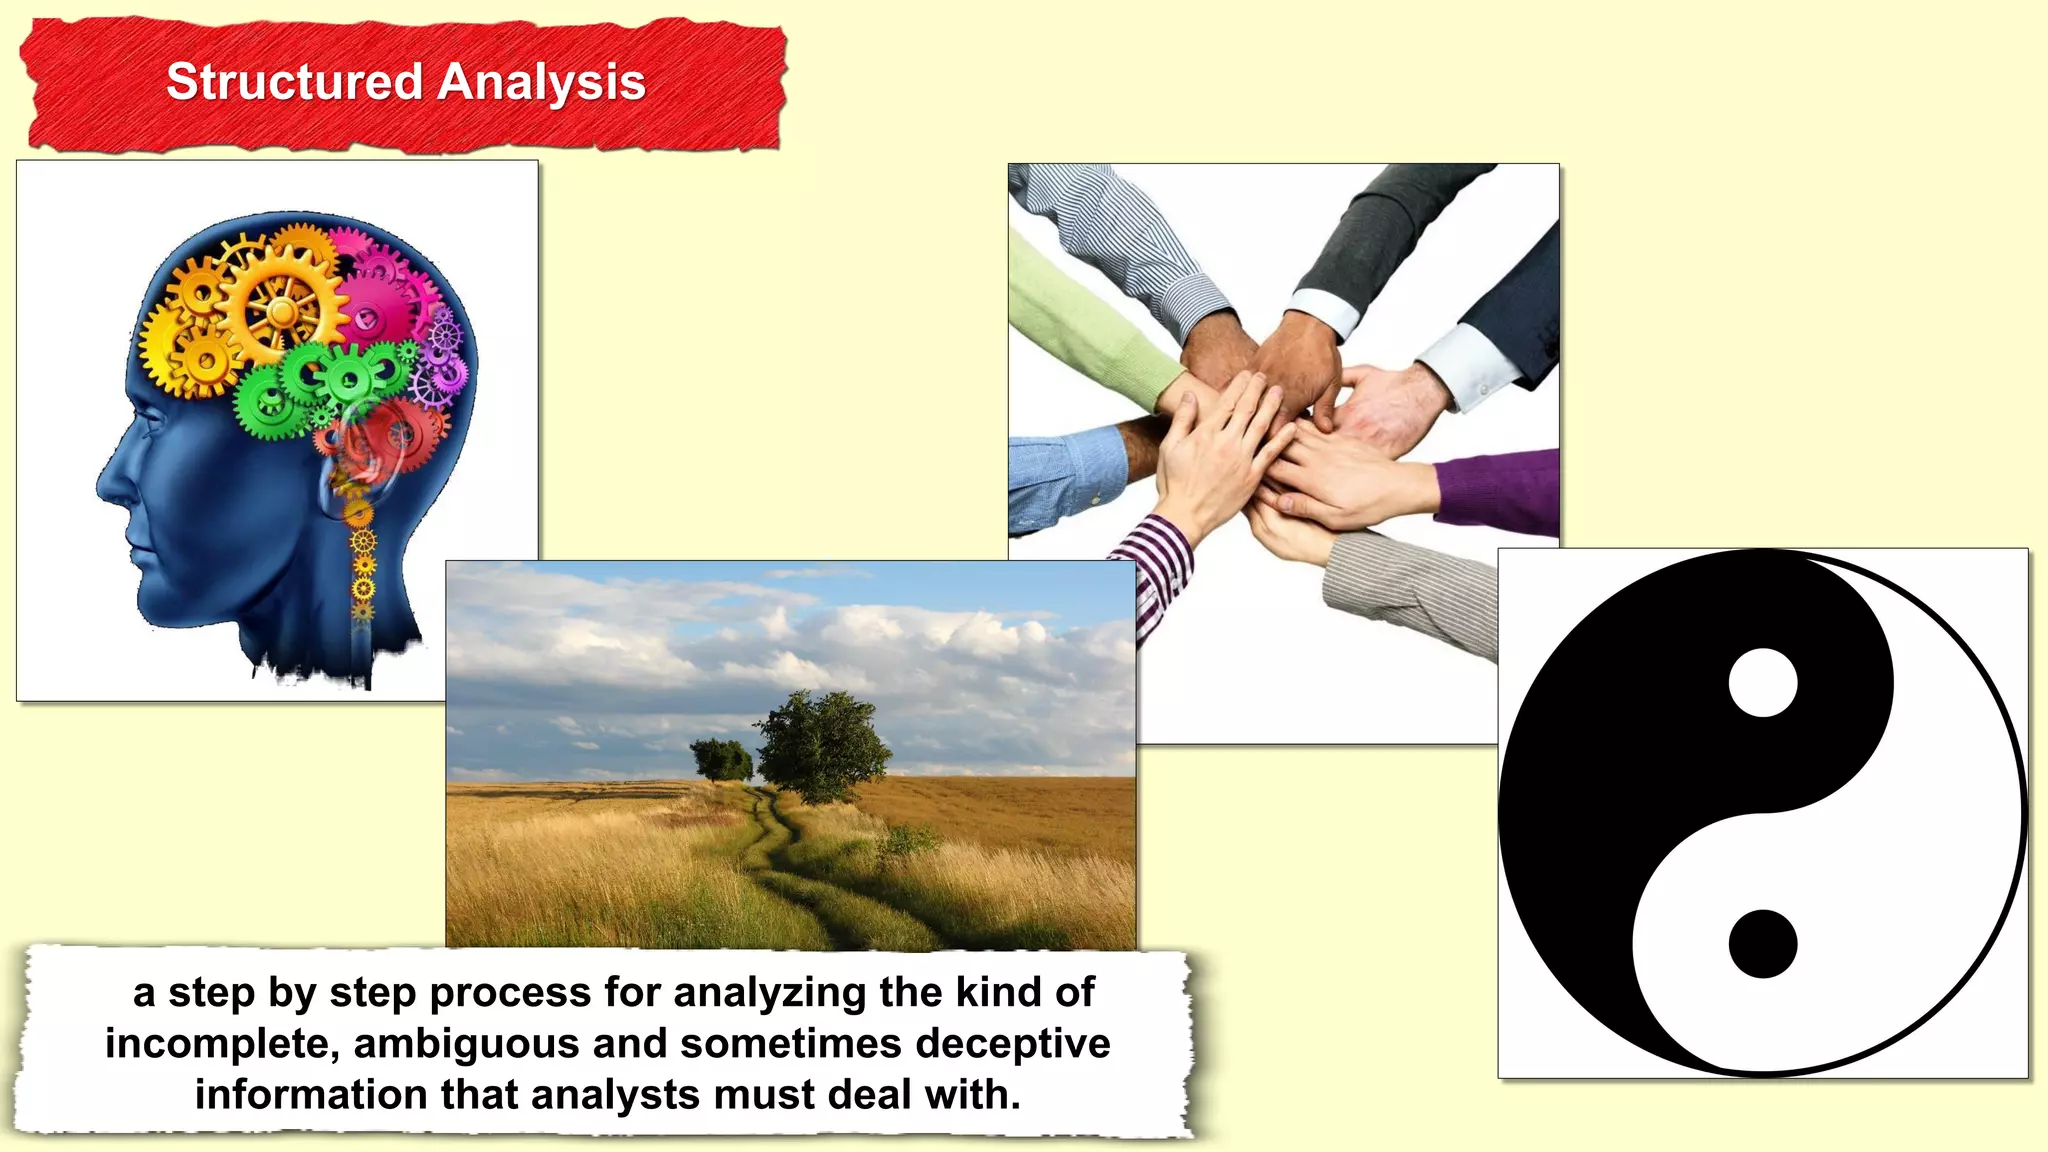
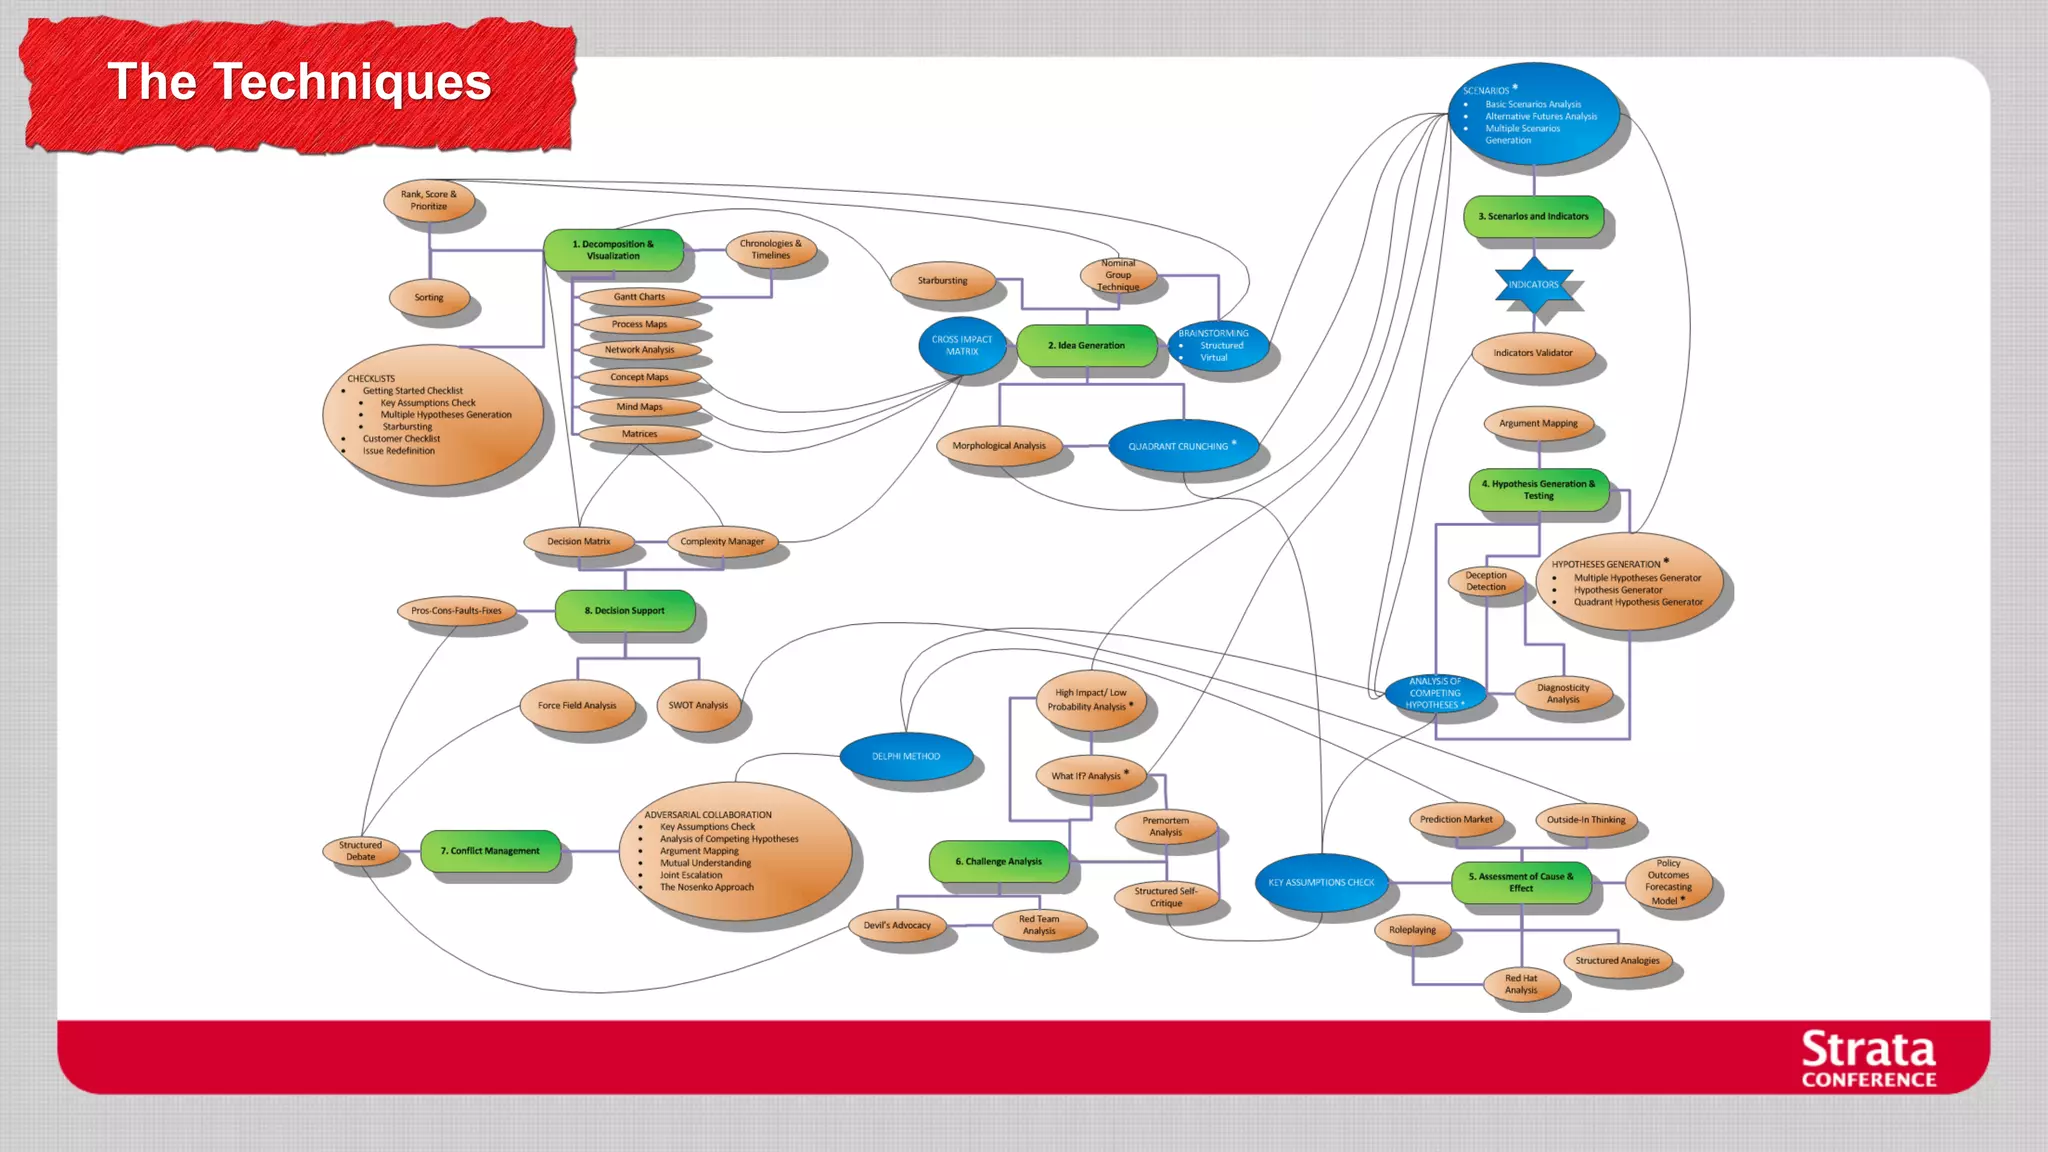
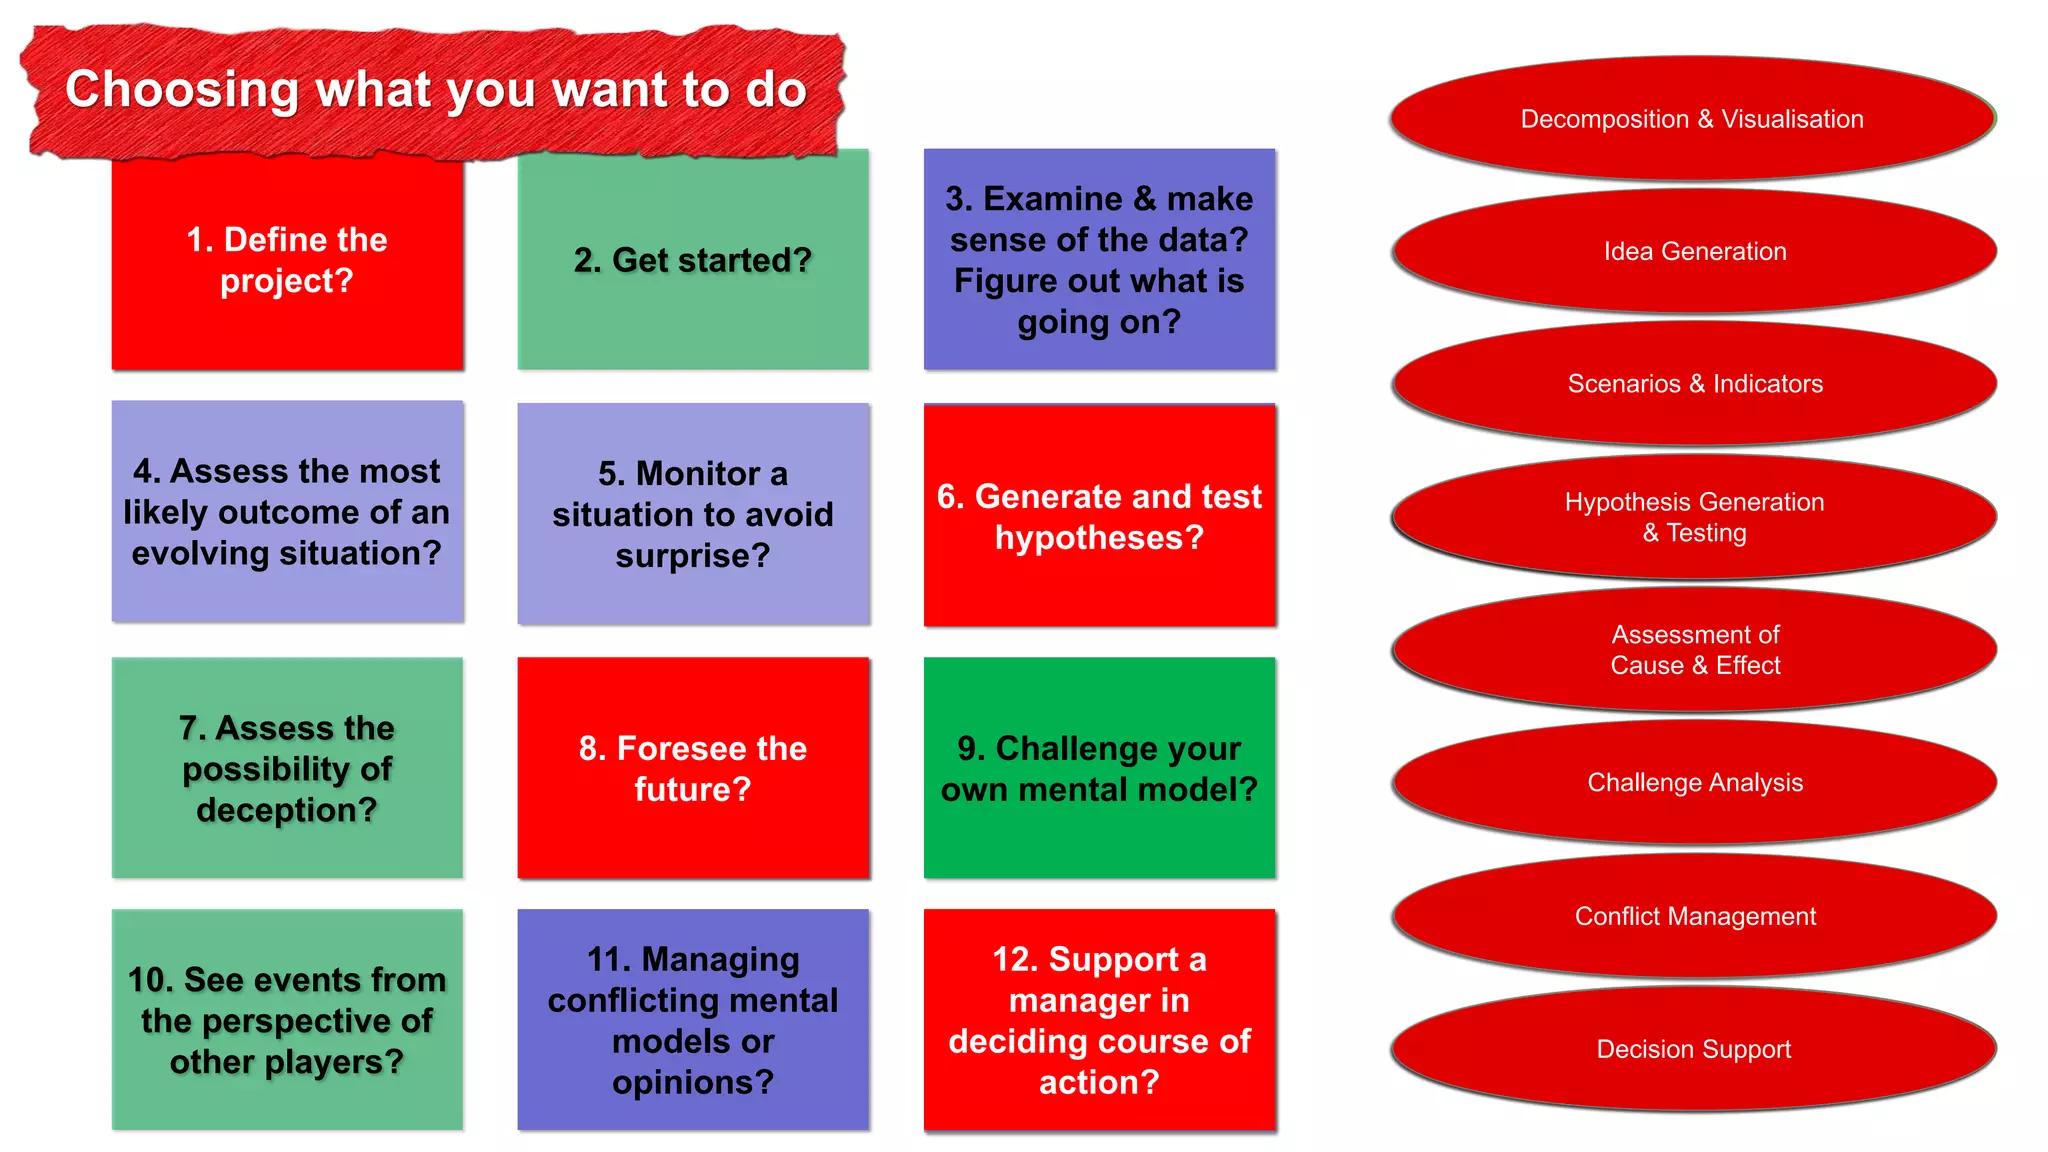
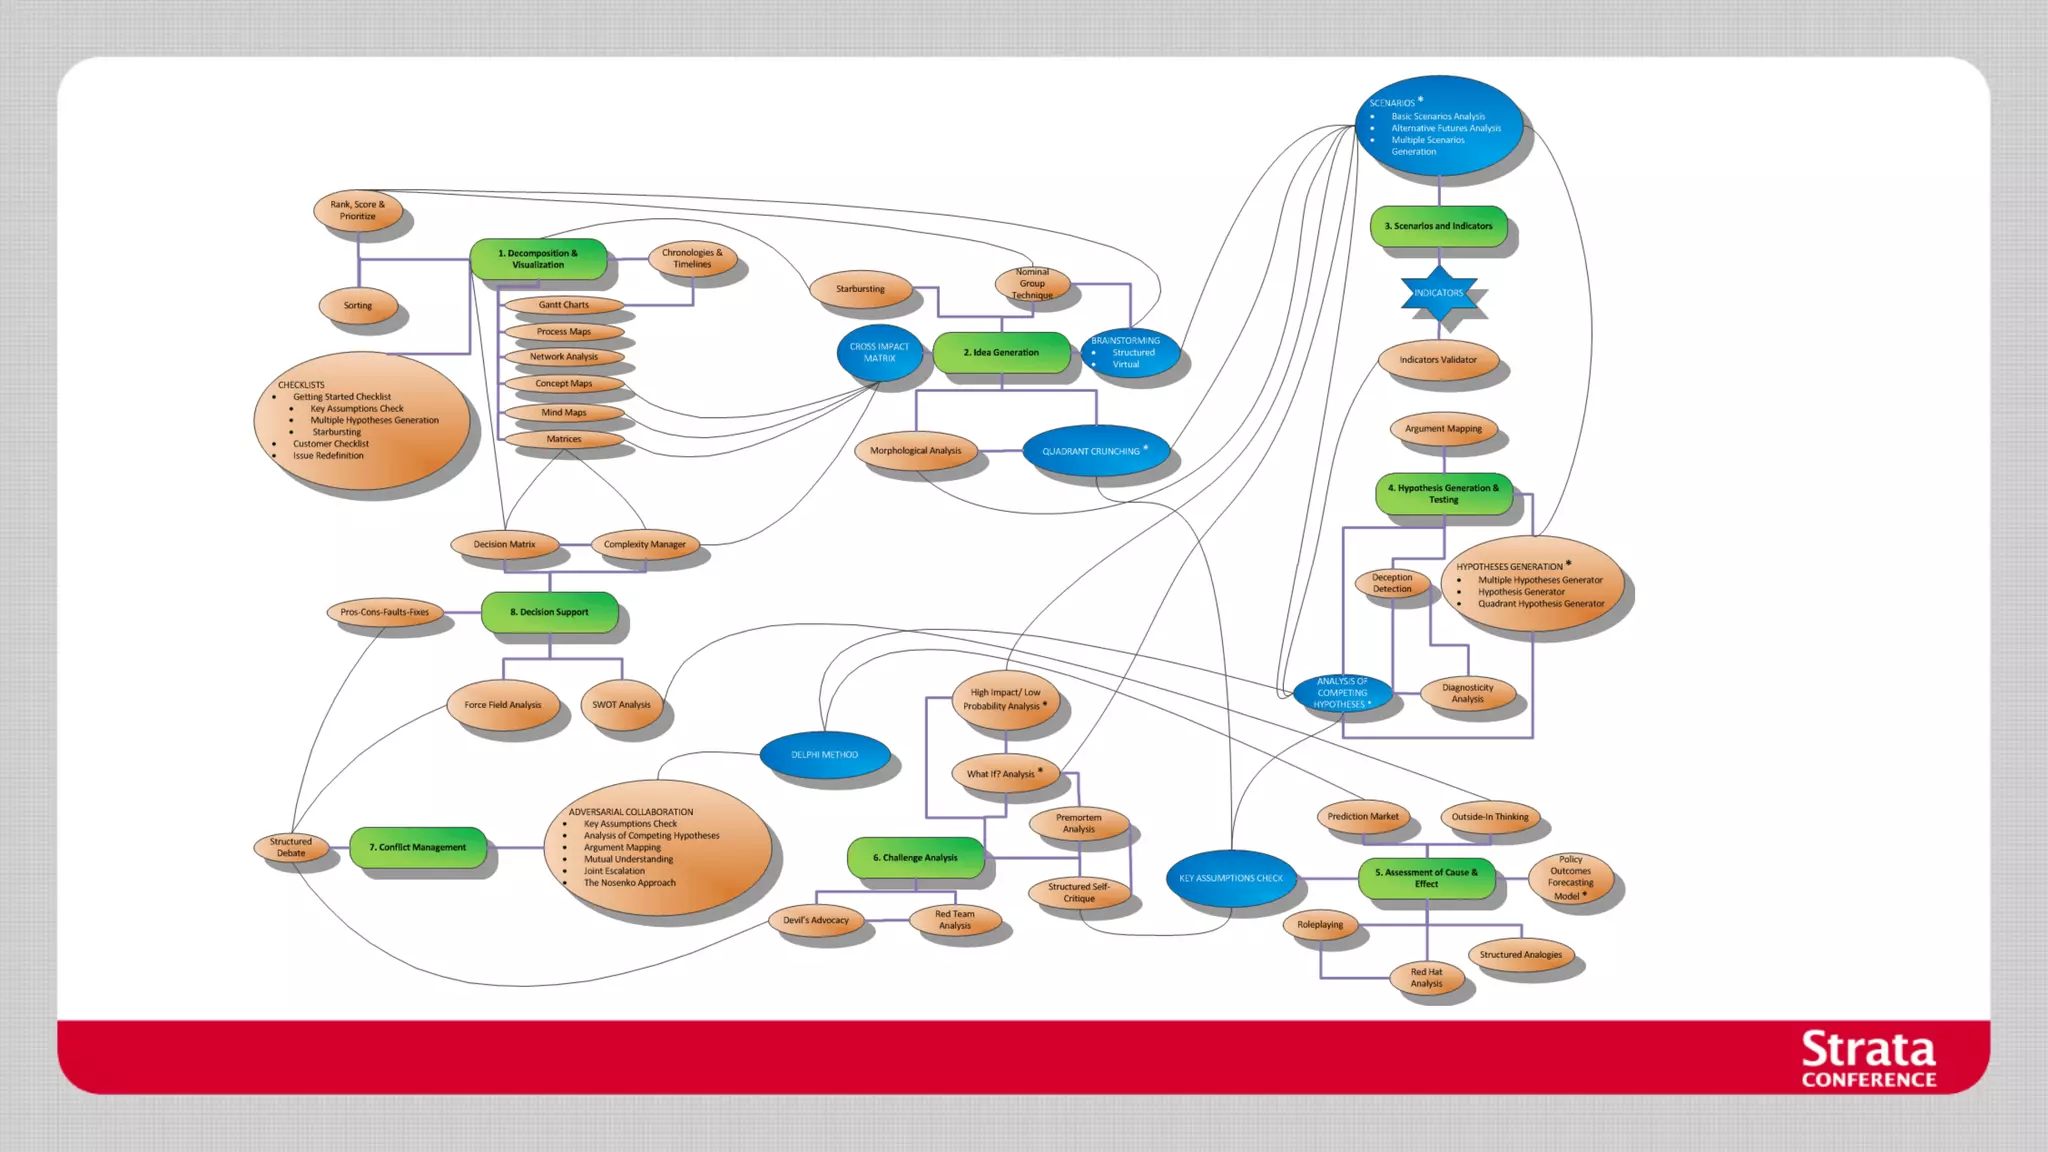
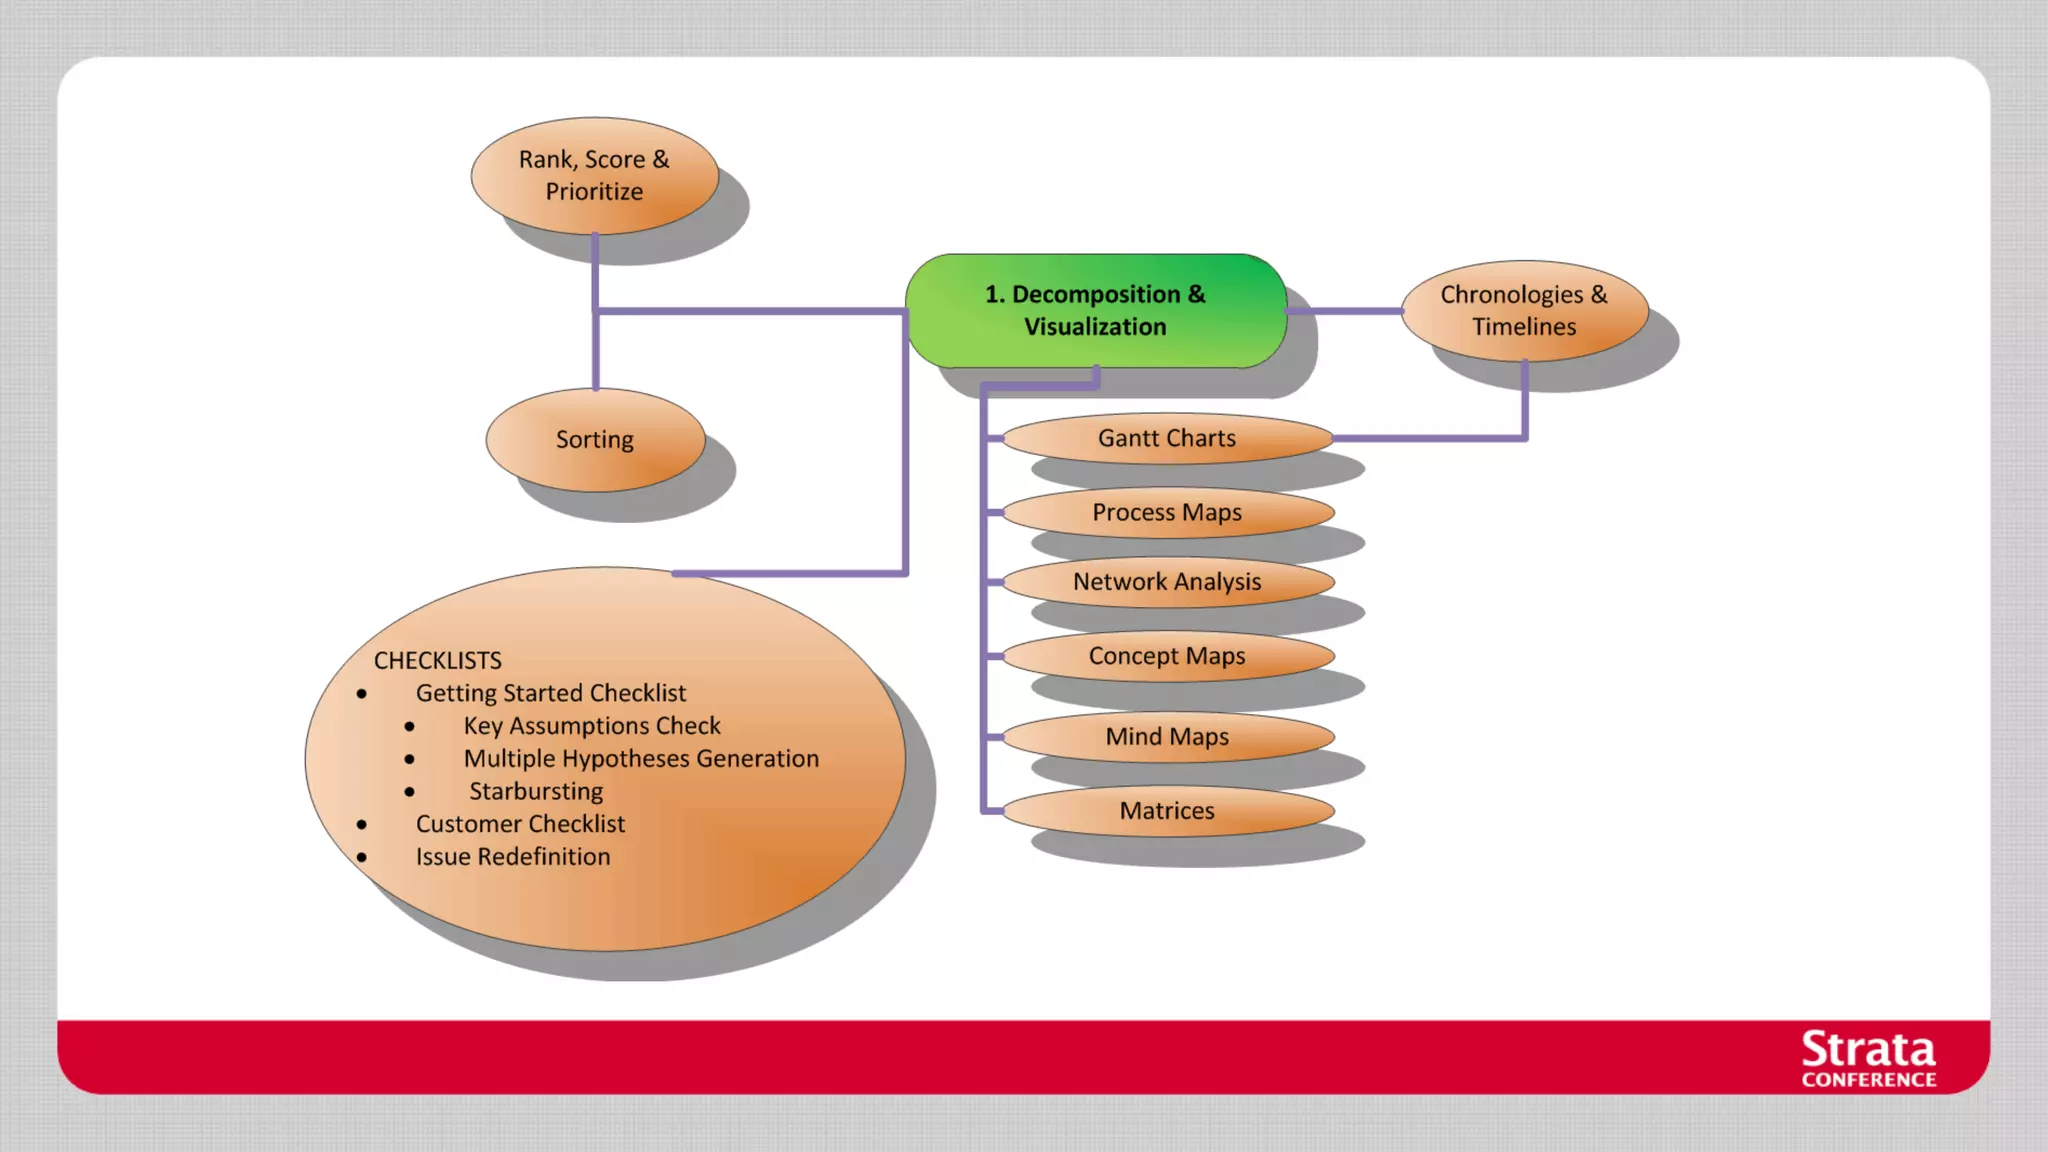
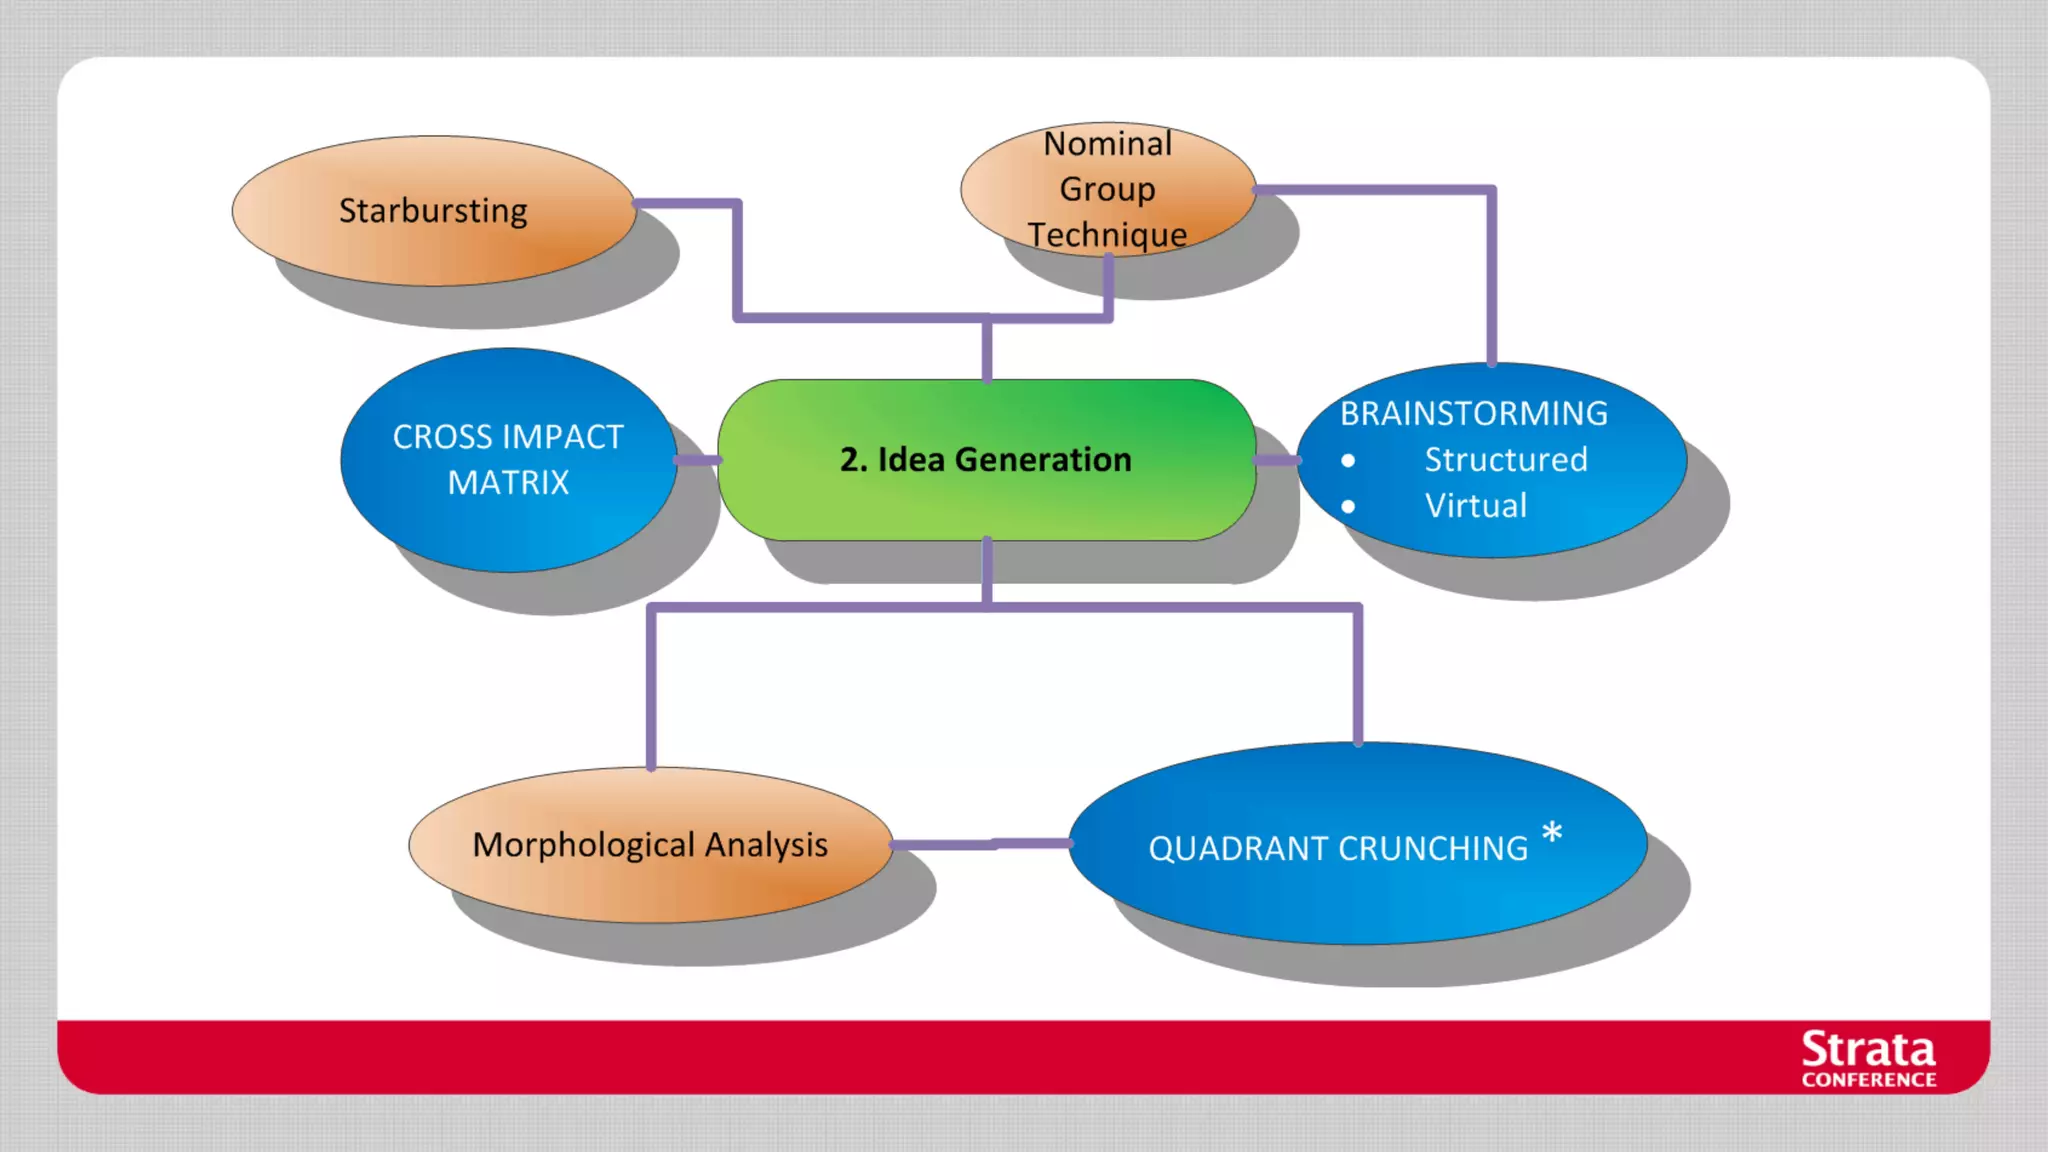
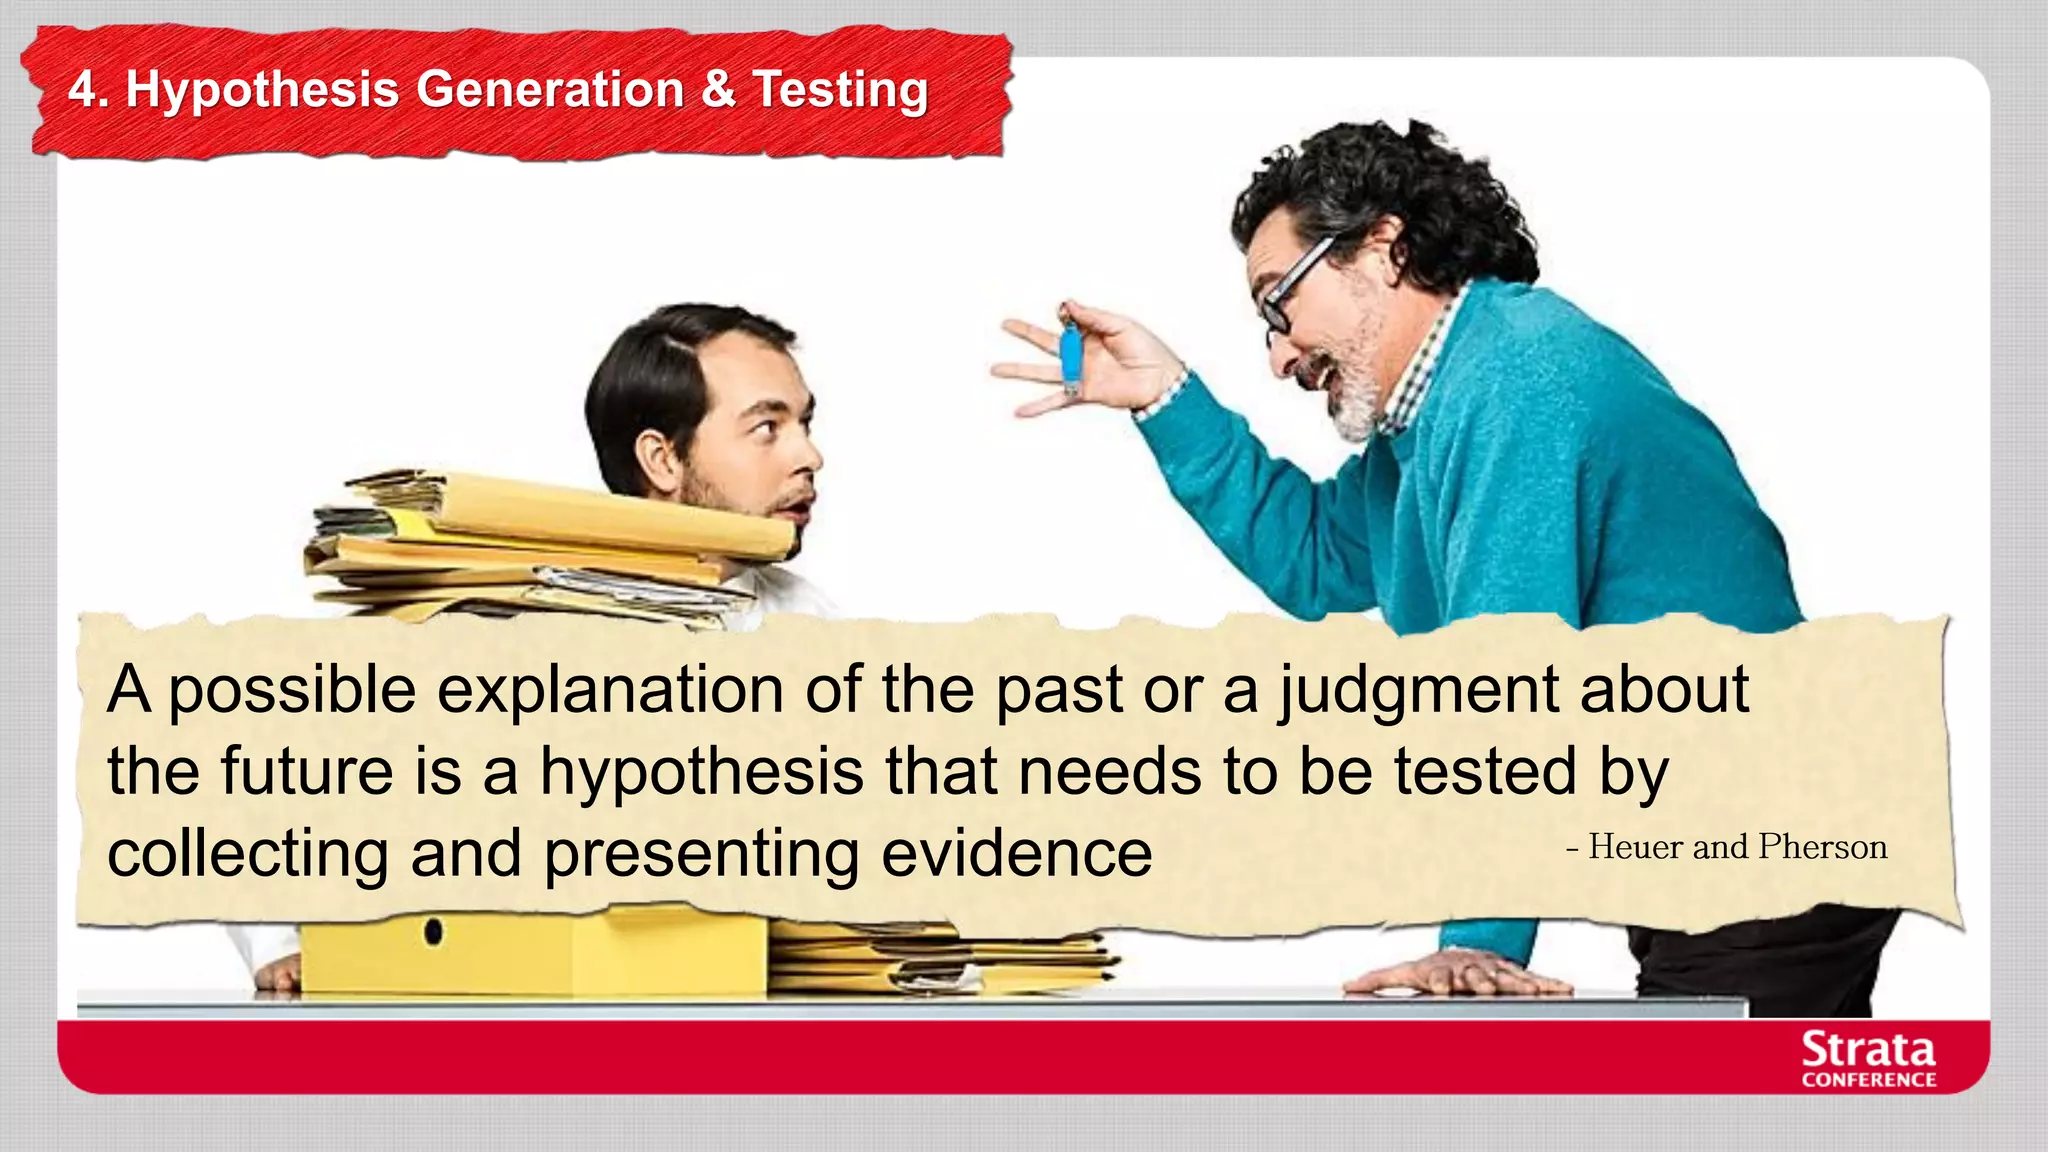
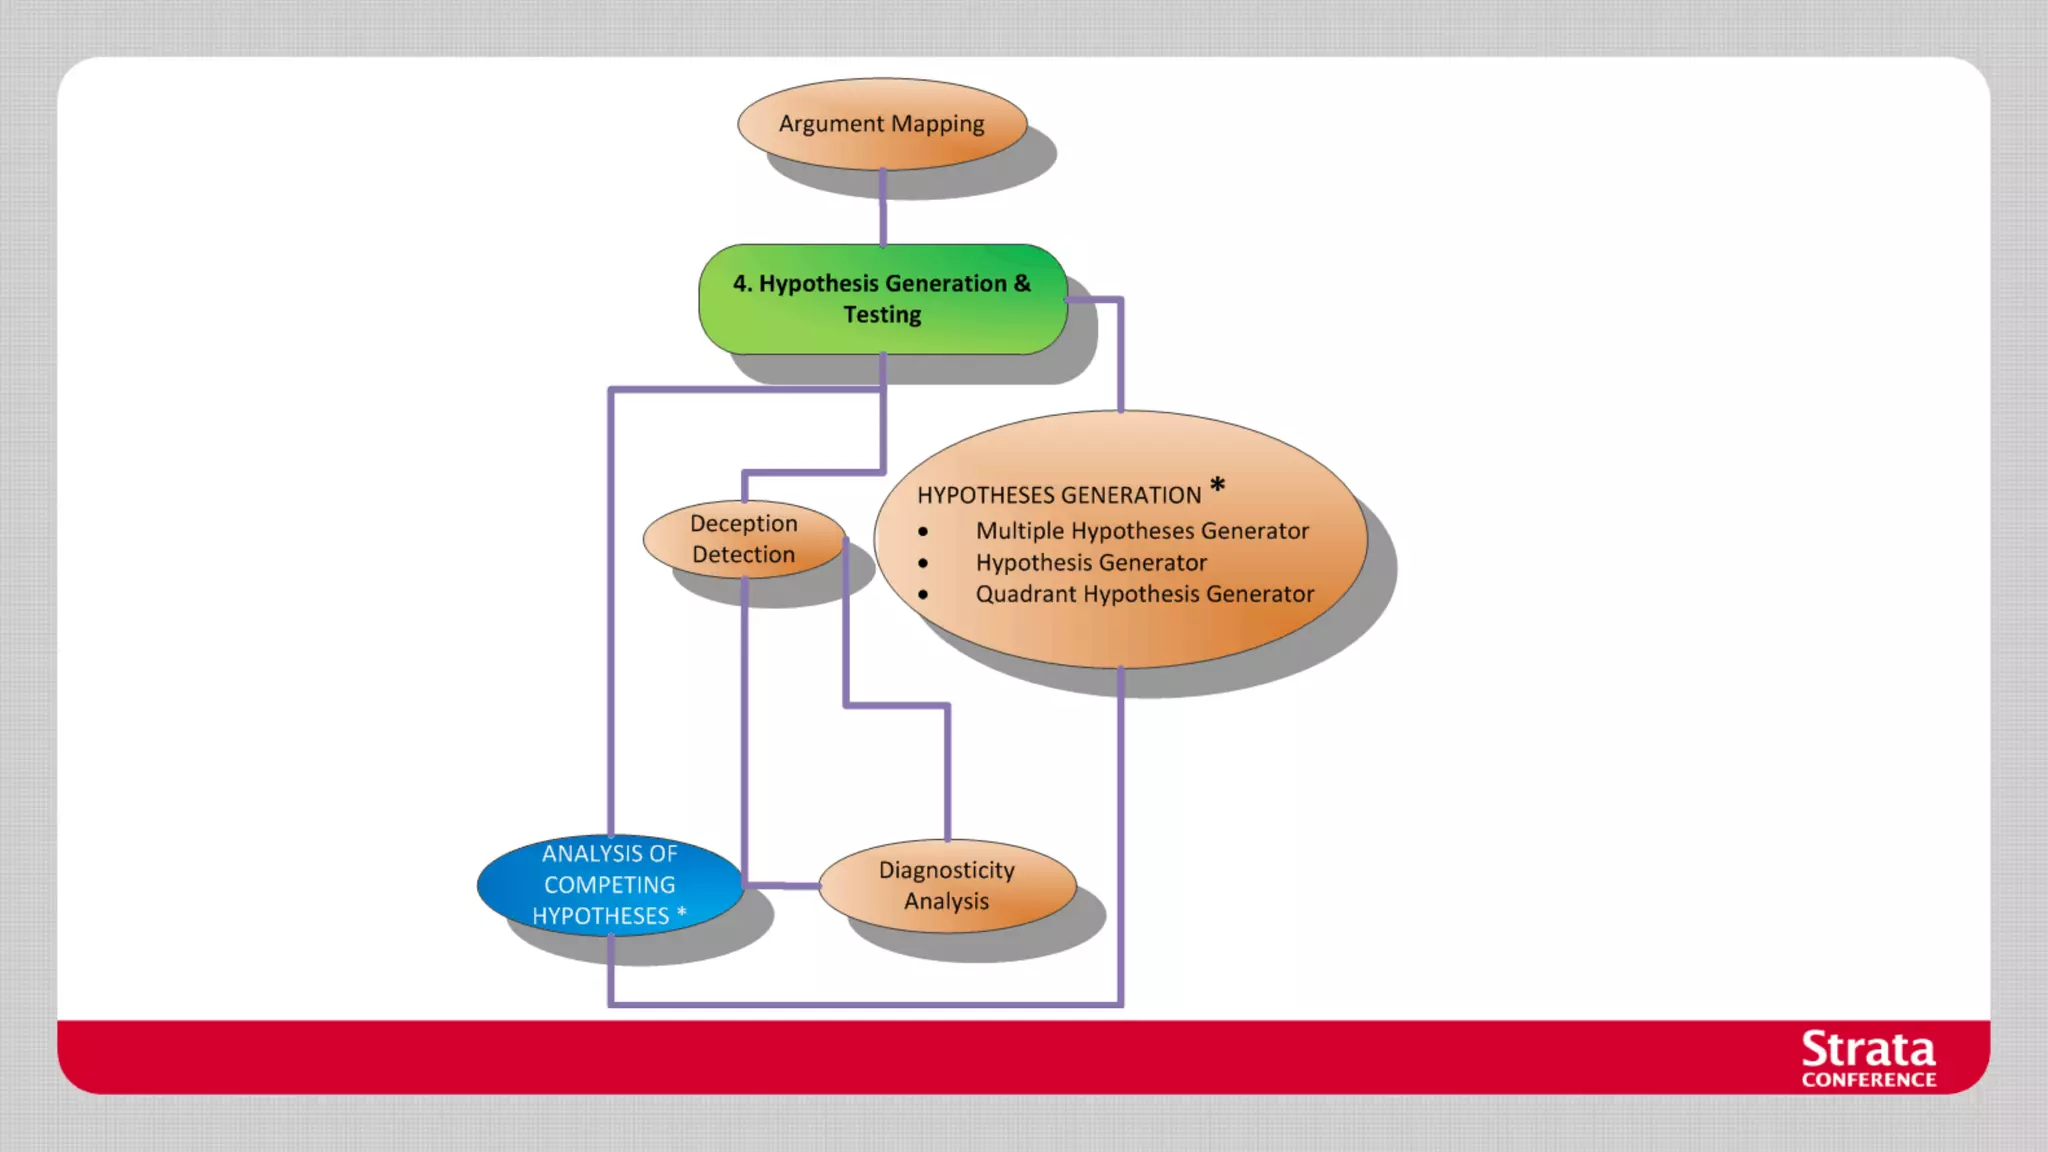
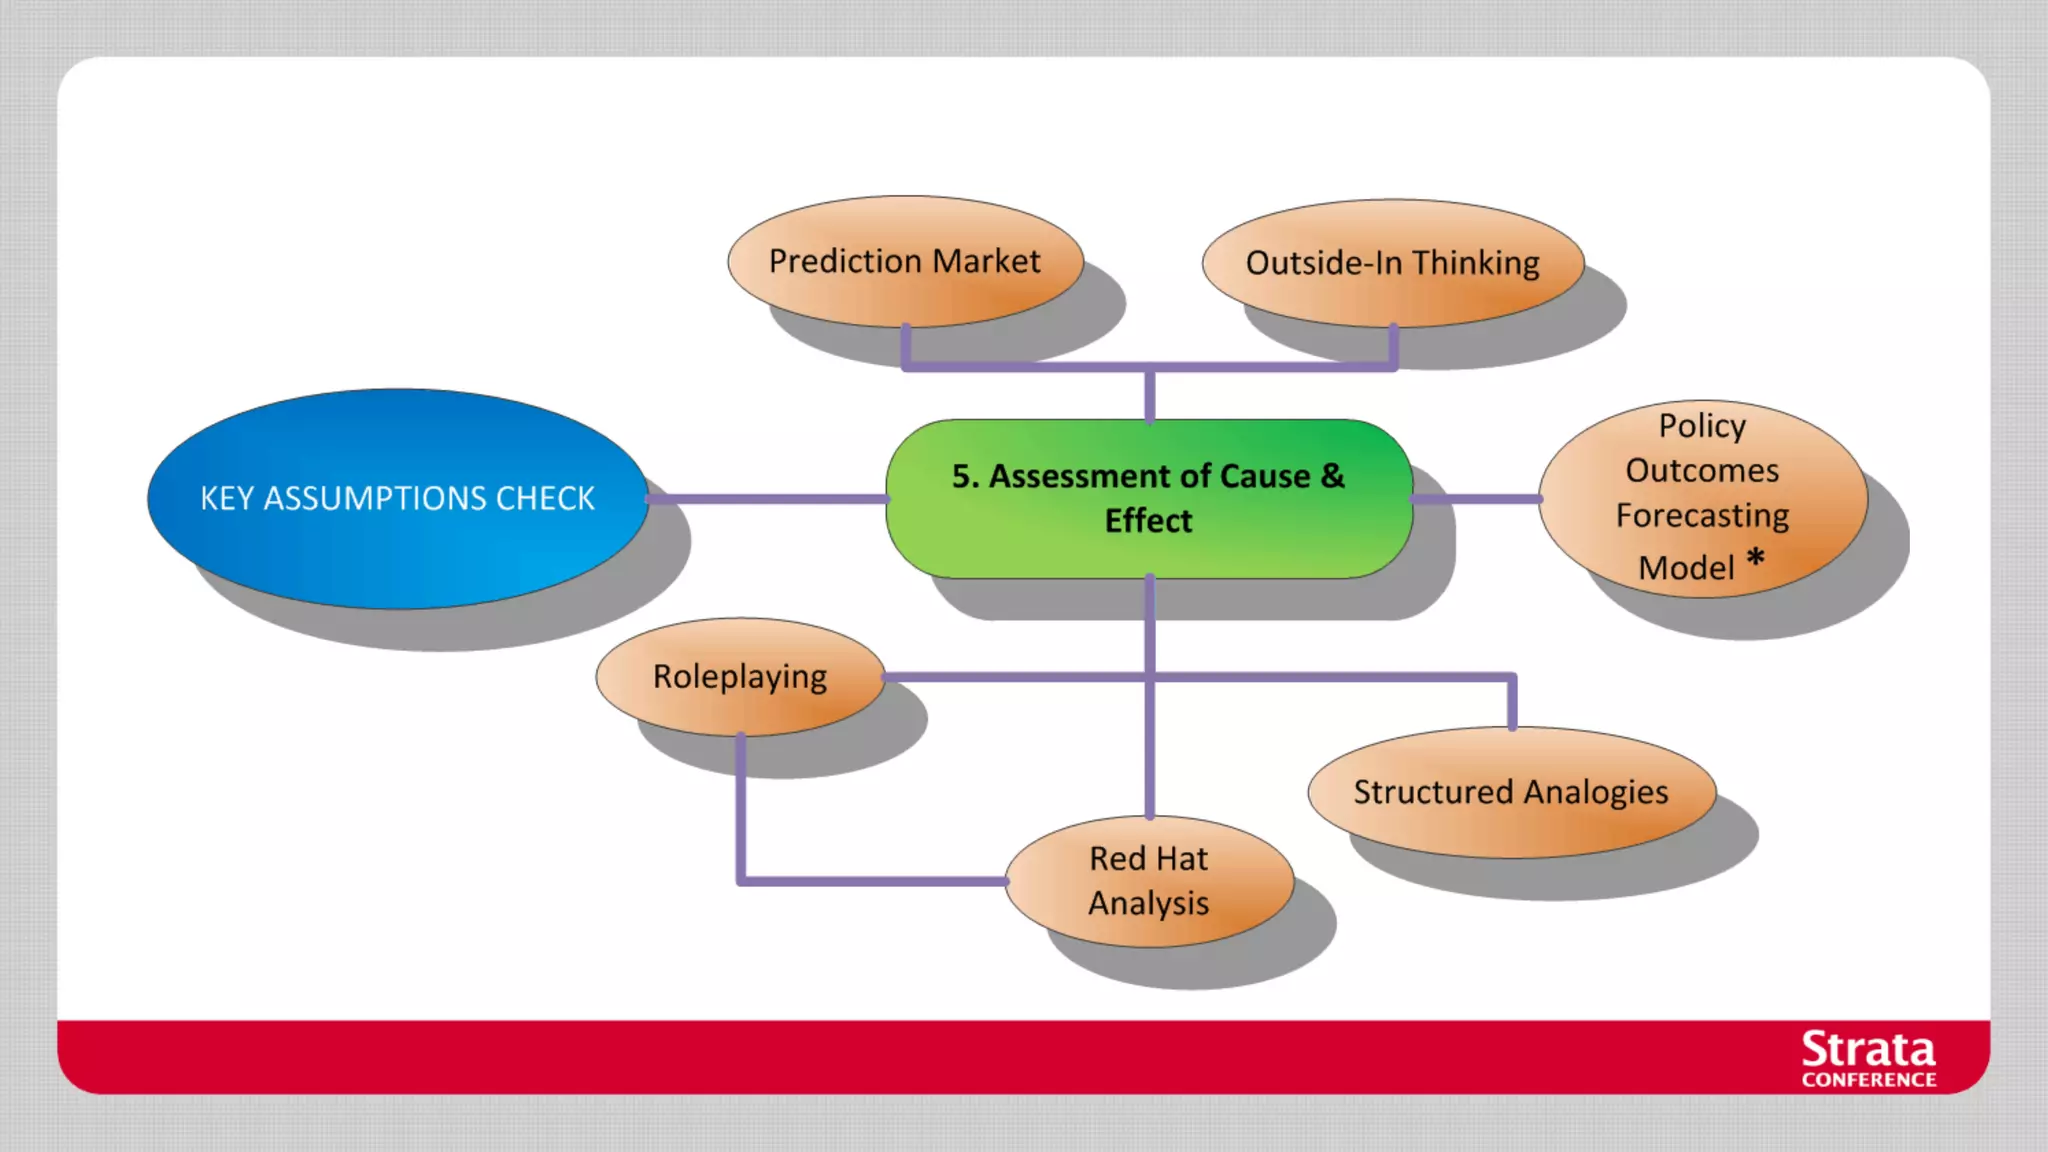
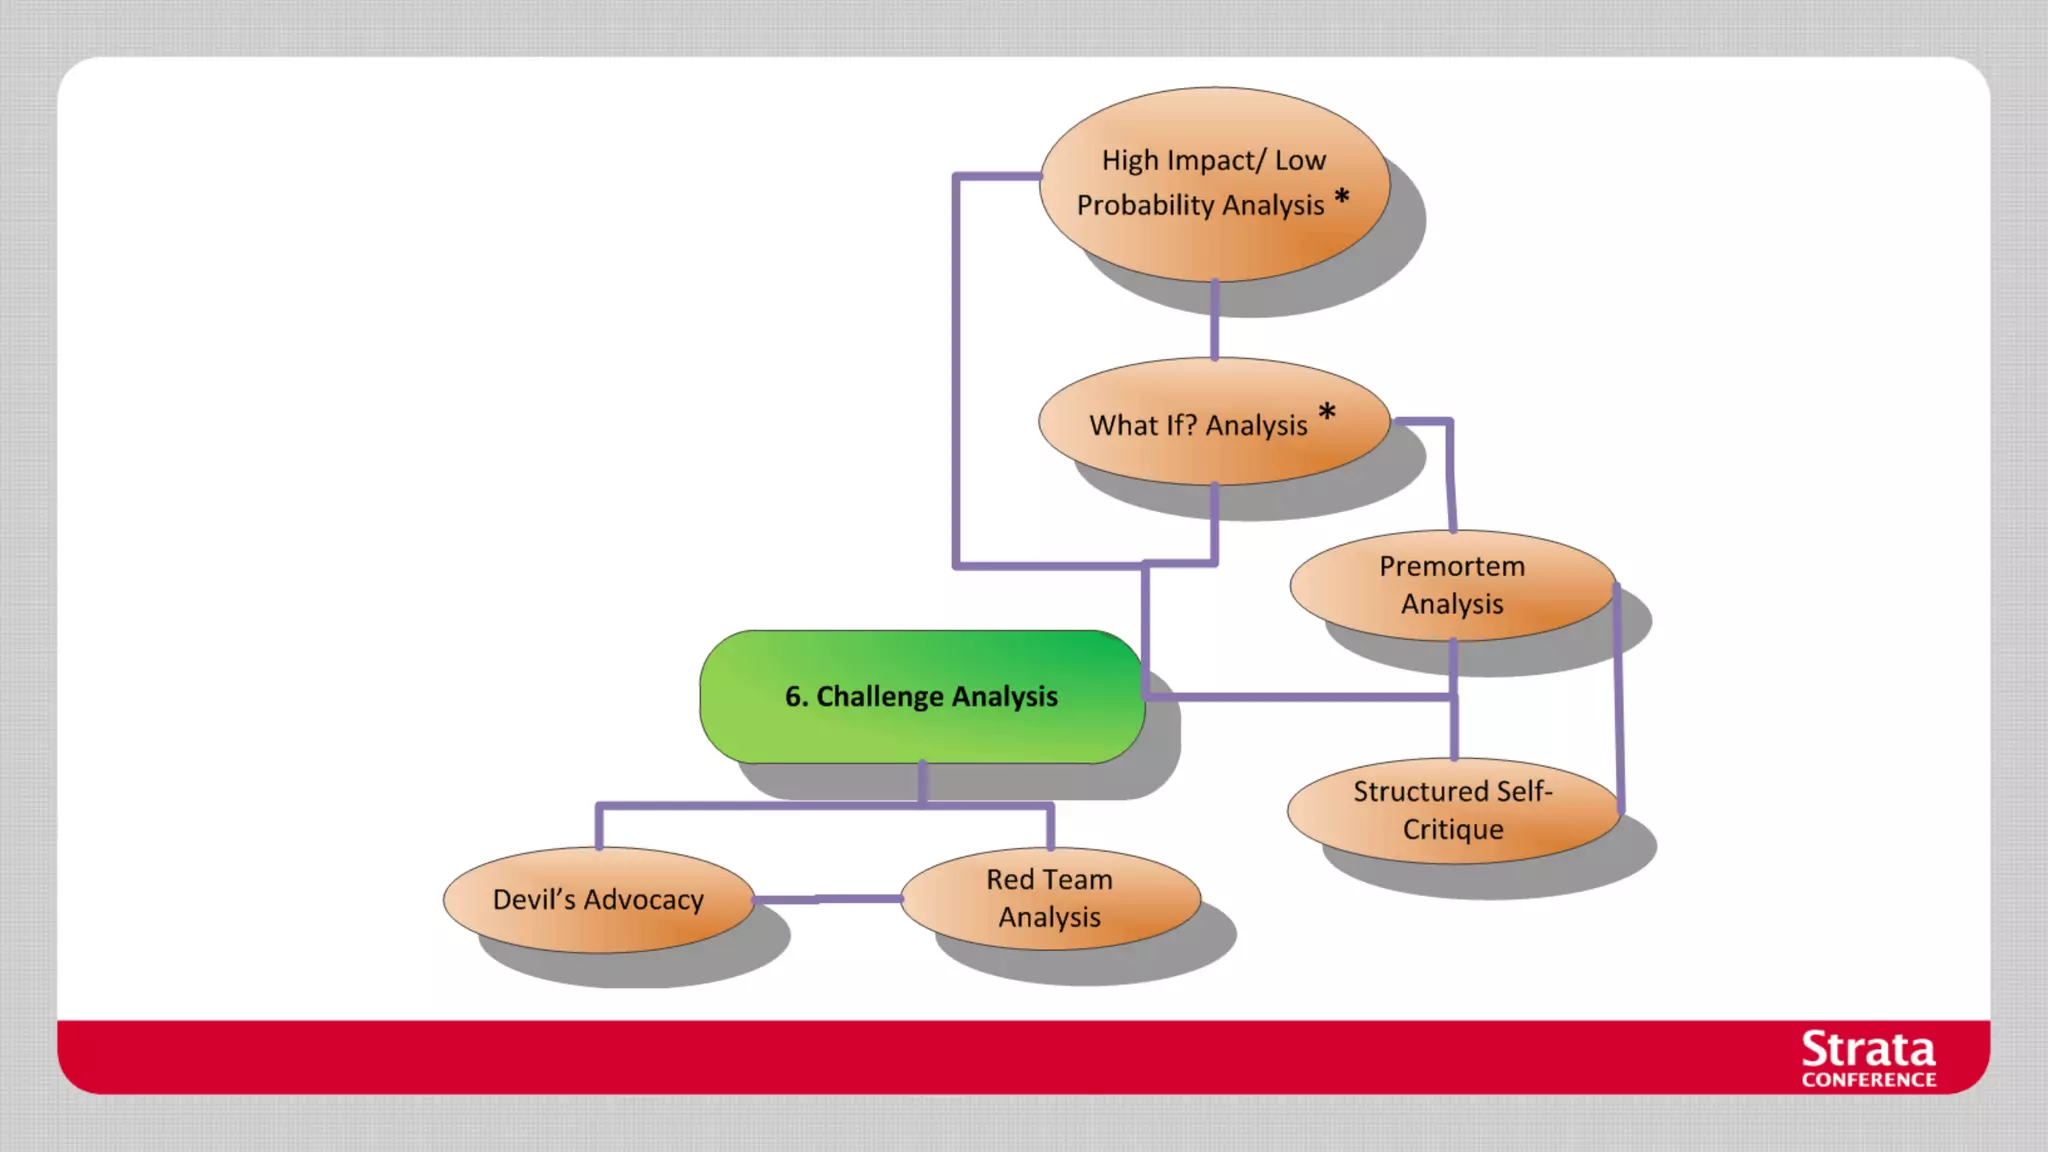
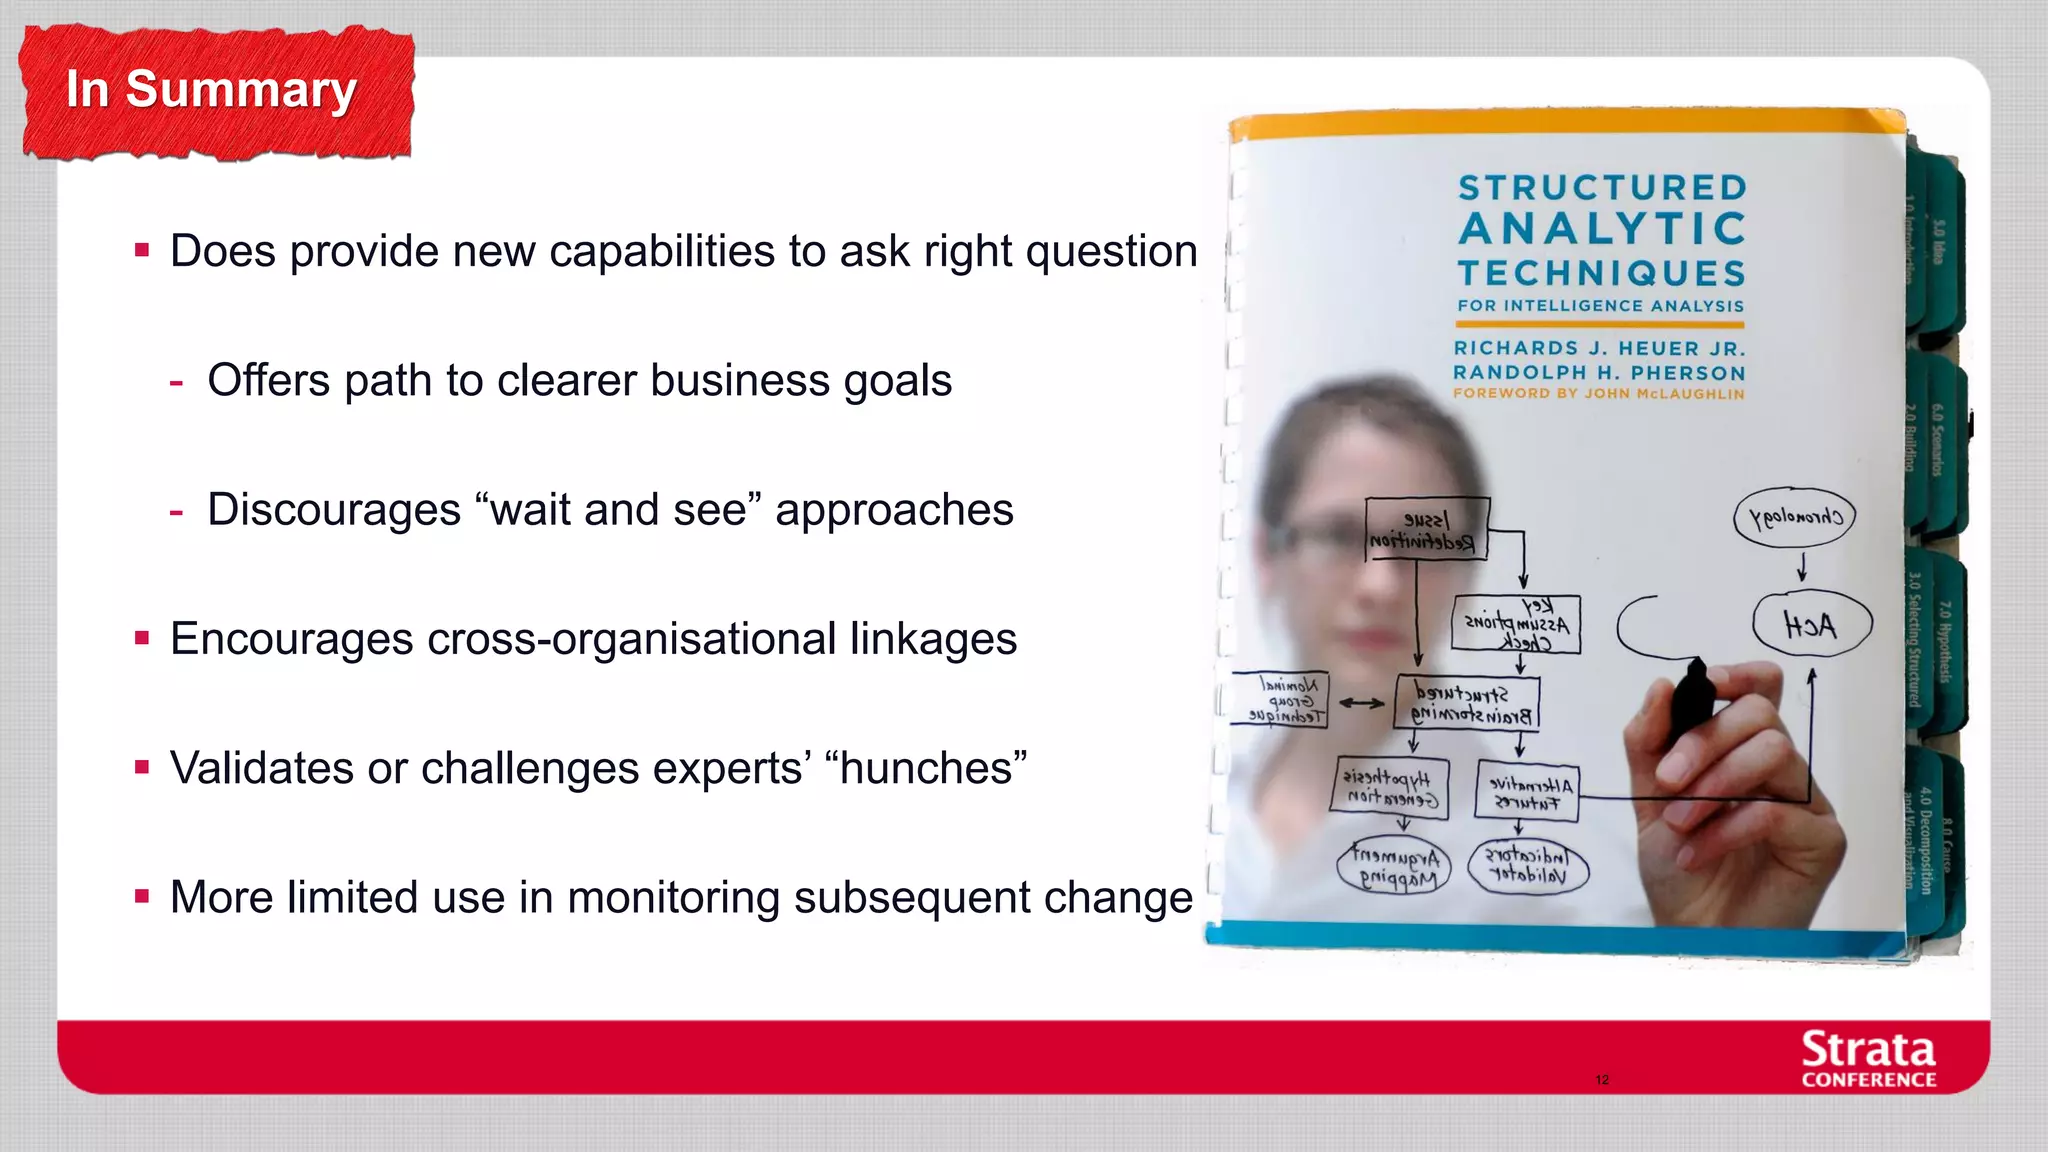
The document discusses various approaches organizations can take to gain insights from data. It begins by noting that making data work is difficult and that value is captured through outputs and outcomes. It then describes three common approaches: the "all in" approach of fully committing resources, the experimental approach of running small trials, and the "wait and see" approach. The document advocates for an experimental approach using agile experimentation. It provides examples of areas where organizations need to improve such as asking the right questions, choosing technologies, and interpreting results. Finally, it discusses various analytic methods and structured techniques that can be used, including decomposition and visualization, hypothesis generation and testing, and challenge analysis.
Giving Organisations new capabilities to ask the right business questions 1.7OReillyStrata
This presentation takes the seminal work structured analytic techniques work pioneered within US intelligence, and proposes adaptions and simplifications for use within commercial enterprises
The Softer Skills Analysts need to make an impactPaul Laughlin
25 min presentation given at London Business School, to the OR Society's Analytics Network. Summarising Laughlin Consultancy's 9 step model of Softer Skills for Analysts.
Framework for creating Analytics that delivers cost effective Value. From what to output, to how to scale and motivate a team, passing through data acquisition. Analytics has become a critical asset for the most competitive organizations; practitioners must ensure their ability to create and communicate insight, especially the most senior decision-makers is effective and efficient.
Measuring and managing customer profitability in the big-data era. How to capitalize on the opportunity.
In today's era of Big Data and related technology, the benefits of "customer-centricity" are within our reach. Analysis of Big Data sources helps to better understand customer needs, preferences, attitudes, expectations, sentiments, and buying behavior. Yet to achieve this potential, organizations need to understand and apply the classic but essential concepts of customer profitability, customer lifetime value (CLV), and customer value management analytics. Join us for an event on how to approach this challenge.
When linked with customer profitability metrics, these insights enable more profitable decisions in product design, sales, marketing, customer care, loyalty management, and risk management. This session will help attendees capitalize on this opportunity. We will cover the classic high-impact basics of measuring and managing customer profitability, customer lifetime value (CLV), as well as how to use new Big Data insights to get more value from these efforts. This tutorial which cover the topic in 5 practical steps:
1. Introduction to Customer Profitability Analytics: What is customer profitability analysis, why is it so valuable, and what are the key concepts and methodologies used to measure customer profitability, customer lifetime value (CLV), and related metrics?
2. High-Impact Use-Cases of Customer Profitability Analytics: What are the key ways customer profitability analytics is used enhance results? We will describe the highest-value ways to use customer profitability metrics to improve business results, with concrete examples in each of the following categories:
o Customer Lifetime Value optimization ("CLV")
o Customer loyalty and retention
o Share of wallet maximization
o Marketing ROI
o Impact of Customer Service, Customer Experience, and Customer Satisfaction on Profit
o Product design, pricing, promotion, and positioning
o Allocation of resources (capital, budget, HR, etc)
o Risk management
3. How to Calculate Profitability at the Customer Level : We will walk through the algorithms you need to use to turn raw data into customer profitability metrics, and share tips on how to customize them depending on your business. Related applications will also be covered, such as how to use the same algorithms to measure profit per household, salesperson, distributor, or other entity relevant to how your business makes money.
4. Data & Tech Requirements
5. Using Big Data to Maximize ROI on Customer Analytics: What are the top 5 opportunities to use Big Data to increase the benefits achieved through customer profitability analytics and related initiatives?
Speakers: Jaime Fitzgerald, Founder and Managing Partner, Fitzgerald Analytics, and Konrad Kopczynscki, Director at Fitzgerald Analytics. Konrad and Jaime have applied customer profitability methodologies to dozens of clients.
Lean Business Intelligence - How and Why Organizations Are Moving to Self-Ser...FindWhitePapers
Learn why and how enterprises are moving to self-service business intelligence (BI). Find out how to get the right data now, while maintaining information quality and operational security. By reviewing requirements and specific use cases for a controlled self-service BI application, Forrester identifies five key findings that can transform your business.
Highlights of the Business Analytics seminar by Gary Cokins from October 21, 2014 presentation with Illinois CPA Society.
Gary Cokins is an internationally recognized expert, speaker, and author in performance improvement systems and cost management.
http://www.GaryCokins.com
Governing the Data to Dollars Value Chain™ - Sept 2012 NYC Data Governance Co...Fitzgerald Analytics, Inc.
Data is the ultimate intangible asset: worthless is raw form, yet priceless when used well. Financial services companies depend on analytics to transform troves of data into business advantage, insight, and profits. Yet the ugly secret is that most analytics project fail to achieve their full potential, leaving millions of dollars in potential profits on the table.
One of the most important steps in a predictive analytic effort is correctly framing the problem a way that creates a shared understanding of the business problem across business, IT and analytics teams. A decision requirements model makes it clear how to best leverage analytics. Watch the webinar recording at http://decisionmanagement.omnovia.com/archives/223762
Predictive analytic models are not new within many analytical organizations. However, the use of predictive analytics is growing rapidly. Data-driven decision-making initiatives are compelling more and more enterprises to move their analytics efforts beyond the basics. Enterprises must go from measurement and reporting to predictions and decision management. With ever-increasing amounts of historical data ready for mining, the right predictive analytic models can help an enterprise understand future behavior – adherence to medical prescriptions, increased or decreased spending, loan repayment, and more. By driving better decision-making, such insights can be transformative. Join us as we look into best-practices for building a predictive enterprise, technology tips for using and implementing predictive analytics tools, and guidelines for building predictive models.
14 mistakes or learning of my analytics journeykumar Saurabh
Recently, I was invited to imarticus.org's Bangalore branch to deliver a guest lecture on Analytics for its students. The session was around going through last 5 years of professional journey in advance analytics area to consolidate my key learnings and share with students. Would love to blog in detail on this topic someday with free time. However, Sharing the deck which I shared with students as of now
Design Thinking Applied for the Tax departmentRene Saracho
DESIGN THINKING applied to the Tax department.
In the past few years, the role of the Tax function has been rapidly changing, to driving strategy as compared to its earlier compliance-based role. The Tax department has a vast base of internal customers, across its functions areas such as legal, finance, operations, supply chain, and business areas a whole.
With rapid digital transformation taking place for the front end systems, the Tax departments need to embrace new methodologies like Design thinking for Tax processes, to understand the art of the possible, and to keep pace with process efficiencies and effectiveness, required in today’s environment.
So, how can a Tax department bring a spark of new life and thinking to its team with Design Thinking and leverage it to drive innovation and growth?
Some thoughts on this theme are consolidated in this presentation. Hope it helps you to learn a bit about its proposition/values and to reflect on the probability of its application/deployment in your Tax department.
How to Build an HR Analytics Center of ExcellenceAPEX Global
Using analytics to turn data into insights regularly provides strategic advantage to all areas of organizations, from marketing to supply chain management and finance.
The formation of an HR Analytics Center of Excellence can enable firms to derive strategic insights from workforce data and justify the investments made in HR programs and technology.
resentation design is a tricky creative process- You might even call it an art. If you get it right and create a great presentation, you're far more likely to achieve your goals – whether that's selling more or helping people see your point of view. Hence, storyboarding your PowerPoint presentation is a surefire way to make sure that it covers the key points and hits the mark.
It started with comic books and the film industry, and now storyboarding has a place in every executives repertoire of skills. Take a look and give this a shot!
Connecting Data and Experience: How Decision Management WorksInside Analysis
Hot Technologies with Rick Sherman, Wayne Eckerson and FICO
Live Webcast April 30, 2014
Watch the archive:
The need to adapt quickly only continues to increase. Decision cycles can no longer span weeks and months, but must occur in days or even hours. Traditional methods for managing data cannot fulfill this business requirement. Rather, organizations must embrace new technologies and practices for accessing, processing and delivering not just data, but also analytical models. In doing so, they will achieve a level of decision management that can fundamentally transform how their business works.
Register for this episode of Hot Technologies to hear veteran Analysts Rick Sherman of Athena IT Solutions, and Wayne Eckerson of Eckerson Group, as they give their insights on how today's analytics leaders are solving serious challenges by connecting data and experience. They'll be briefed by David Ross of FICO, who will outline his firm's recent innovations in turning analytical insights into actionable strategies that deliver results faster. He'll outline how FICO is leveraging the spectrum of data available today, including business intelligence systems and a wide range of Big Data sources.
Visit InsideAnlaysis.com for more information.
How we built our community using Github - Uri CohenOSCON Byrum
The journey of GigaSpaces as a company in building the Cloudify open source product, what worked and what didn't and how it used Github as the platform for not just hosting the code
Solving the Wanamaker Problem for Healthcare (keynote file)Tim O'Reilly
Finding a solution to Wanamaker's complaint, "Half of my advertising doesn't work, I just don't know which half" fueled the consumer internet revolution. We are now in the process of finding and solving a similar dilemma in healthcare. I offer some lessons from Silicon Valley for Healthcare
Obtaining, Scrubbing, and Exploring Data at the Command Line by Jeroen Janssens Hakka Labs
Data scientists love to create exciting data visualizations and insightful models. However, before they get to that point, usually much effort goes into obtaining, scrubbing, and exploring the required data. In this presentation, Jeroen Janssens from YPlan,gives insight into the *nix command line. Although it was invented decades ago, it remains a powerful environment for many data science tasks. It provides a read-eval-print loop (REPL) that is often much more convenient for exploratory data analysis than the edit-compile-run-debug cycle associated with scripts or even programs. Even if you're already comfortable processing data with, for example, R or Python, being able to also leverage the power of the command line can make any data scientist more efficient.
Présentation d'Iñaki Errazkin Vittoria, Ministre de l'environnement de la province de Gipuzkoa (pays basque espagnol), réalisée le 1er février 2014 à l'occasion du lancement du mouvement Zero Waste France par le Cniid.
Tahseen Consulting’s Work on Knowledge-based Economies in the Arab Word is Ci...Wesley Schwalje
The United Nations University’s Maastricht Economic and Social Research Institute on Innovation and Technology cited Tahseen Consulting's Wes Schwalje's research on knowledge-based economies in analyzing knowledge transfer in the MENA countries.
Finite State Machines are overlooked at best, ignored at worst, and virtually always dismissed. This is tragic since FSMs are not just about Door Locks (the most commonly used example). On the contrary, these FSMs are invaluable in clearly defining communication protocols – ranging from low-level web-services through complex telephony application to reliable interactions between loosely-coupled systems. Properly using them can significantly enhance the stability and reliability of your systems.
Join me as I take you through a crash-course in FSMs, using erlang’s gen_fsm behavior as the background, and hopefully leaving you with a better appreciation of both FSM and erlang in the process.
TOC Bologna 2012: How to Receive Funding and Support for New Digital and Prin...OReillyTOC
In the panel we will look at funds and grants available for new and current publishing ventures. The panel will discuss how small to medium size children’s publishers can receive funding for translated co editions and new digital publishing projects. Advice on how to combine the craft of print publishing with the new challenges of digital delivery with be shared with the participants. The panel will be able to share some really useful tips and offer guidance for those planning new ventures and wanting to make the most of new digital funds from across the world to support their activities.
Speakers: Charles Beckett, Agnes Vogt. Moderated by Neal Hoskins
Beyond Shuffling, Tips and Tricks for Scaling Apache Spark updated for Spark ...Holden Karau
Beyond Shuffling - Tips & Tricks for scaling your Apache Spark programs. This talk walks through a number of common mistakes which can keep our Spark programs from scaling and examines the solutions, as well as general techniques useful for moving from beyond a prof of concept to production. It covers topics like effective RDD re-use, considerations for working with key/value data, and finishes up with an introduction to one of Spark's newest features: Datasets.
Le bilan mobilité permet au bénéficiaire de pouvoir faire un bilan de compétences et d’acquérir les techniques de recherche d’emploi adaptées à son projet professionnel.
C’est une démarche libre et volontaire du bénéficiaire. Elle peut être proposée par l’entreprise dans le cadre d’une mobilité interne ou d’un départ de l’entreprise.
معماری مبتنی بر سرویس، اصول و اجزا
این مبحث یکی از فناوری هایی است که در درس مهندسی فناوری اطلاعات 2 برای دانشجویان مهندسی فناوری اطلاعات ارائه می دهم.
Operationalizing Customer Analytics with Azure and Power BICCG
Many organizations fail to realize the value of data science teams because they are not effectively translating the analytic findings produced by these teams into quantifiable business results. This webinar demonstrates how to visualize analytic models like churn and turn their output into action. Senior Business Solution Architect, Mike Druta, presents methods for operationalizing analytic models produced by data science teams into a repeatable process that can be automated and applied continuously using Azure.
In the recent past, we have learnt that data is the lifeline of any business and it is really important to collect data, more and more of it. But no one is telling us what to do with large volumes of data.
Shailendra has successfully delivered over One Billion Dollars in incremental value and will spend 30 minutes in showcasing how many large organisations are using data to their advantage by creating value through generating incremental revenue and optimising costs using analytics techniques.
Key Takeaways:
(i) Demystify the myths of analytics
(ii) Walkthrough a step-by-step approach to delivering successful projects that created an incremental value of hundreds and millions of dollars.
(iii) Three use cases where large organisations are using analytics to their advantage by creating value by generating incremental revenue and optimising costs.
SharePoint "Moneyball" - The Art and Science of Winning the SharePoint Metric...Susan Hanley
Measurement is not just about looking for a bottom-line result to justify investments. It’s also a tool to provide feedback about where the organization is along the road to successfully leveraging investments in SharePoint and the business outcomes it provides. At every stage in the development of your solution, metrics provide a valuable means for focusing attention on desired behaviors and results. This presentation showcases a practical and realistic framework for SharePoint metrics based on real world examples and successes.
The best companies boost revenues by not just building advanced pricing analytics programs but also developing relevant capabilities - people, processes, tools. A successful revenue growth program is a journey, and this presentation highlights the four areas where companies need to focus to become leaders. Brian Elliott (CEO of McKinsey Periscope) gave a version of this presentation at the Professional Pricing Society event in Oct., 2014.
Marcus Baker: People Analytics at Scale
People Analytics Conference 2022 Winter
Website: https://pacamp.org
Youtube: https://www.youtube.com/channel/UCeHtPZ_ZLZ-nHFMUCXY81RQ
FB: https://www.facebook.com/pacamporg
Data Science - Part I - Sustaining Predictive Analytics CapabilitiesDerek Kane
This is the first lecture in a series of data analytics topics and geared to individuals and business professionals who have no understand of building modern analytics approaches. This lecture provides an overview of the models and techniques we will address throughout the lecture series, we will discuss Business Intelligence topics, predictive analytics, and big data technologies. Finally, we will walk through a simple yet effective example which showcases the potential of predictive analytics in a business context.
Dealing with Uncertainty: What the reverend Bayes can teach us.OReillyStrata
By Jurgen Van Gael - http://jvangael.github.io/ - @jvangael
As data scientists and decision makers, uncertainty is all around us: data is noisy, missing, wrong or inherently uncertain. Statistics offers a wide set of theories and tools to deal with this uncertainty, yet most people are unaware of a unifying theory of uncertainty. In this talk I want to introduce the audience to a branch of statistics called Bayesian reasoning which is a unifying, consistent, logical and most importantly successful way of dealing with uncertainty.
Over the past two centuries there have been many proposals for dealing with uncertainty (e.g. frequentist probabilities, fuzzy logic, ...). Under the influence of early 20th century statisticians, the Bayesian formalism was somewhat pushed into the background of the statistical scene. More recently though, some to the credit of computer science, Bayesian thinking has seen a revival. So what and how much should a data scientist or decision maker know about Bayesian thinking?
My talk will consist of four different parts. In the first part, I will explain the central dogma of Bayesian thinking: Bayes Rule. This simple equation (4 variables, one multiplication and one division!) describes how we should update our beliefs about the world in light of new data. I will discuss evidence from neuroscience and psychology that the brain uses Bayesian mechanism to reason about the world. Unfortunately, sometimes the brain fails miserably at taking all the variables of Bayes rule into account.
This leads to the second part of the talk where I will illustrate Bayes rule as a tool for decision makers to reason about uncertainty.
In the third part of the talk I will give an example of how we can build machine learning systems around Bayes rule. The key idea here is that Bayes rule allows us to keep track of uncertainty about the world. In this part I will illustrate one a Bayesian machine learning system in action.
In the final part of the talk I will introduce the concept of “Probabilistic Programming”. Probabilistic programming is a new embryonic programming paradigm that introduces “uncertain variables” as a first class citizen of a programming language and then uses Bayes rule to execute the programs.
When we look at machine learning conferences in the last few years, the Bayesian framework has been prominent. In this talk I want to help the audience understand how the Bayesian framework can help them in their data mining and decision making processes. If people leave the talk thinking Bayes rule is the E=MC^2 of data science, I will consider the presentation a success.
PDF of presentation given by John Cain, Sheldon Monteiro, Thomas McLeish for Strata London 2013: Using big data to understand the mobile in-store shopping experience.
Digital analytics & privacy: it's not the end of the worldOReillyStrata
This presentation starts by revisiting the common best practices related to digital analytics in order to measure digital asset’s effectiveness to increase conversion, common data feeds between tools and possibly data flows between continents for analysis.
These practices are then put in parallel with legal requirements, showing which steps need to be undertaken to assure legal compliance of said practices, how digital responsibles should be trained in data protection matters and what contracts are needed with both data providers & collectors so as to assure minimal liability for these routinely undertaken tasks.
This presentation is NOT about security and goes beyond the over-blown cookie debate in order to highlight how the upcoming EU Personal Data Protection Regulation will influence digital analytics to hopefully start embracing Privacy by Design ways of working.
Data as an Art Material. Case study: The Open Data InstituteOReillyStrata
The Open Data Institute (ODI) sees the creative use of data as an intrinsic and essential part of our cultural landscape. As part of it’s ongoing operations, the it has an Art Programme committed to facilitating artists in the exhibition and creation of works which translate data into something that is meaningful to people’s lives.
Artists use data as an art material in many ways: materialising them physically, sonifying them to amplify natural phenomena, coalescing them to create new realities. They question how objective the treatment of data is, and how much truth do we expect from an artwork with statistical roots? And we are asked to consider whether it matters. If we accept that there is dogma in the artists code, do we accept that it plays a part in other code too?
Often at the critical edge of technological debate, artists are redefining how we perceive data and how it affects and reflects our lives. This presentation will showcase art curated for the on-going Data as Culture programme, from concept through the development process to the final work, and present findings on how the art programme has impacted the ODI, its visitors and its staff. By Julie Freeman
Big Data for Big Power: How smart is the grid if the infrastructure is stupid?OReillyStrata
Introducing the concept of SLEx (Substation Life Extension) and Intelligent Sensing at teh Edge when it comes to Smart Grid activities. This is a novel concept on truly using sensors to extend substation life, and then dealing with the Big Data that has just been introduced by using state of the art sensing technology. Both SLEx and Intelligent Sensing at the Edge are concepts that have been introduced by Brett Sargent who is CTO and VP/GM of Products at an innovative sensor company located in Silicon Valley.
Hadoop is commonly used for processing large swaths of data in batch. While many of the necessary building blocks for data processing exist within the Hadoop ecosystem – HDFS, MapReduce, HBase, Hive, Pig, Oozie, and so on – it can be a challenge to assemble and operationalize them as a production ETL platform. This presentation covers one approach to data ingest, organization, format selection, process orchestration, and external system integration, based on collective experience acquired across many production Hadoop deployments.
Designing Big Data Interactions: The Language of DiscoveryOReillyStrata
Looking deeper than the celebratory rhetoric of information quantity, at its core, Big Data makes possible unprecedented awareness and insight into every sphere of life; from business and politics, to the environment, arts and society. In this coming Age of Insight, ‘discovery’ is not only the purview of specialized Data Scientists who create exotic visualizations of massive data sets, it is a fundamental category of human activity that is essential to everyday interactions between people, resources, and environments.
To provide architects and designers with an effective starting point for creating satisfying and relevant user experiences that rely on discovery interactions, this session presents a simple analytical and generative toolkit for understanding how people conduct the broad range of discovery activities necessary in the information-permeated world.
Specifically, this session will present: • A simple, research-derived language for describing discovery needs and activities that spans domains, environments, media, and personas • Observed and reusable patterns of discovery activities in individual and collaborative settings • Examples of the architecture of successful discovery experiences at small and large scales • A vocabulary and perspective for discovery as a critical individual and organizational capability • Leading edge examples from the rapidly emerging space of applied discovery • Design futures and concepts exploring the possible evolution paths of discovery interactions
Digital Reasoning_Tim Estes_Strata NYC 2012OReillyStrata
This is Tim Estes', CEO of Digital Reasoning, keynote speech for Strata NYC 2012. In this presentation, Tim makes the case that Big Data is less about data and more about people. It is about positively affecting the lives of those around us through the moral application of technology.
This comprehensive program covers essential aspects of performance marketing, growth strategies, and tactics, such as search engine optimization (SEO), pay-per-click (PPC) advertising, content marketing, social media marketing, and more
Exploring Career Paths in Cybersecurity for Technical CommunicatorsBen Woelk, CISSP, CPTC
Brief overview of career options in cybersecurity for technical communicators. Includes discussion of my career path, certification options, NICE and NIST resources.
New Explore Careers and College Majors 2024.pdfDr. Mary Askew
Explore Careers and College Majors is a new online, interactive, self-guided career, major and college planning system.
The career system works on all devices!
For more Information, go to https://bit.ly/3SW5w8W
Want to move your career forward? Looking to build your leadership skills while helping others learn, grow, and improve their skills? Seeking someone who can guide you in achieving these goals?
You can accomplish this through a mentoring partnership. Learn more about the PMISSC Mentoring Program, where you’ll discover the incredible benefits of becoming a mentor or mentee. This program is designed to foster professional growth, enhance skills, and build a strong network within the project management community. Whether you're looking to share your expertise or seeking guidance to advance your career, the PMI Mentoring Program offers valuable opportunities for personal and professional development.
Watch this to learn:
* Overview of the PMISSC Mentoring Program: Mission, vision, and objectives.
* Benefits for Volunteer Mentors: Professional development, networking, personal satisfaction, and recognition.
* Advantages for Mentees: Career advancement, skill development, networking, and confidence building.
* Program Structure and Expectations: Mentor-mentee matching process, program phases, and time commitment.
* Success Stories and Testimonials: Inspiring examples from past participants.
* How to Get Involved: Steps to participate and resources available for support throughout the program.
Learn how you can make a difference in the project management community and take the next step in your professional journey.
About Hector Del Castillo
Hector is VP of Professional Development at the PMI Silver Spring Chapter, and CEO of Bold PM. He's a mid-market growth product executive and changemaker. He works with mid-market product-driven software executives to solve their biggest growth problems. He scales product growth, optimizes ops and builds loyal customers. He has reduced customer churn 33%, and boosted sales 47% for clients. He makes a significant impact by building and launching world-changing AI-powered products. If you're looking for an engaging and inspiring speaker to spark creativity and innovation within your organization, set up an appointment to discuss your specific needs and identify a suitable topic to inspire your audience at your next corporate conference, symposium, executive summit, or planning retreat.
About PMI Silver Spring Chapter
We are a branch of the Project Management Institute. We offer a platform for project management professionals in Silver Spring, MD, and the DC/Baltimore metro area. Monthly meetings facilitate networking, knowledge sharing, and professional development. For event details, visit pmissc.org.
NIDM (National Institute Of Digital Marketing) Bangalore Is One Of The Leading & best Digital Marketing Institute In Bangalore, India And We Have Brand Value For The Quality Of Education Which We Provide.
www.nidmindia.com
2. Making Data Work is Hard
Value Captured
Outputs
Outcomes
Sales Growth
Profit Growth
Sales Growth to Existing
Customers
Product Performance
Technology
Leadership
New Customers
Process
Improvement
Effective Project Execution
Processes
Inputs
Balanced Innovation
Portfolio
Supportive Strategy,
Structure, & Systems
Partners’
Value-add
Employee
Commitment to
Innovation
Quality of Innovation
Pipeline
Access to Talent
3. The “All In” Approach
Ron Johnson, CEO
Myron Ullman, CEO
4. You start out thinking you have a sales problem but might find
it is not really sales but marketing or customer retention...
…you could spent a lot of time on analysis that doesn’t lead to
solving the right problem.”
5. The Experimental Approach
"We did a Hadoop trial last year, it didn't go very far
because we weren't getting the intelligence out of it
that we thought we would. So we are looking at some
other initiatives with different vendors this year.
"We tried to put three different data sets together, and
then tried to see if we could find some causality
between the data sets that would gives us intelligence
that would allow us to manage our operations better…
"Whether that was how we set the trial up or the
software I don't know, so we are going to try
some different things.”
6. The “Wait and See” Approach
Incumbents are rarely disrupted by new technologies they can't
catch up to, but instead by new business models they can't match.
Institutions will try to preserve the problem to which they are
the solution.
7. Satisficing
Can rarely evaluate all outcomes with sufficient precision
Usually don’t know relevant probabilities of outcomes
Possess limited memory
9. Obtaining new insights
Business
Strategy
We need to make
sure that we’re
asking people to
research the right
questions
Domain
Expertise
Company Systems
& Data
And then we iterate to improve the
insight gained, or address the next
business question…
Data Mining
Agile
Experimentation
We need to choose the
right storage technologies,
integration services &
architecture
Sourcing
We need to look in
many more places to
find data…
Extraction
…and it will take a lot of
different skills and
approaches to bring it
together
We need to perform analysis
quickly inside small projects,
with a specific business goal.
Some of these will fail.
We need to be careful to
curb our enthusiasm and
separate out the signal
from the noise
Interpretation
Implementation
We need simple, easy to
use production tools to act
upon the new insights.
Authority needs to be
delegated to where the
information is captured
Visualisation
We need new techniques to
interpret and manipulate vast
numbers of data points on a
single surface
12. Analytic Methods
Decomposition &
Visualisation
Idea Generation
Expert Judgment
Scenarios & Indicators
Quantitative
Methods using
Expert-Generated
Data
Quantitative
Methods using
Empirical Data
Hypothesis Generation
& Testing
Assessment of
Cause & Effect
Challenge Analysis
Conflict Management
Structured Analysis
Decision Support
14. Structured Analysis
a step by step process for analyzing the kind of
incomplete, ambiguous and sometimes deceptive
information that analysts must deal with.
17. Choosing what you want to do
1. Define the
project?
2. Get started?
Decomposition & Visualisation
3. Examine & make
sense of the data?
Figure out what is
going on?
Idea Generation
Scenarios & Indicators
4. Assess the most
likely outcome of an
evolving situation?
5. Monitor a
situation to avoid
surprise?
6. Generate and test
hypotheses?
Hypothesis Generation
& Testing
Assessment of
Cause & Effect
7. Assess the
possibility of
deception?
8. Foresee the
future?
9. Challenge your
own mental model?
Challenge Analysis
Conflict Management
10. See events from
the perspective of
other players?
11. Managing
conflicting mental
models or
opinions?
12. Support a
manager in
deciding course of
action?
Decision Support
21. 1. Decomposition & Visualisation
When forced to work within a strict framework the imagination
is taxed to its utmost – and will produce its richest ideas.
Given freedom the work is likely to sprawl.
22.
23. Value Proposition
Understand your clients’ needs at the finest level of detail
Client micro-segmentation using multiple sources of data
Description
FOR marketing operations
WHO want to understand the growth potential for each identified customer subdivision
THE understand your clients’ needs at the finest level of detail solution
PROVIDES understanding of the root causes for your current share of each identified slice
THAT lets you act on the information quickly with targeted retail product placement & location selling
UNLIKE your existing solution
WHICH is coarse-grained and retrospective
Scenarios
•
•
•
•
•
Retail product placement & location selling
Counteracting effectiveness of competitors
Understanding local reputation via ”voice of the customer”
Real-time decision making such as mobile-based coupon positioning to particular segments
Partner organisations’ service effectiveness
26. Creativity
Value Creation
Out-of-box thinking
In-the-box thinking
Raw & refined ideas
Experimentation
Engineering/process
improvement
Ambiguity/uncertainty
Precision
Research
Well-calculated trade-offs
Intuition
Buying/selling of ideas
Surprise
Do things right
Courage
Answer questions & verify
solutions
Find the right things
Ask questions & explore
unknown innovation
Seize opportunities
Visualize future & consider
all options
Include incremental &
radical ideas
Avoid major risks
Get product into the
marketplace
Bias for incremental
27. Cross Impact Matrix
For when “Everything is connected to everything else”
Business is in flux
Context for discussion of interactions
System is stable
Discover variables once thought to be simple
- Need to identify and monitor all
factors that might upset this
A significant event has occurred
- Need to understand implications
& independent are actually interrelated
Focus on
- Interactions that may have been overlooked
- Variables that might reinforce each other
28. Cross Impact Matrix
A
B
C
C. Existing core banking solutions
D. Apps & Cloud Service interaction
E
F
++ ++
A. Personalised Interactions
B. Existing mobile solutions
D
--- ++
+ -
E. Offers
++
F. Analytics
++
-
+
+
++
++
++
29. 3. Scenarios & Indicators
Scenarios are plausible &
provocative stories about how
the future might unfold
30.
31. Indicators
Observable Phenomena that can periodically be reviewed to help track events
Make humans recognize early signs
significant change
Spot emerging trends
Quality indicators are critical
- If narrowly defined or out of date
- Reinforce bias
- Warn unanticipated changes
- Discard new evidence
- Avoid surprise
- Lull people inappropriately
Forward looking, predictive
Objective baseline for tracking
- Dashboards…
Indicators Validator
Instil rigour into analytic process
- Quality and strength of indicator
Enhance credibility of what delivered
- Whether appears in all scenarios
Exchange knowledge between experts
from different domains
32. Indicators
2013
Q4
Q3
Mobile Offers
Reaching right segment
People engaged
Volunteering information
Infrastructure
Holding initiative back
Cloud
Security, regulatory, compliance
Service
Take-up standard services
3rd party composing new apps
Industry Trends
Personalised CRM
Branded Currency
Device as Bank
Ecosystem
Retailers using your backbone
Competitive launches
Q1
□
●
▫
□
▫
▫
□
○
○
○
Q2
●
▪
□
▫
▫
Q1
●
▪
□
●
▫
Q4
2015
Q3
□
●
□
●
□
□
Q2
2014
Q3
Neglible concern
Low concern
Moderate
Substantial
Strong
▫
▪
□
○
●
Q4
33. 4. Hypothesis Generation & Testing
A possible explanation of the past or a judgment about
the future is a hypothesis that needs to be tested by
collecting and presenting evidence
34.
35. 5. Assessment of Cause & Effect
We are slow to accept the reality
of simple mistakes, accidents,
unintended consequences,
coincidences, or small causes
leading to large effects
36.
37. Personalised Interactions will increase: Key Assumptions check
Legal and privacy – Caveated.
Components available across entire chain – Caveated.
Customers want seamless, personally relevant services – Solid
Devices will progress sufficiently – Solid
Analytics techniques are sufficiently refined, accurate and timely – Caveated
Back-end systems will support workload – Solid
Systems will be cost effective – Caveated. What’s the ROI of something you don’t know?
Employees trained and authority delegated to act – Unsupported
38. 6. Challenge Analysis
It is the mark of an educated mind to be able to entertain a
thought without accepting it.
39.
40. Pre-mortem analysis
Imagine the future where your plan has been implemented, but has failed
Advantages:
Take people out of perspective of
defending their plan & shielding
themselves from its flaws
Increase level of candour
Can be used to show decision makers
that are typically over-confident that
their decisions and plans will work
Questions re-framed, to elicit different
responses to original ones
Legitimises dissent – asked to make a
positive contribution by identifying
weaknesses in previous analysis
Examples
- Internal inertia or uneven execution
- Competitors’ actions
- Law of unintended consequences
- Economic changes
41.
42. 7. Conflict Management
Disagreements sparked by differences in perspective, competencies,
& access to information… actually generate much of the value that can
come from collaboration across organisational boundaries.
http://hbr.org/2005/03/want-collaboration-accept-and-actively-manage-conflict
43.
44. 8. Decision Support
…without overstepping the limits of their role…; just structures all the
relevant information in a format that makes it easier for the decision
maker to make a choice.
45.
46. A word on Dashboards
It is also unfortunate to see how many business intelligence
and enterprise data warehousing projects get waylaid by the
singular pursuit of pretty dashboards…
49. Self-Inflicted Complexity
When we sacrifice dealing with detail complexity to
focus on dynamic complexity, the solutions don’t
produce the outcomes that we really want.
http://blogs.hbr.org/2013/09/our-self-inflicted-complexity/
50. In Summary
Does provide new capabilities to ask right questions
- Offers path to clearer business goals
- Discourages “wait and see” approaches
Encourages cross-organisational linkages
Validates or challenges experts’ “hunches”
More limited use in monitoring subsequent change
12