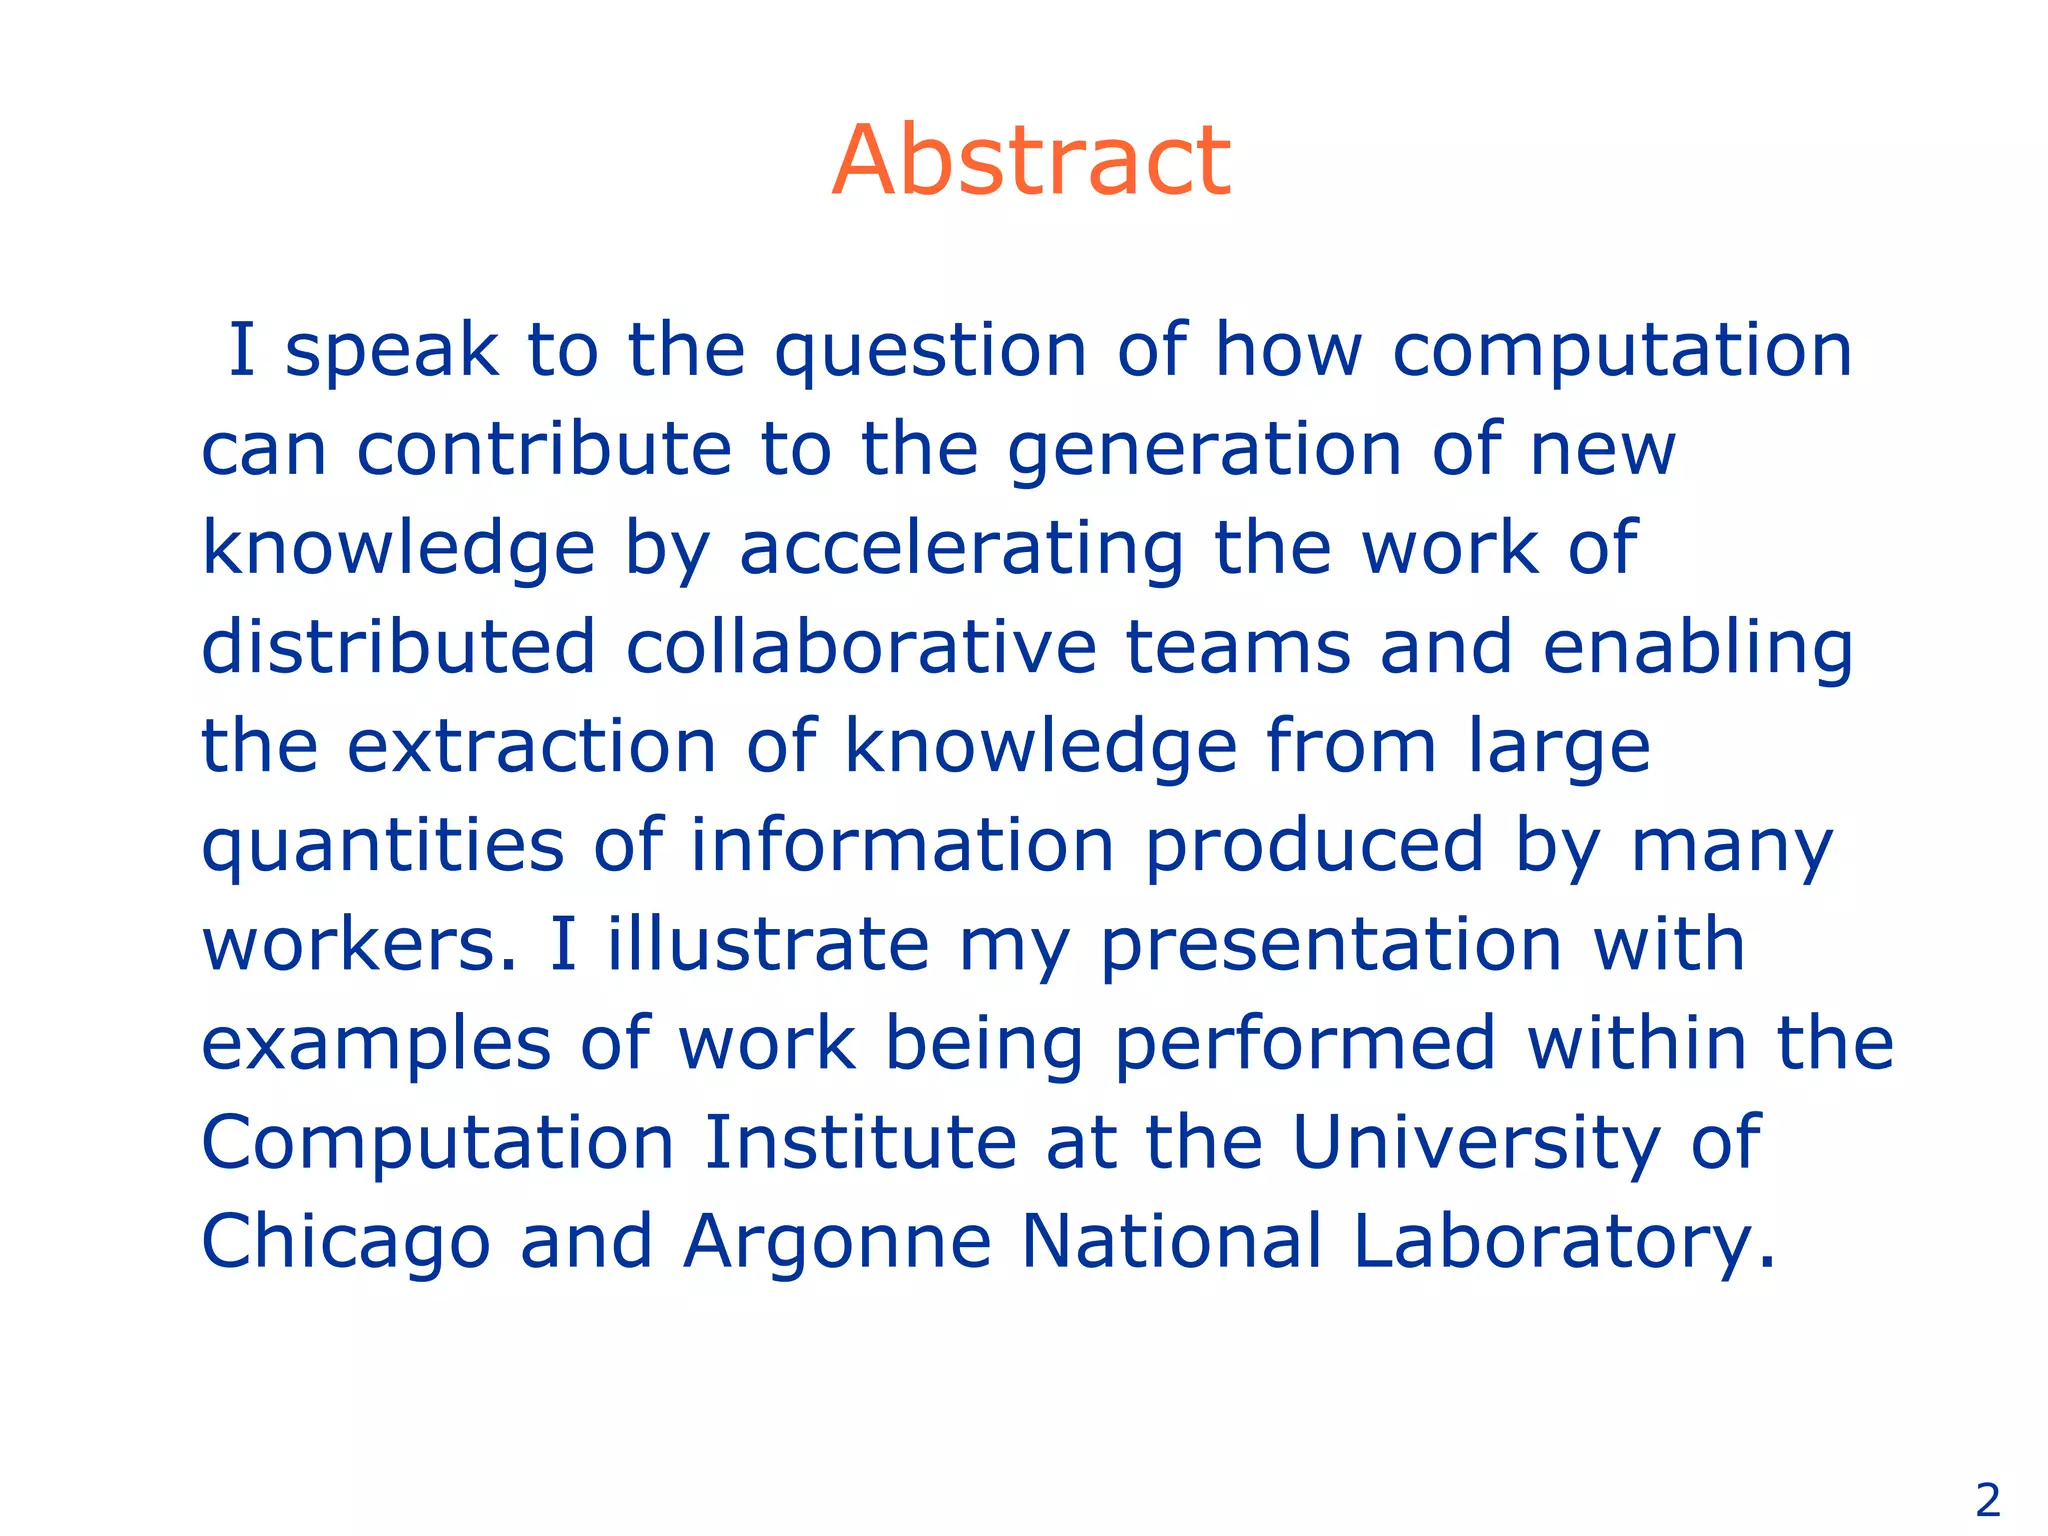
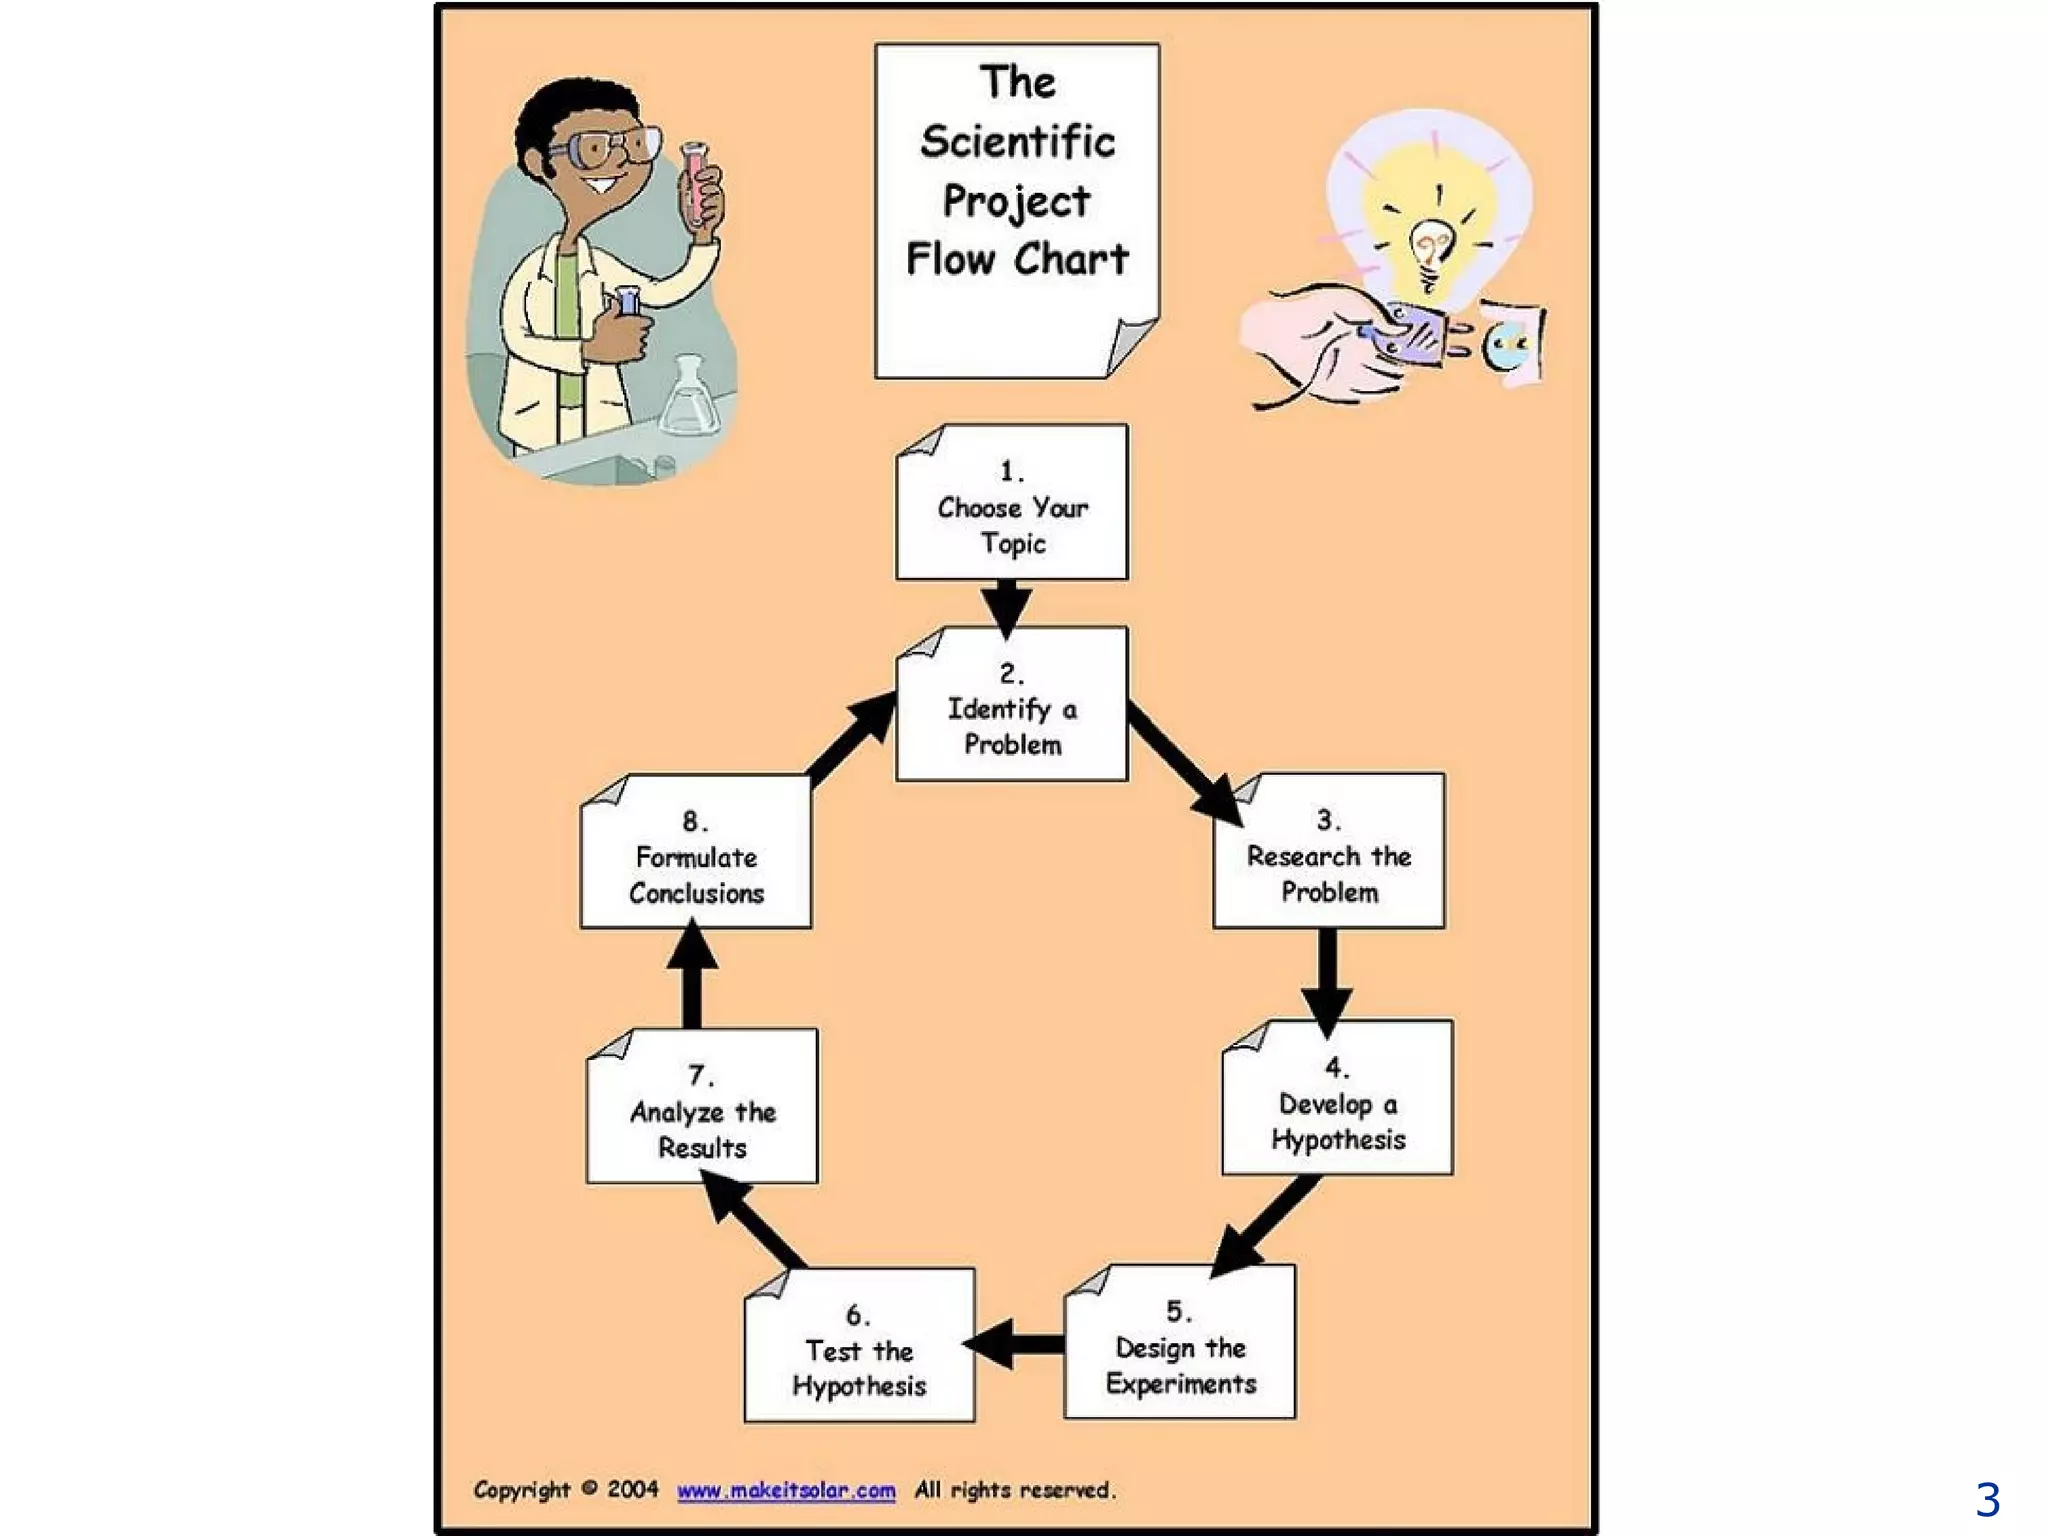
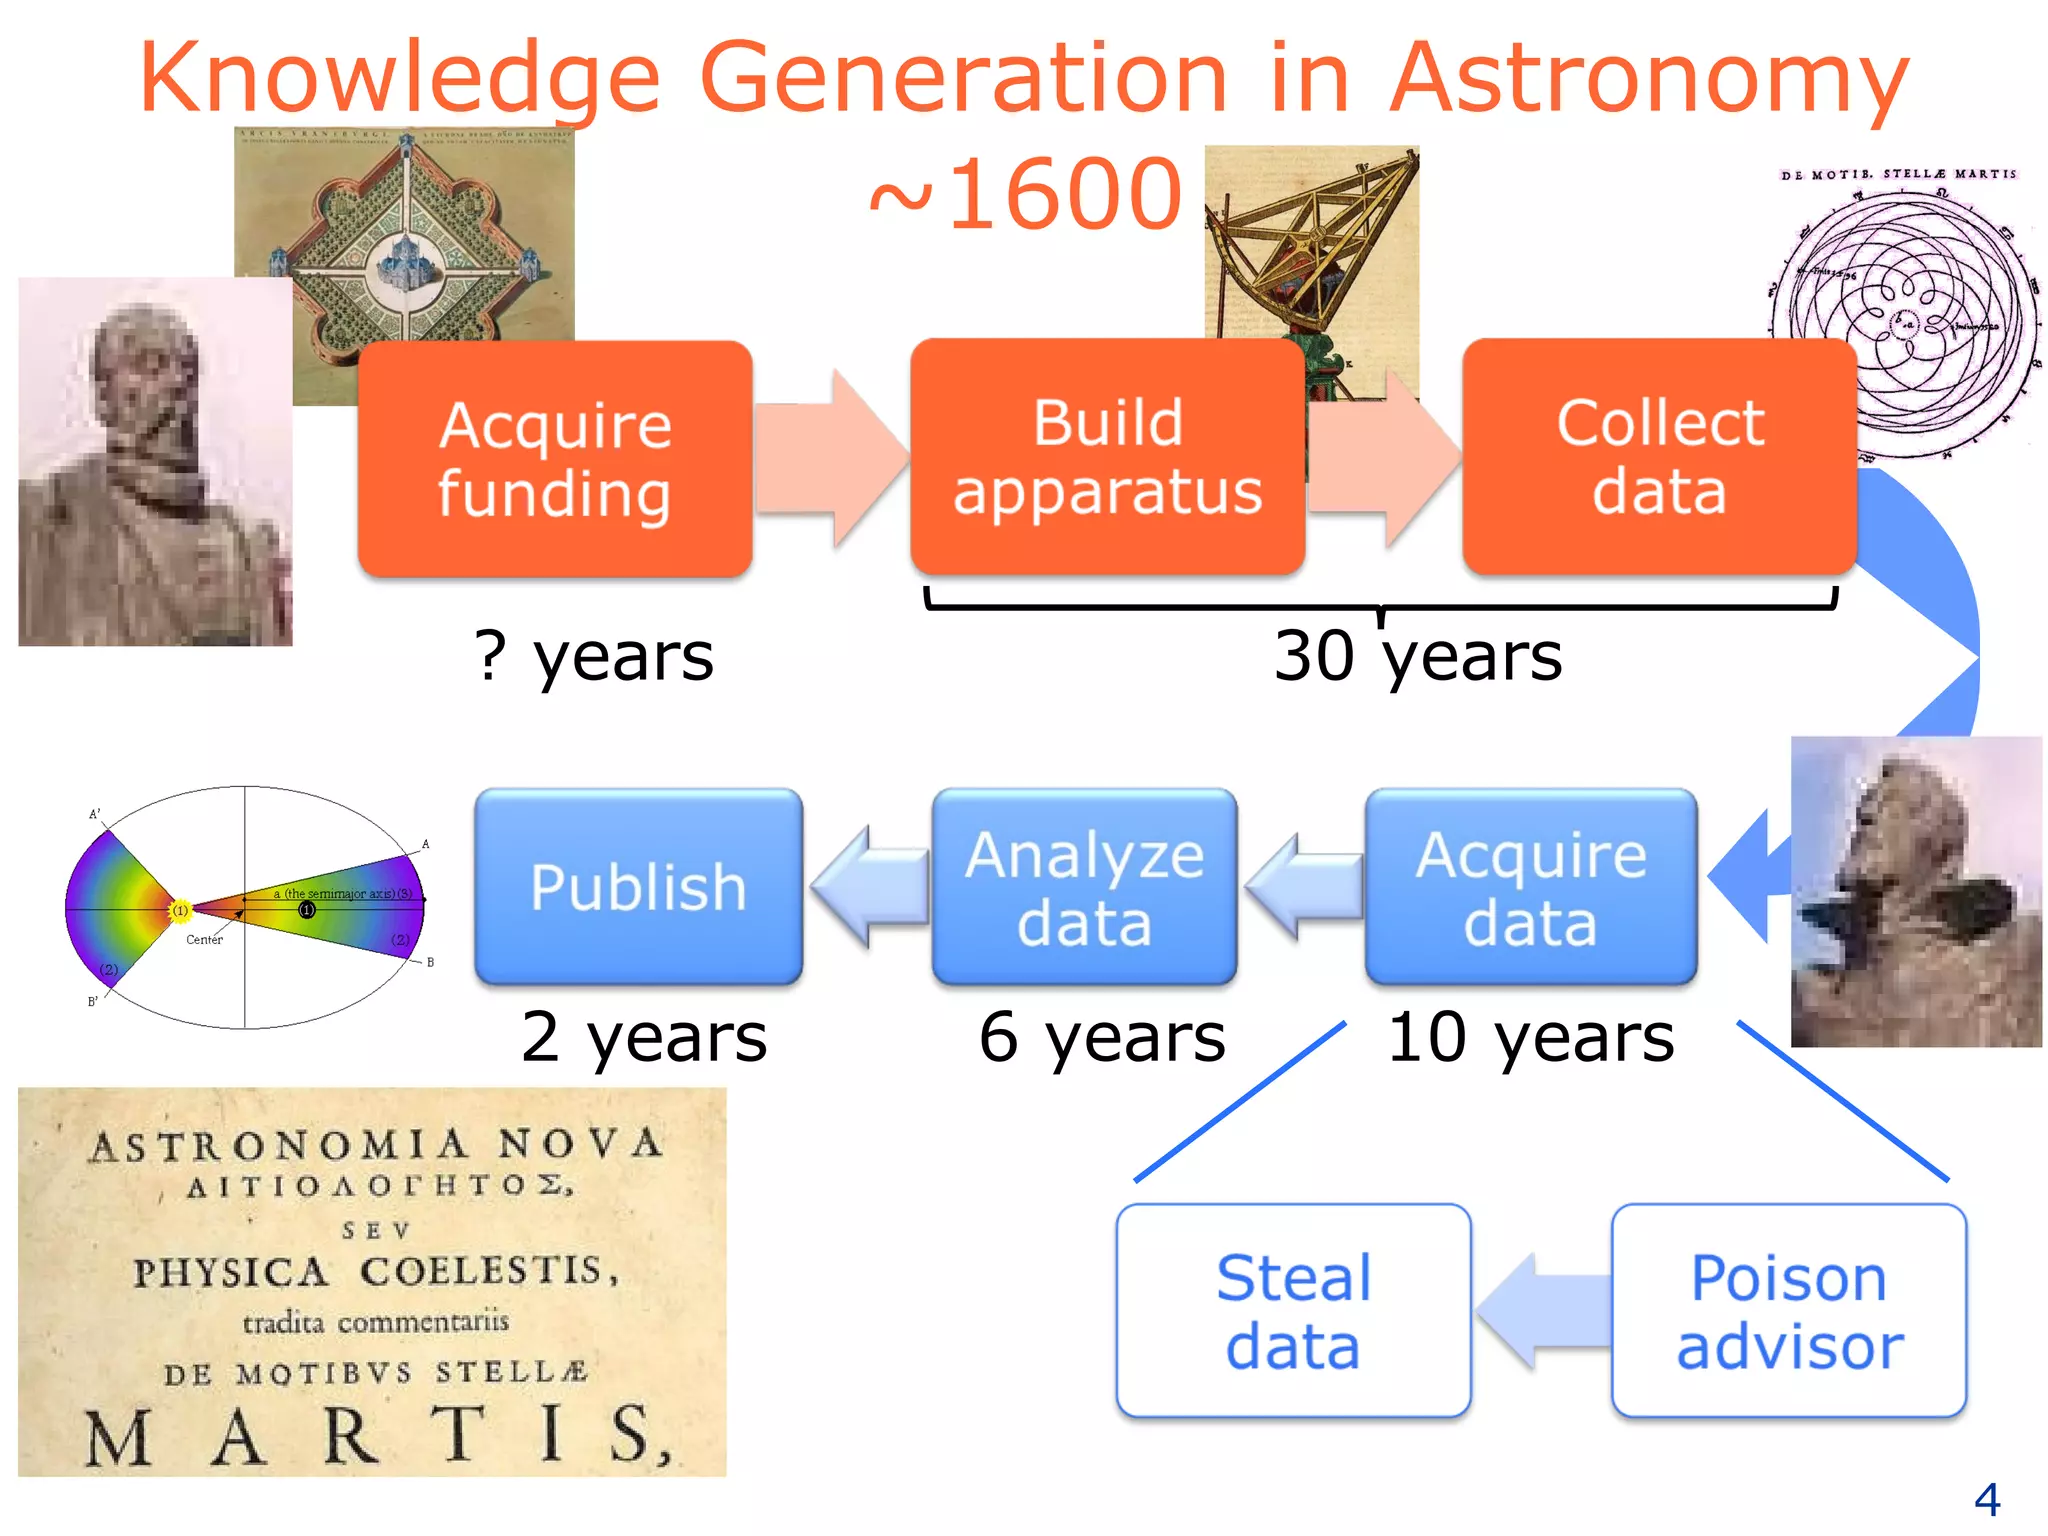
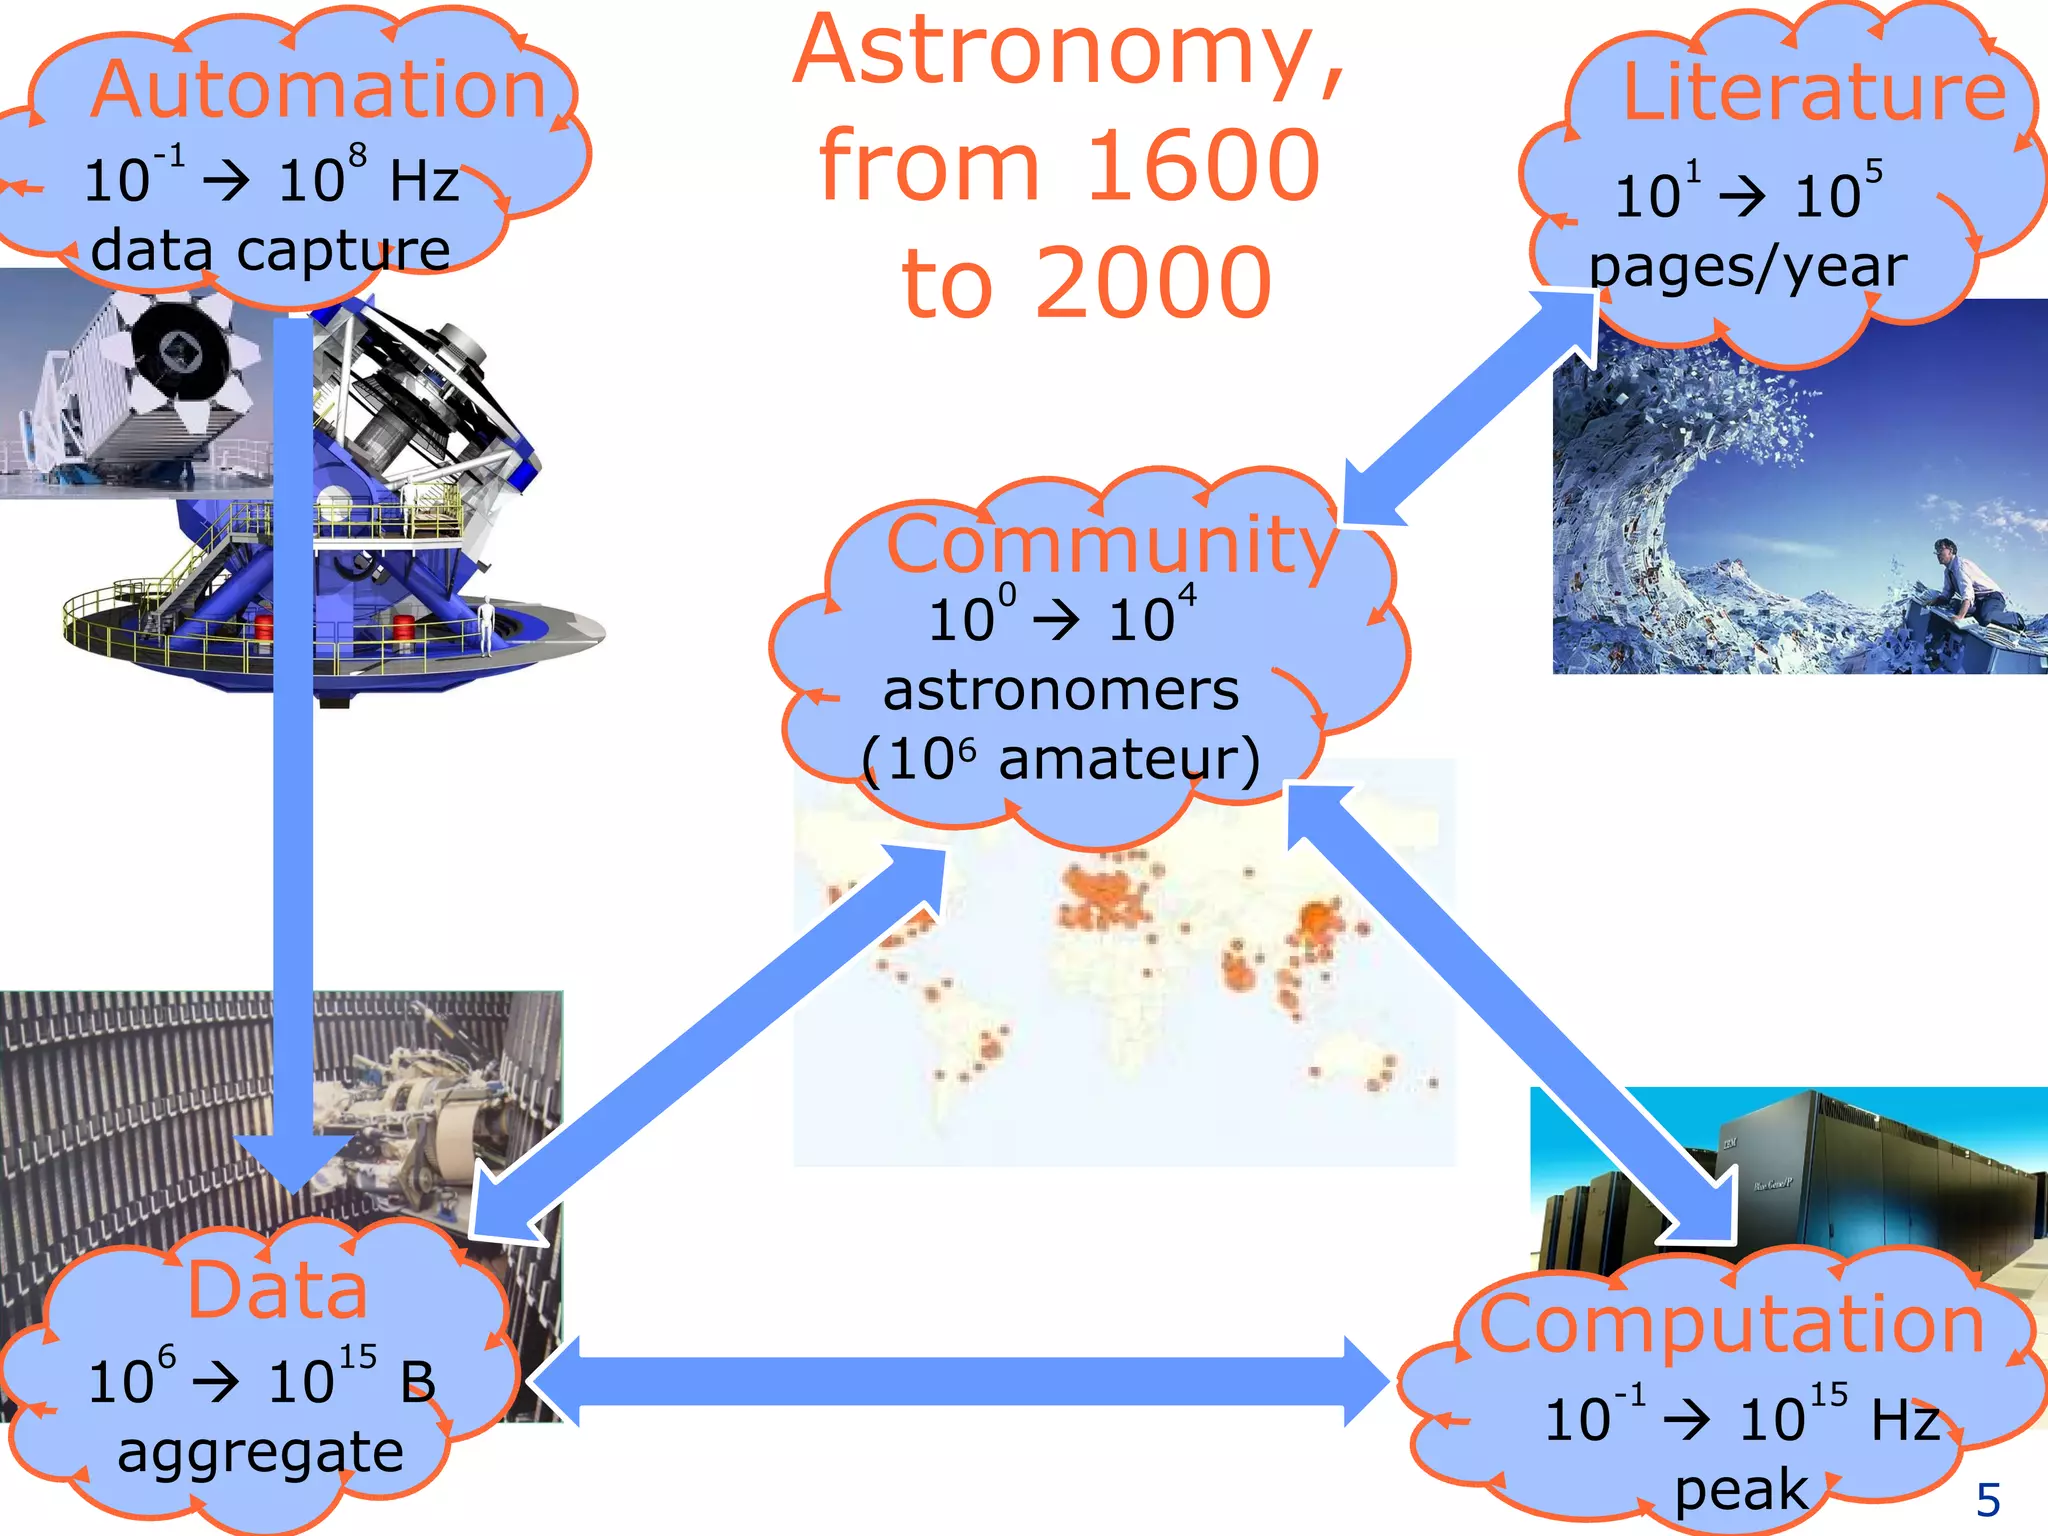
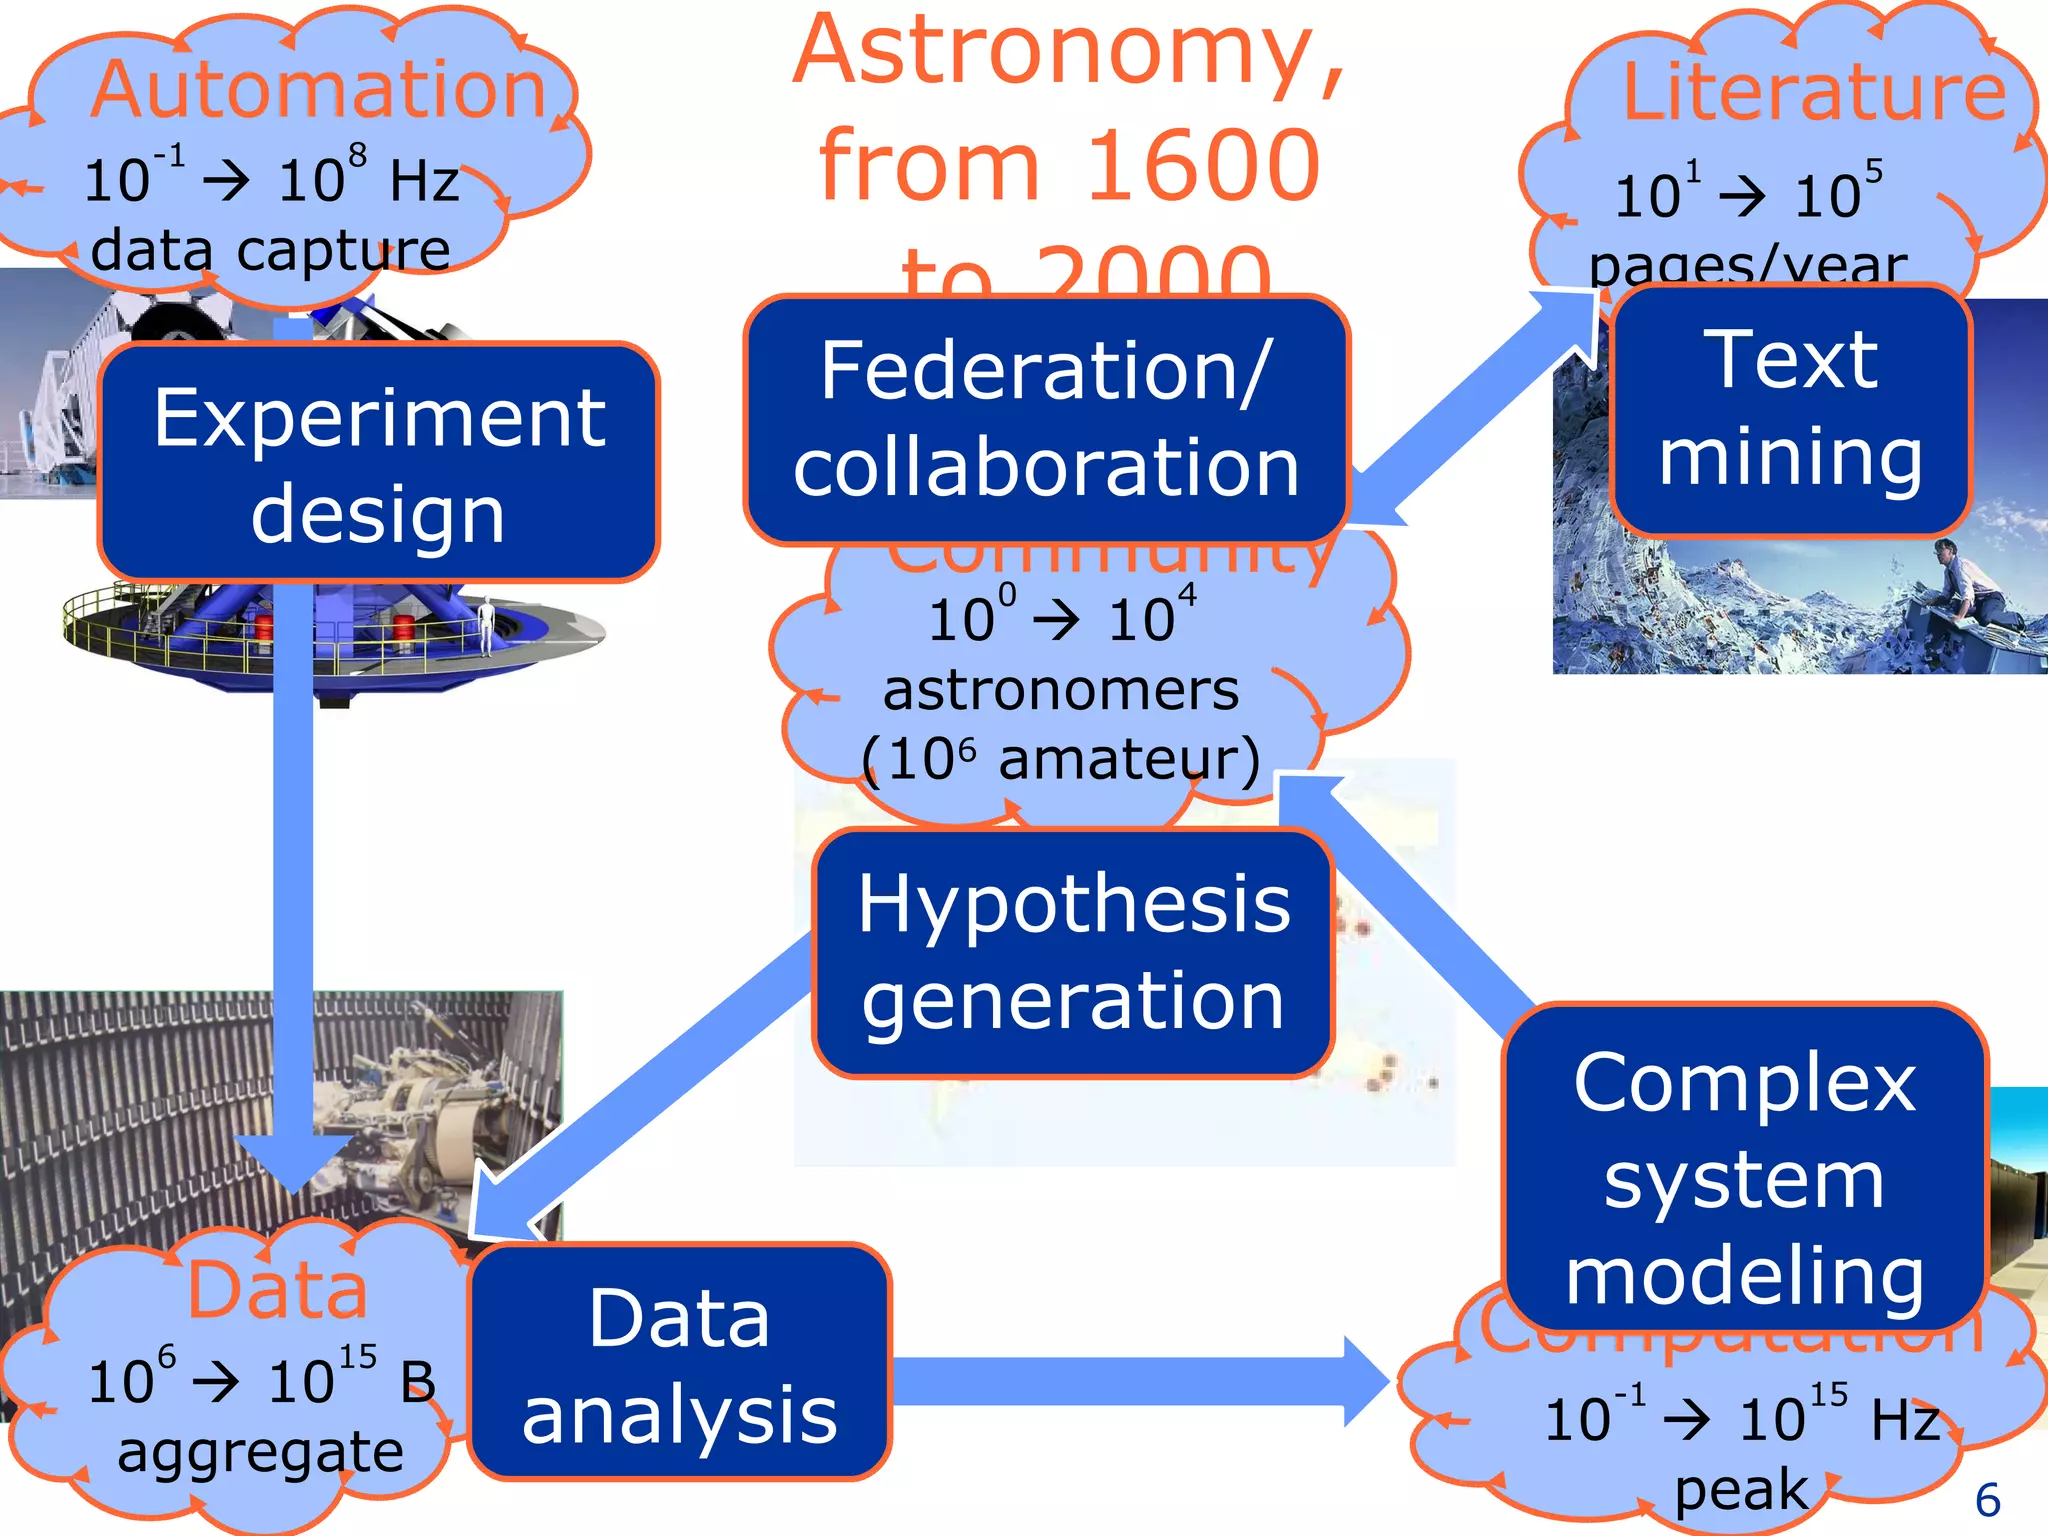
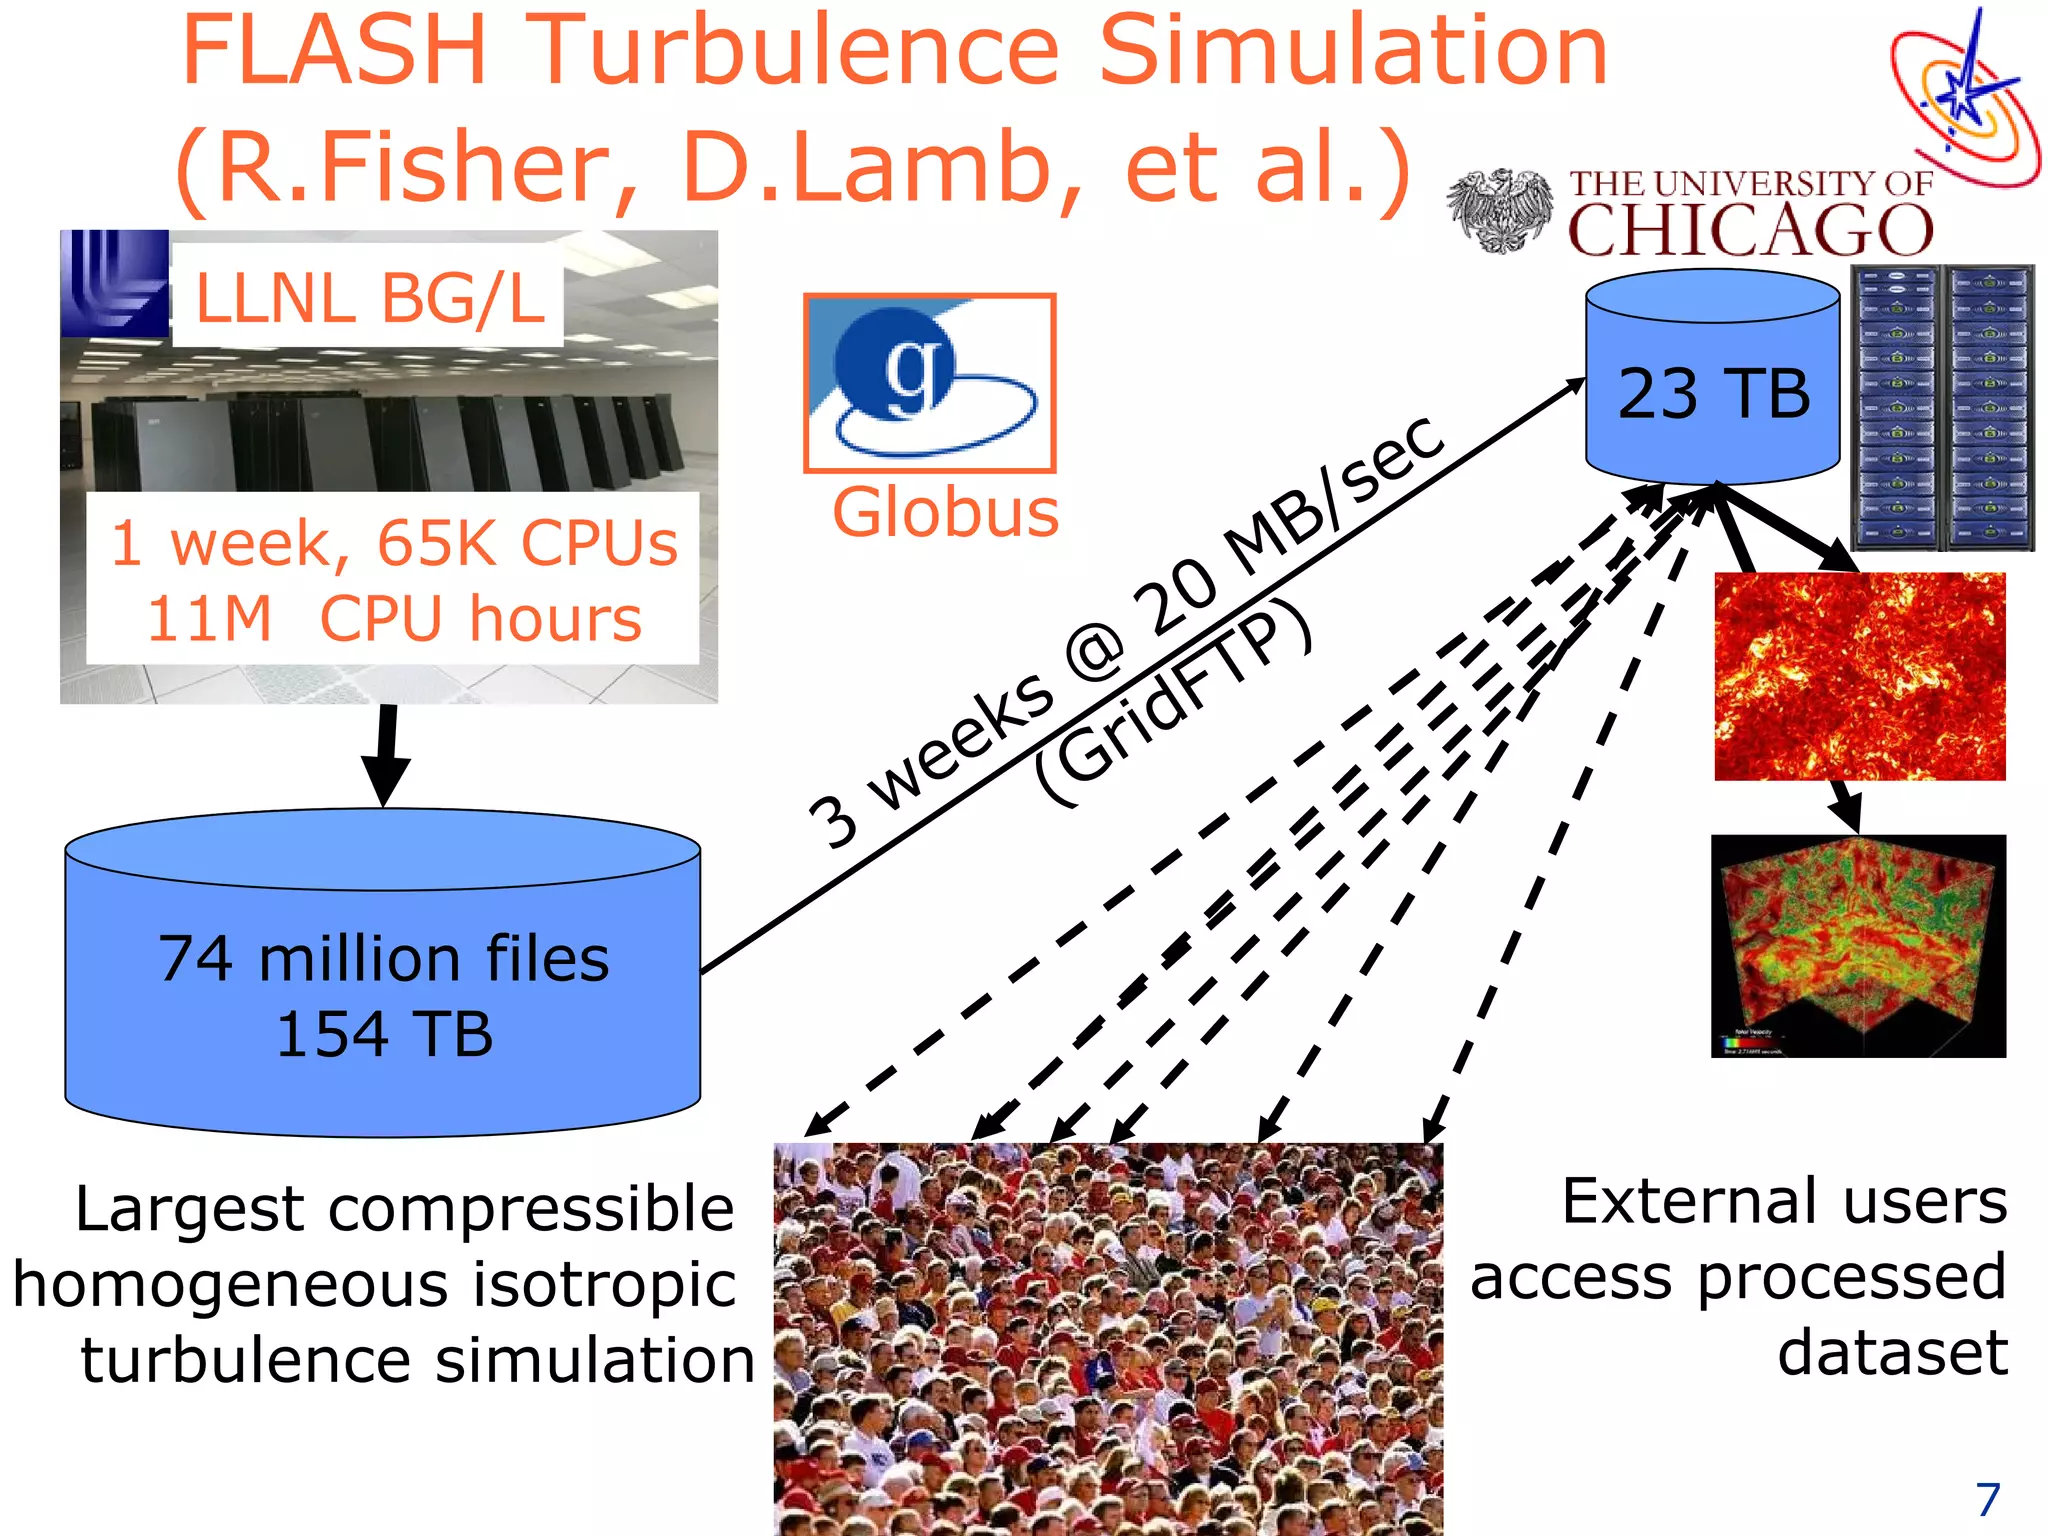
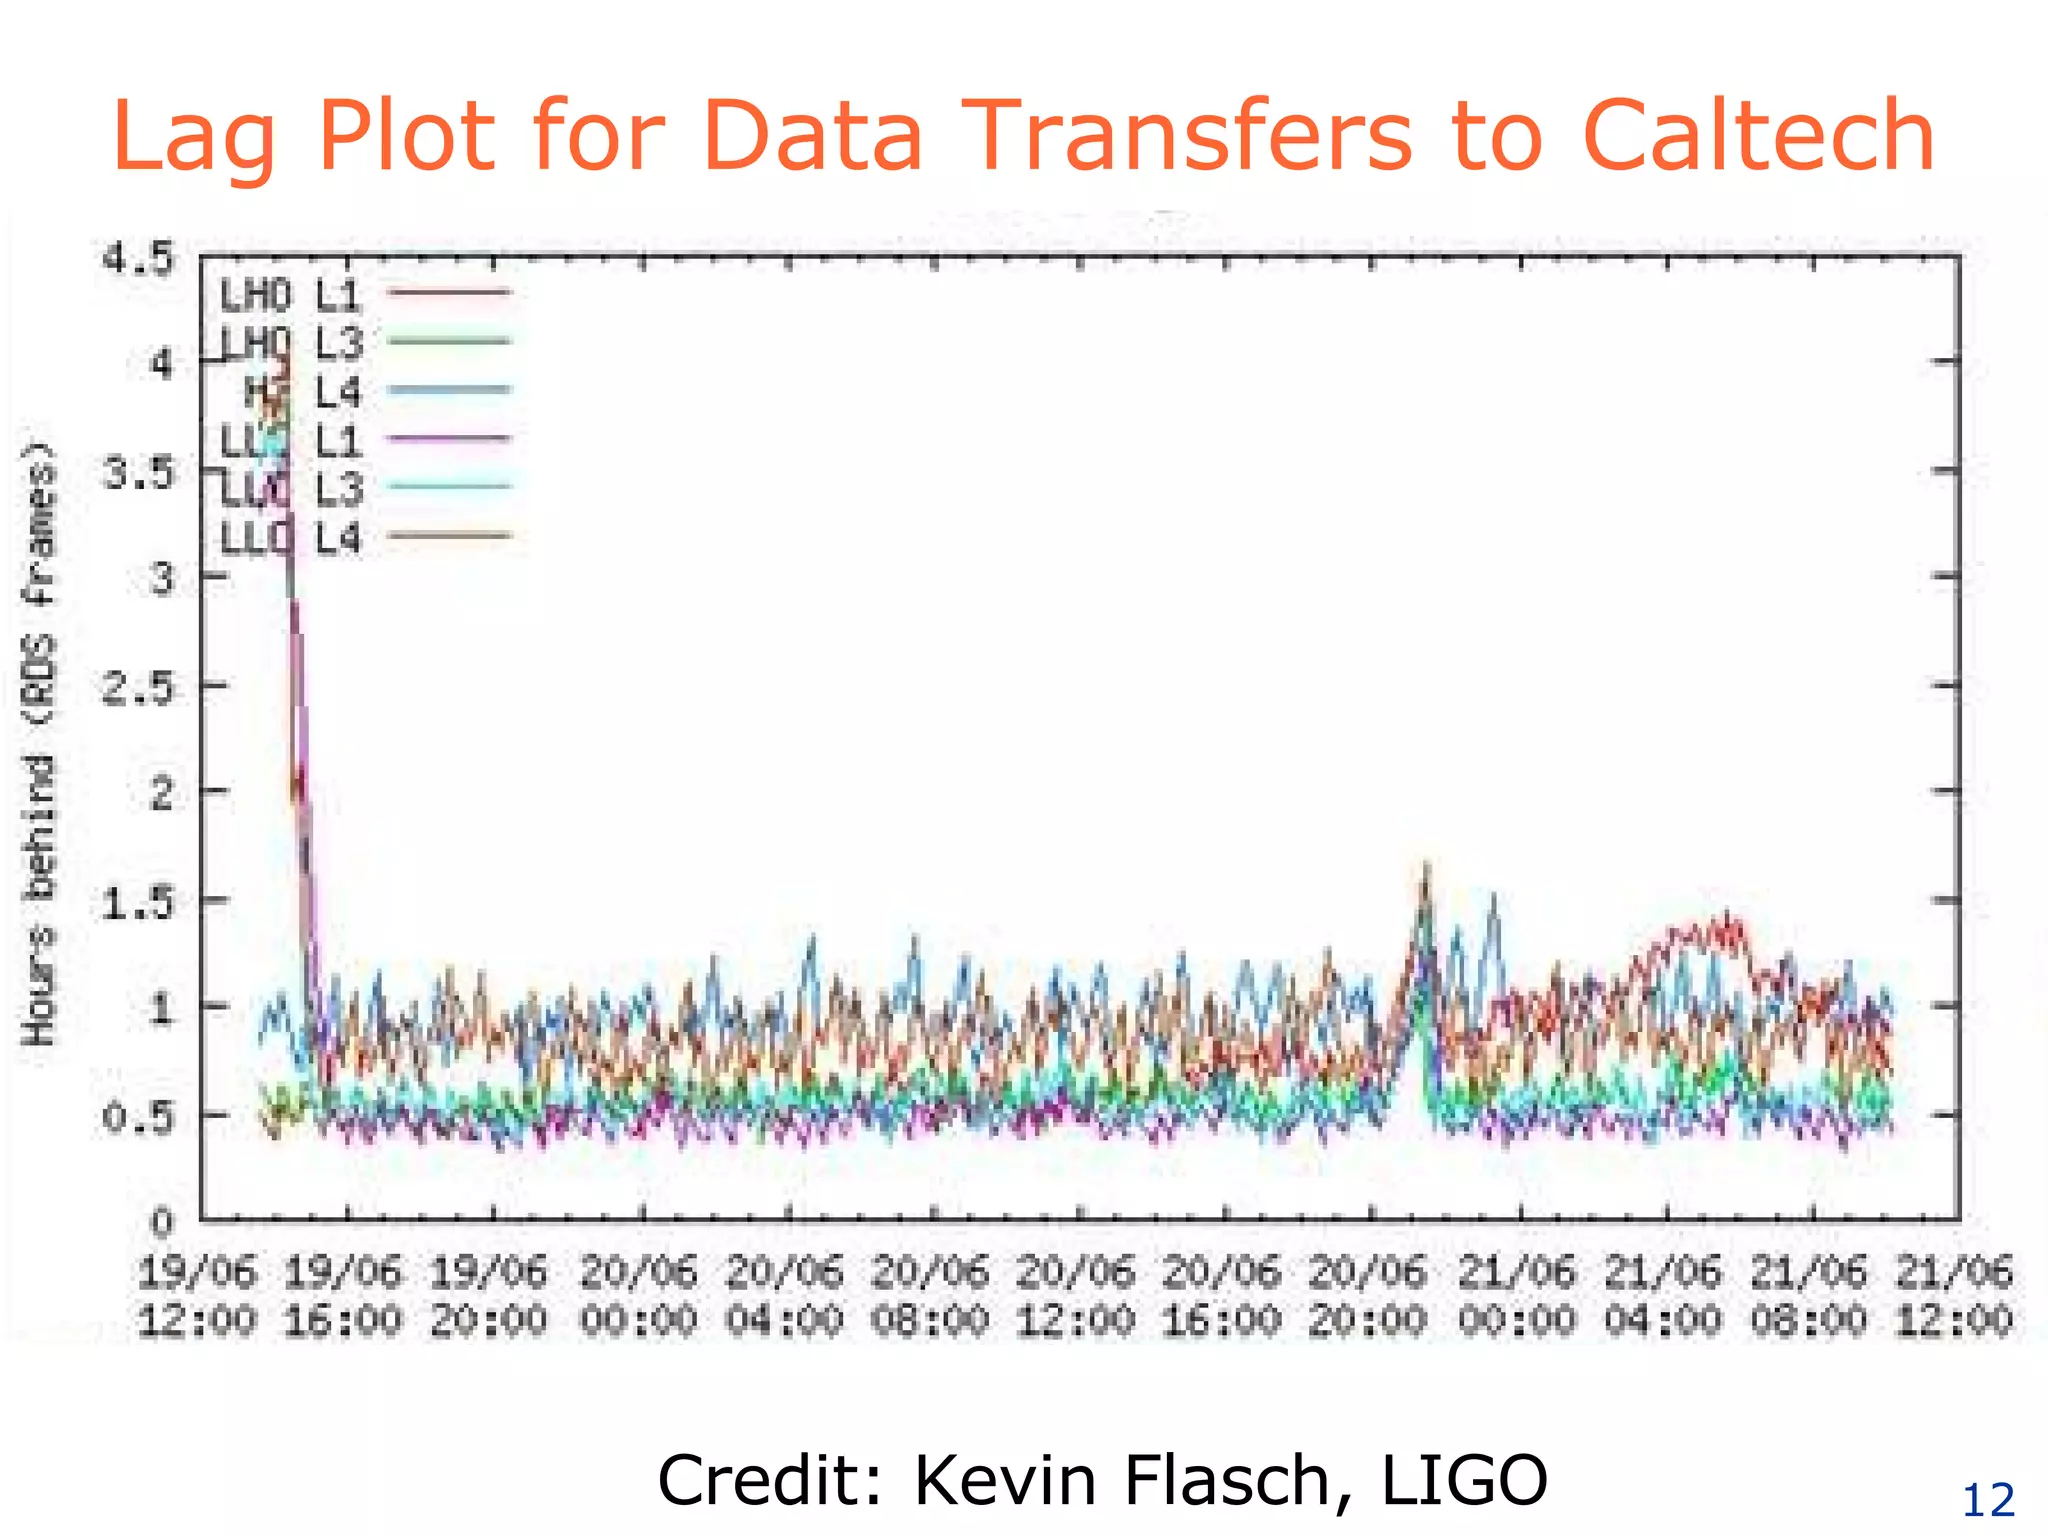
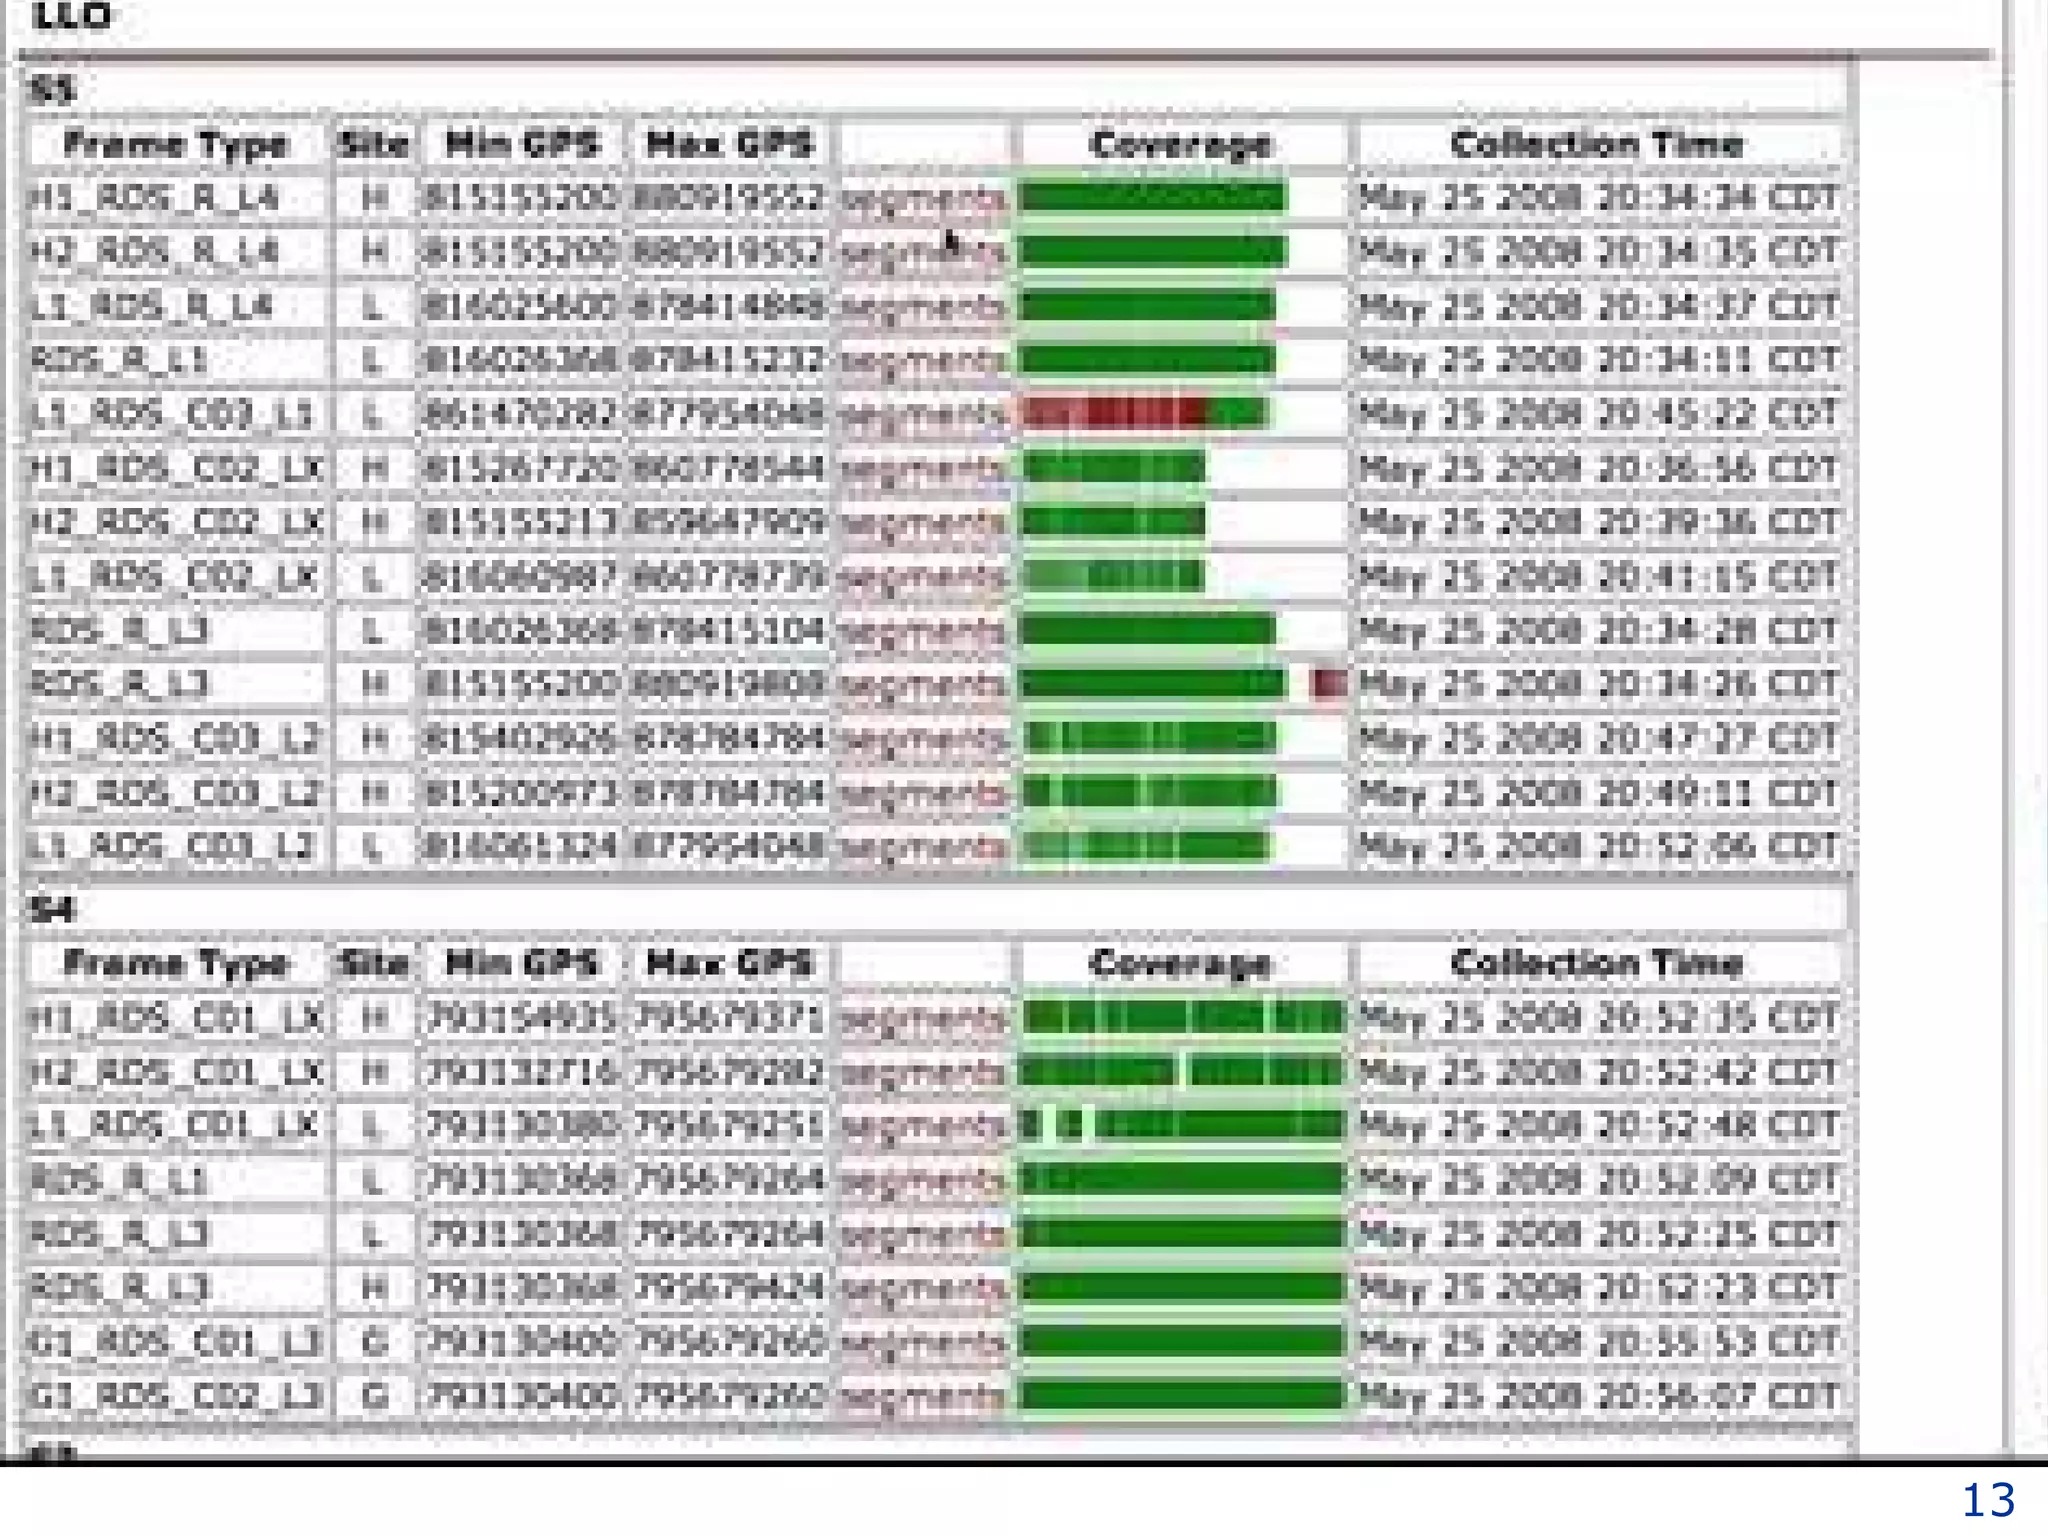
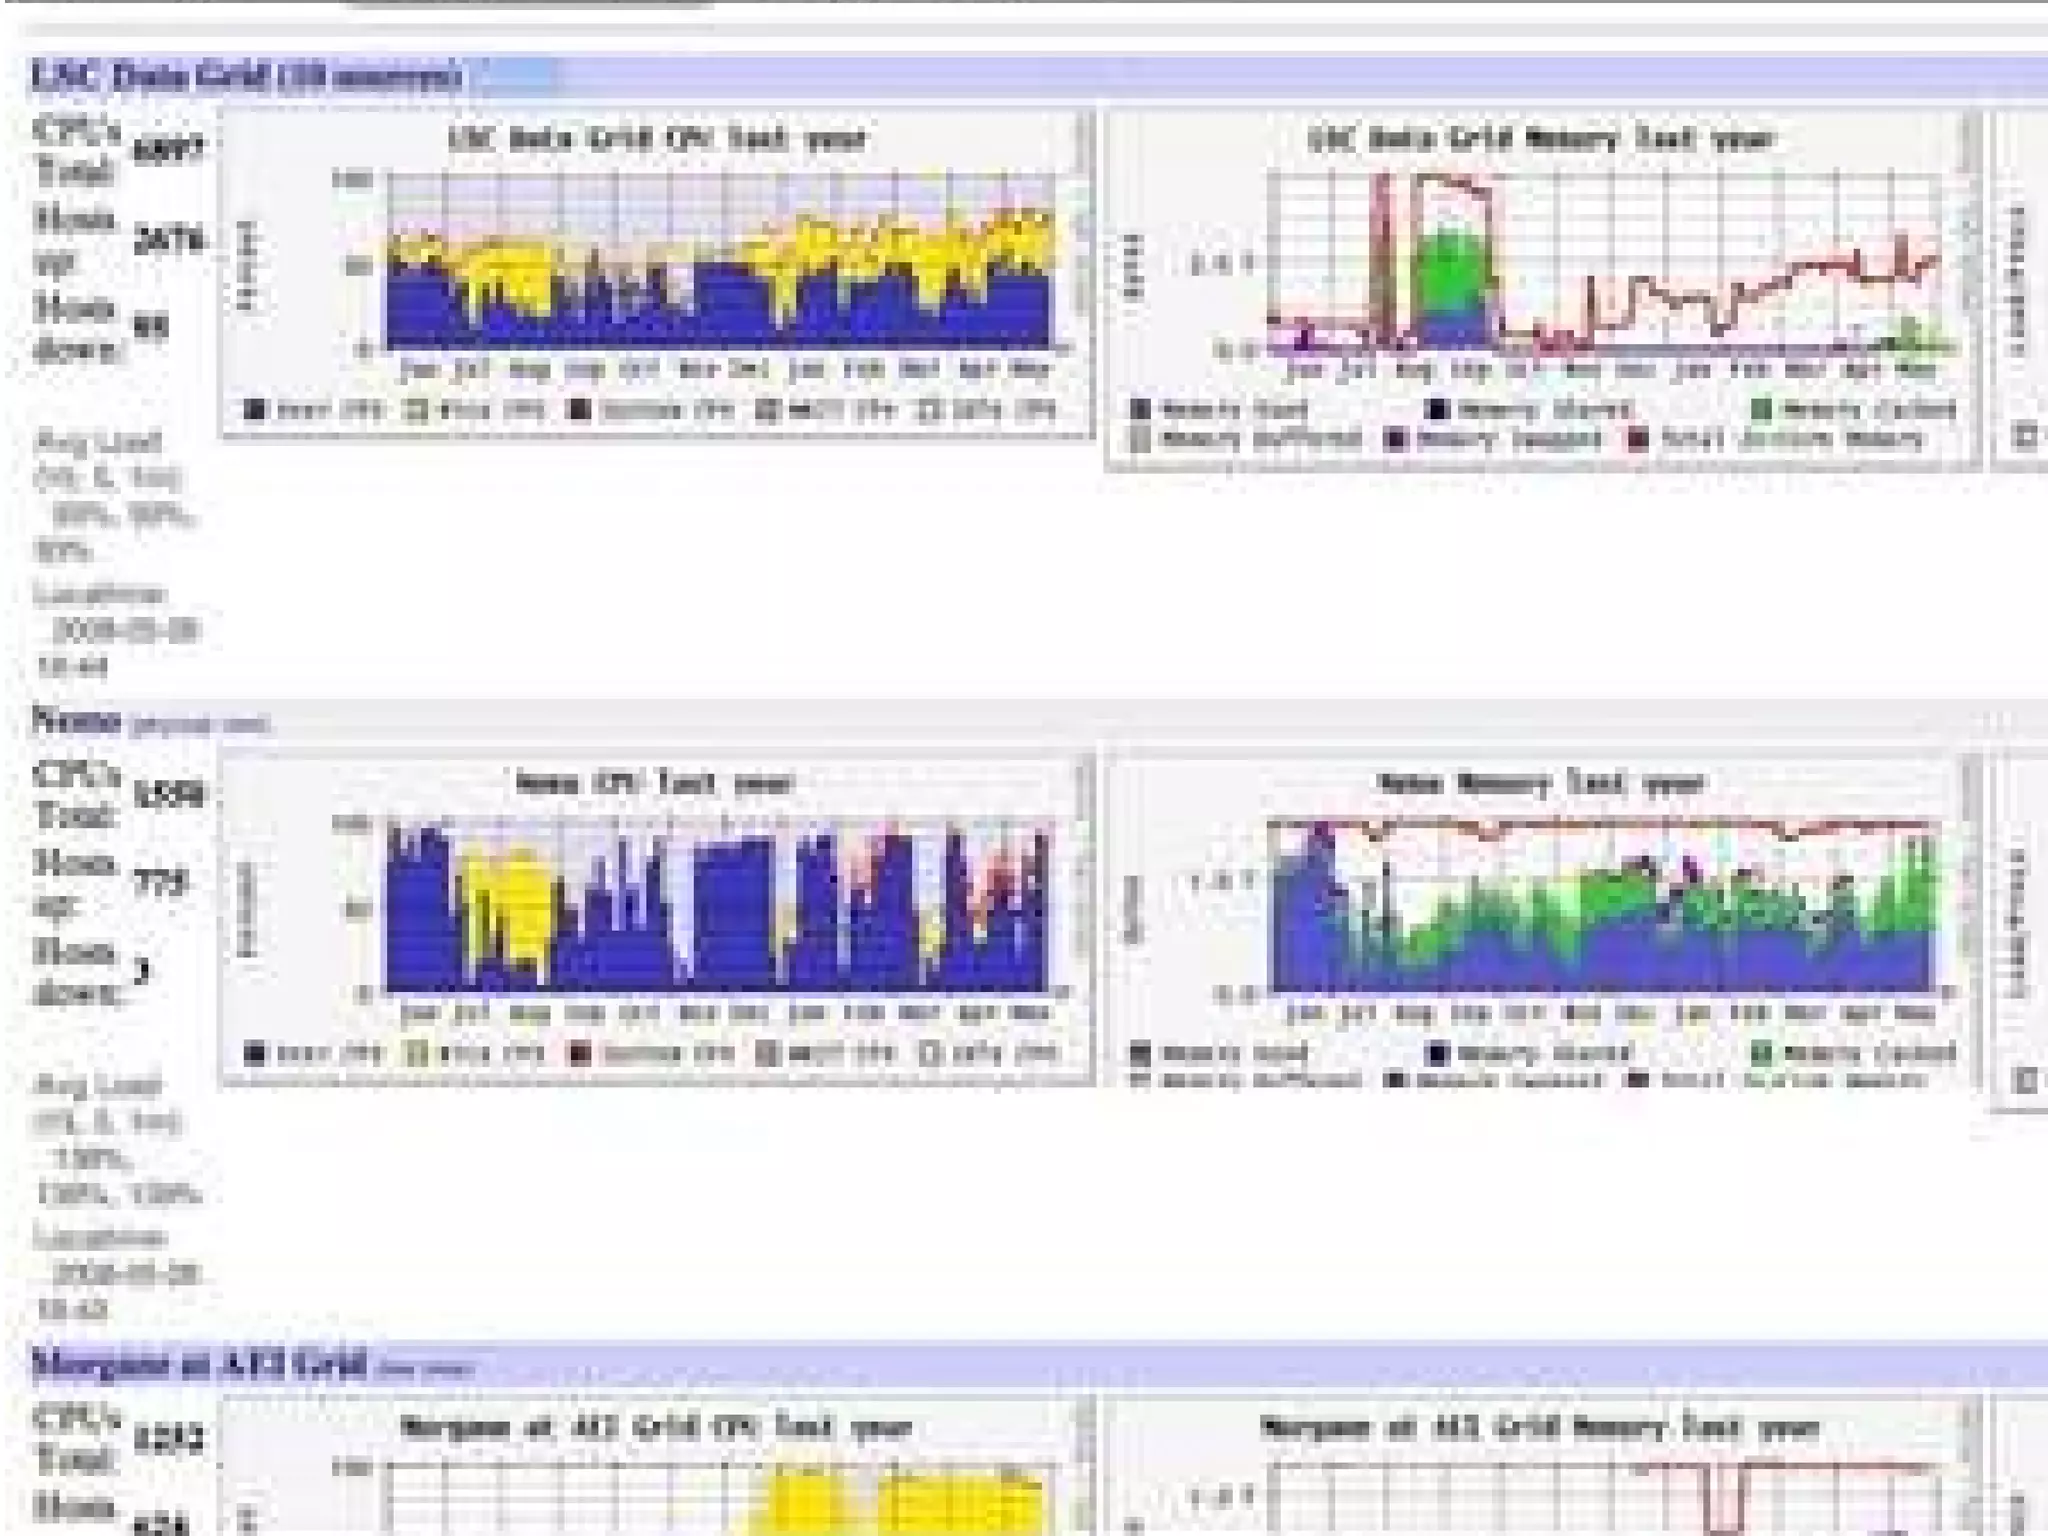
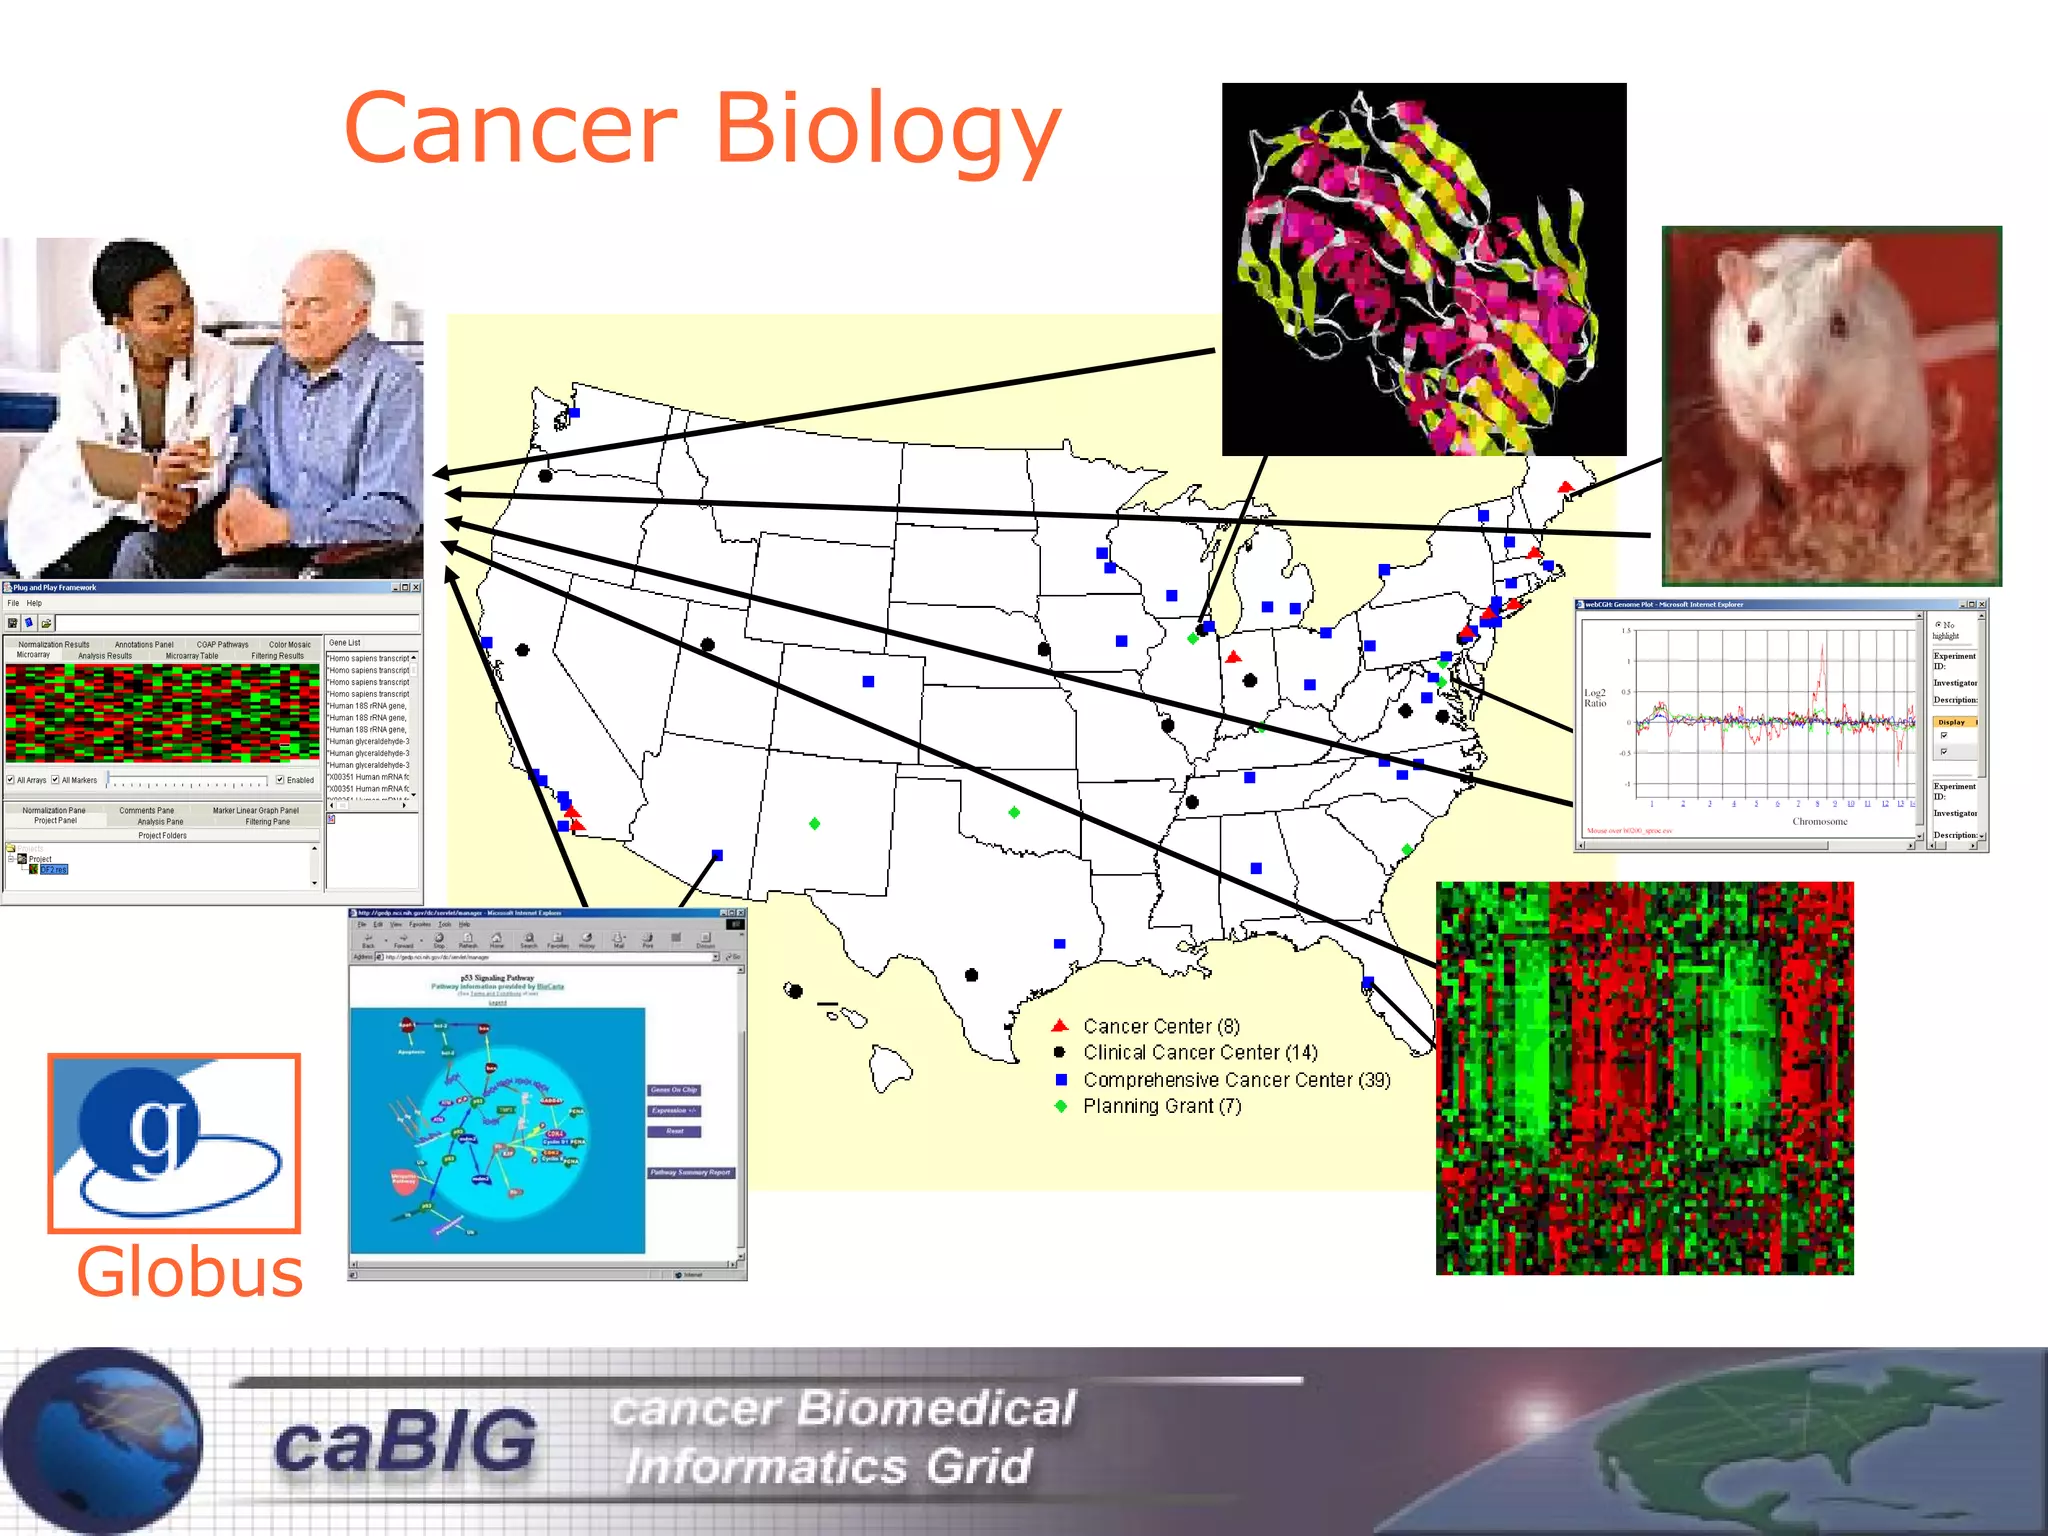
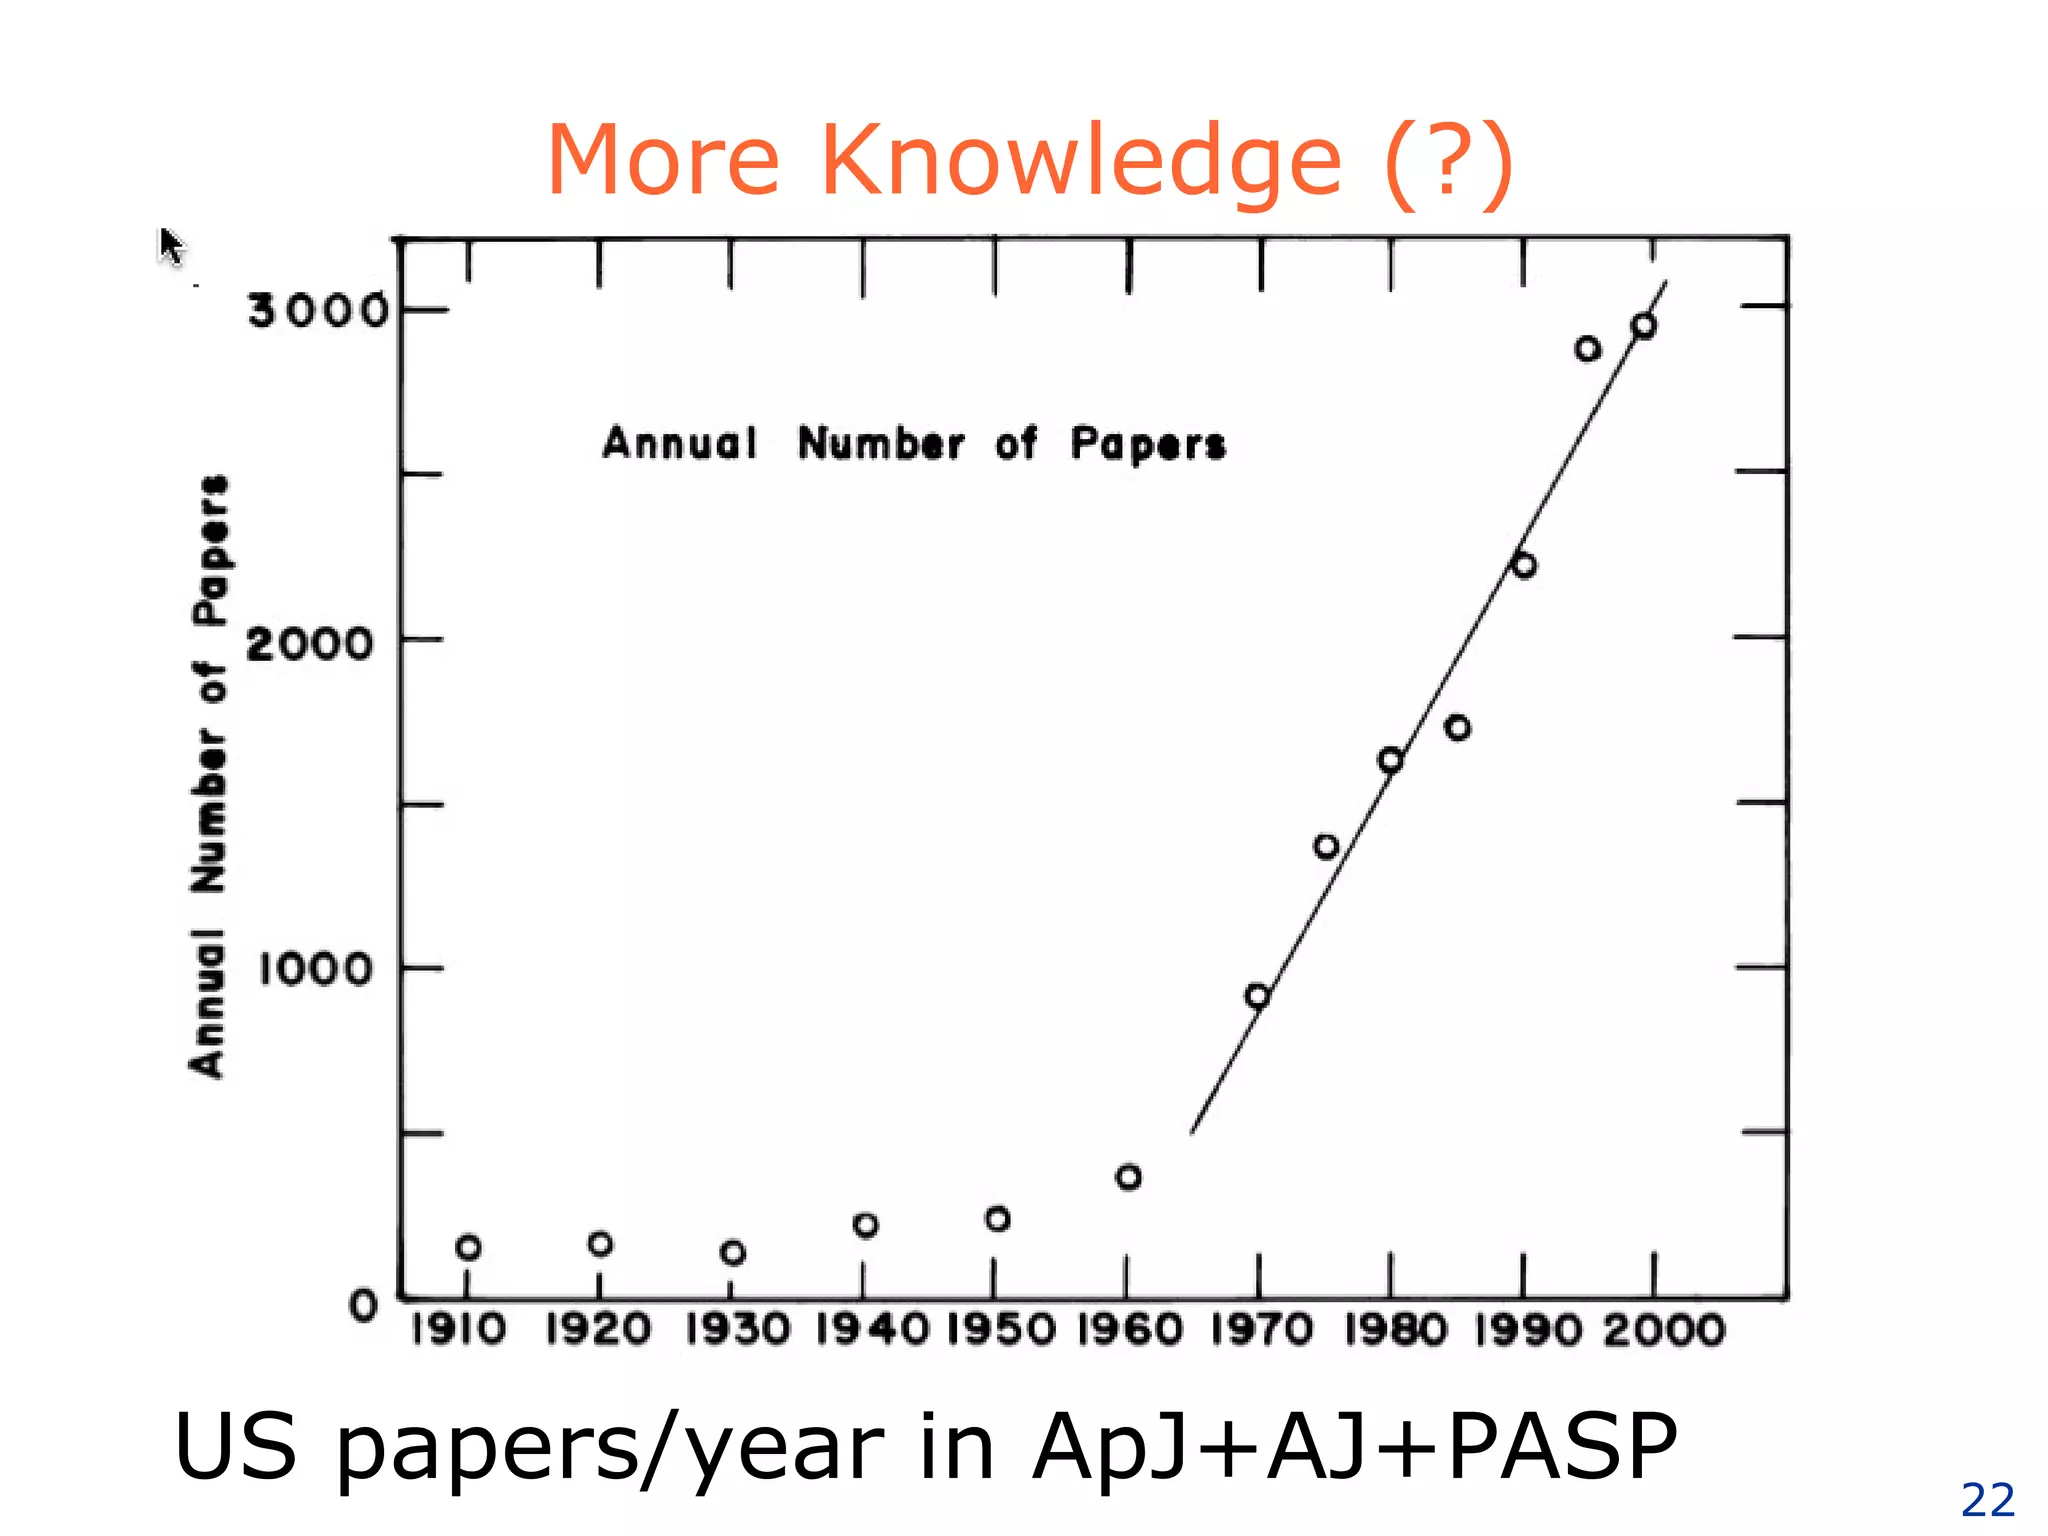
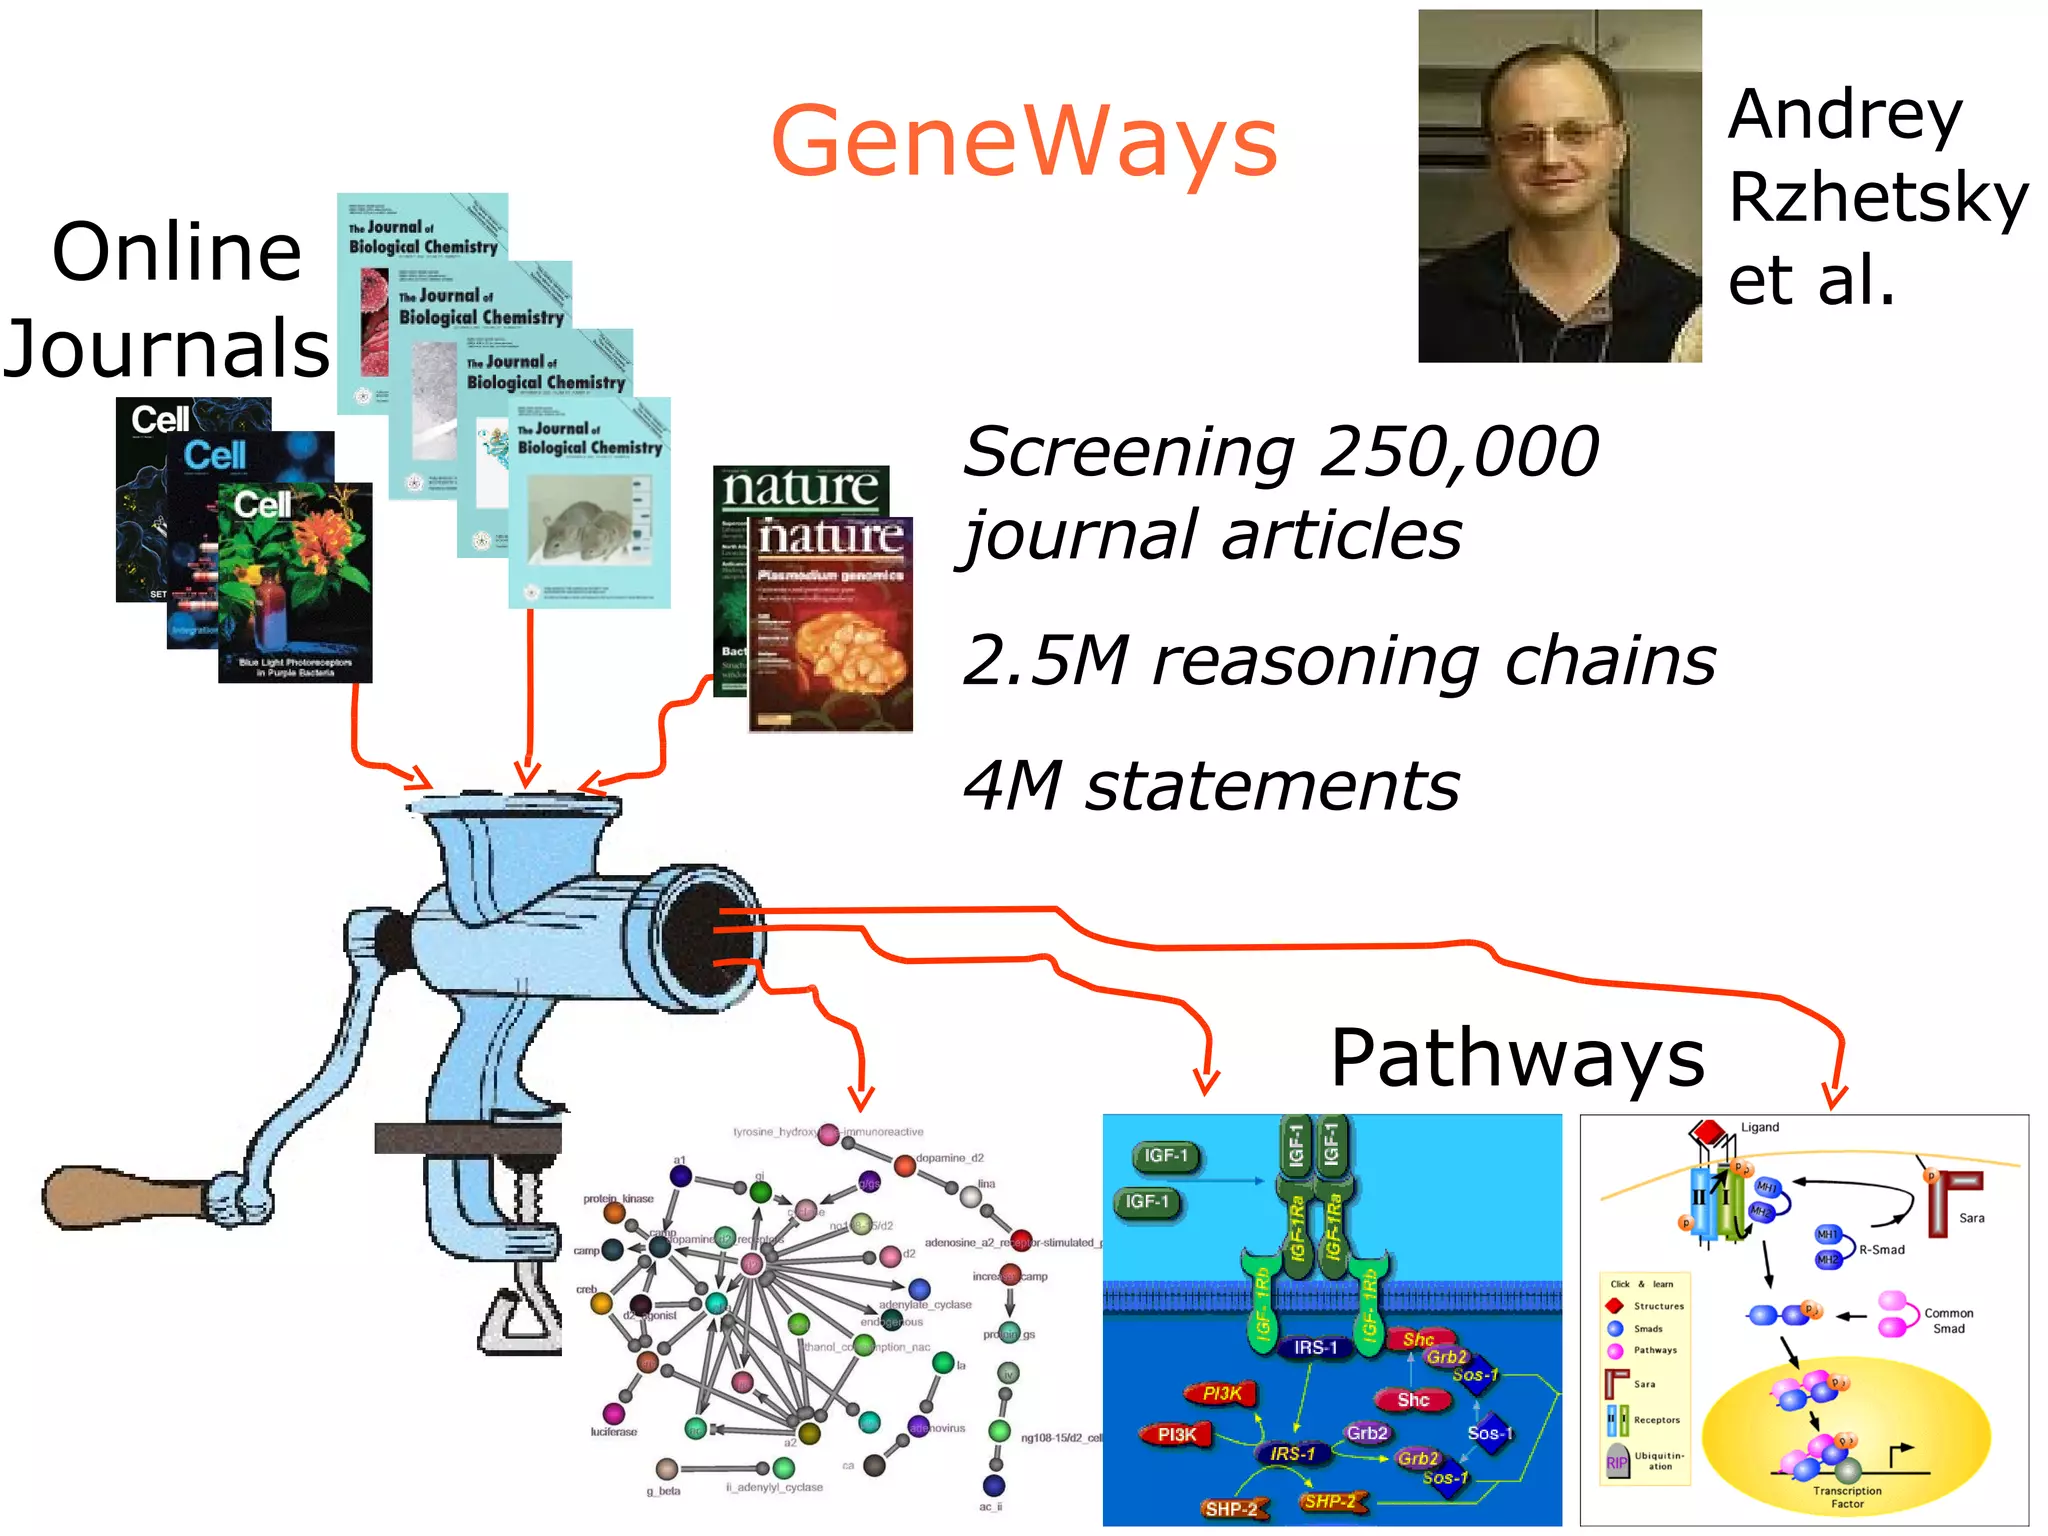
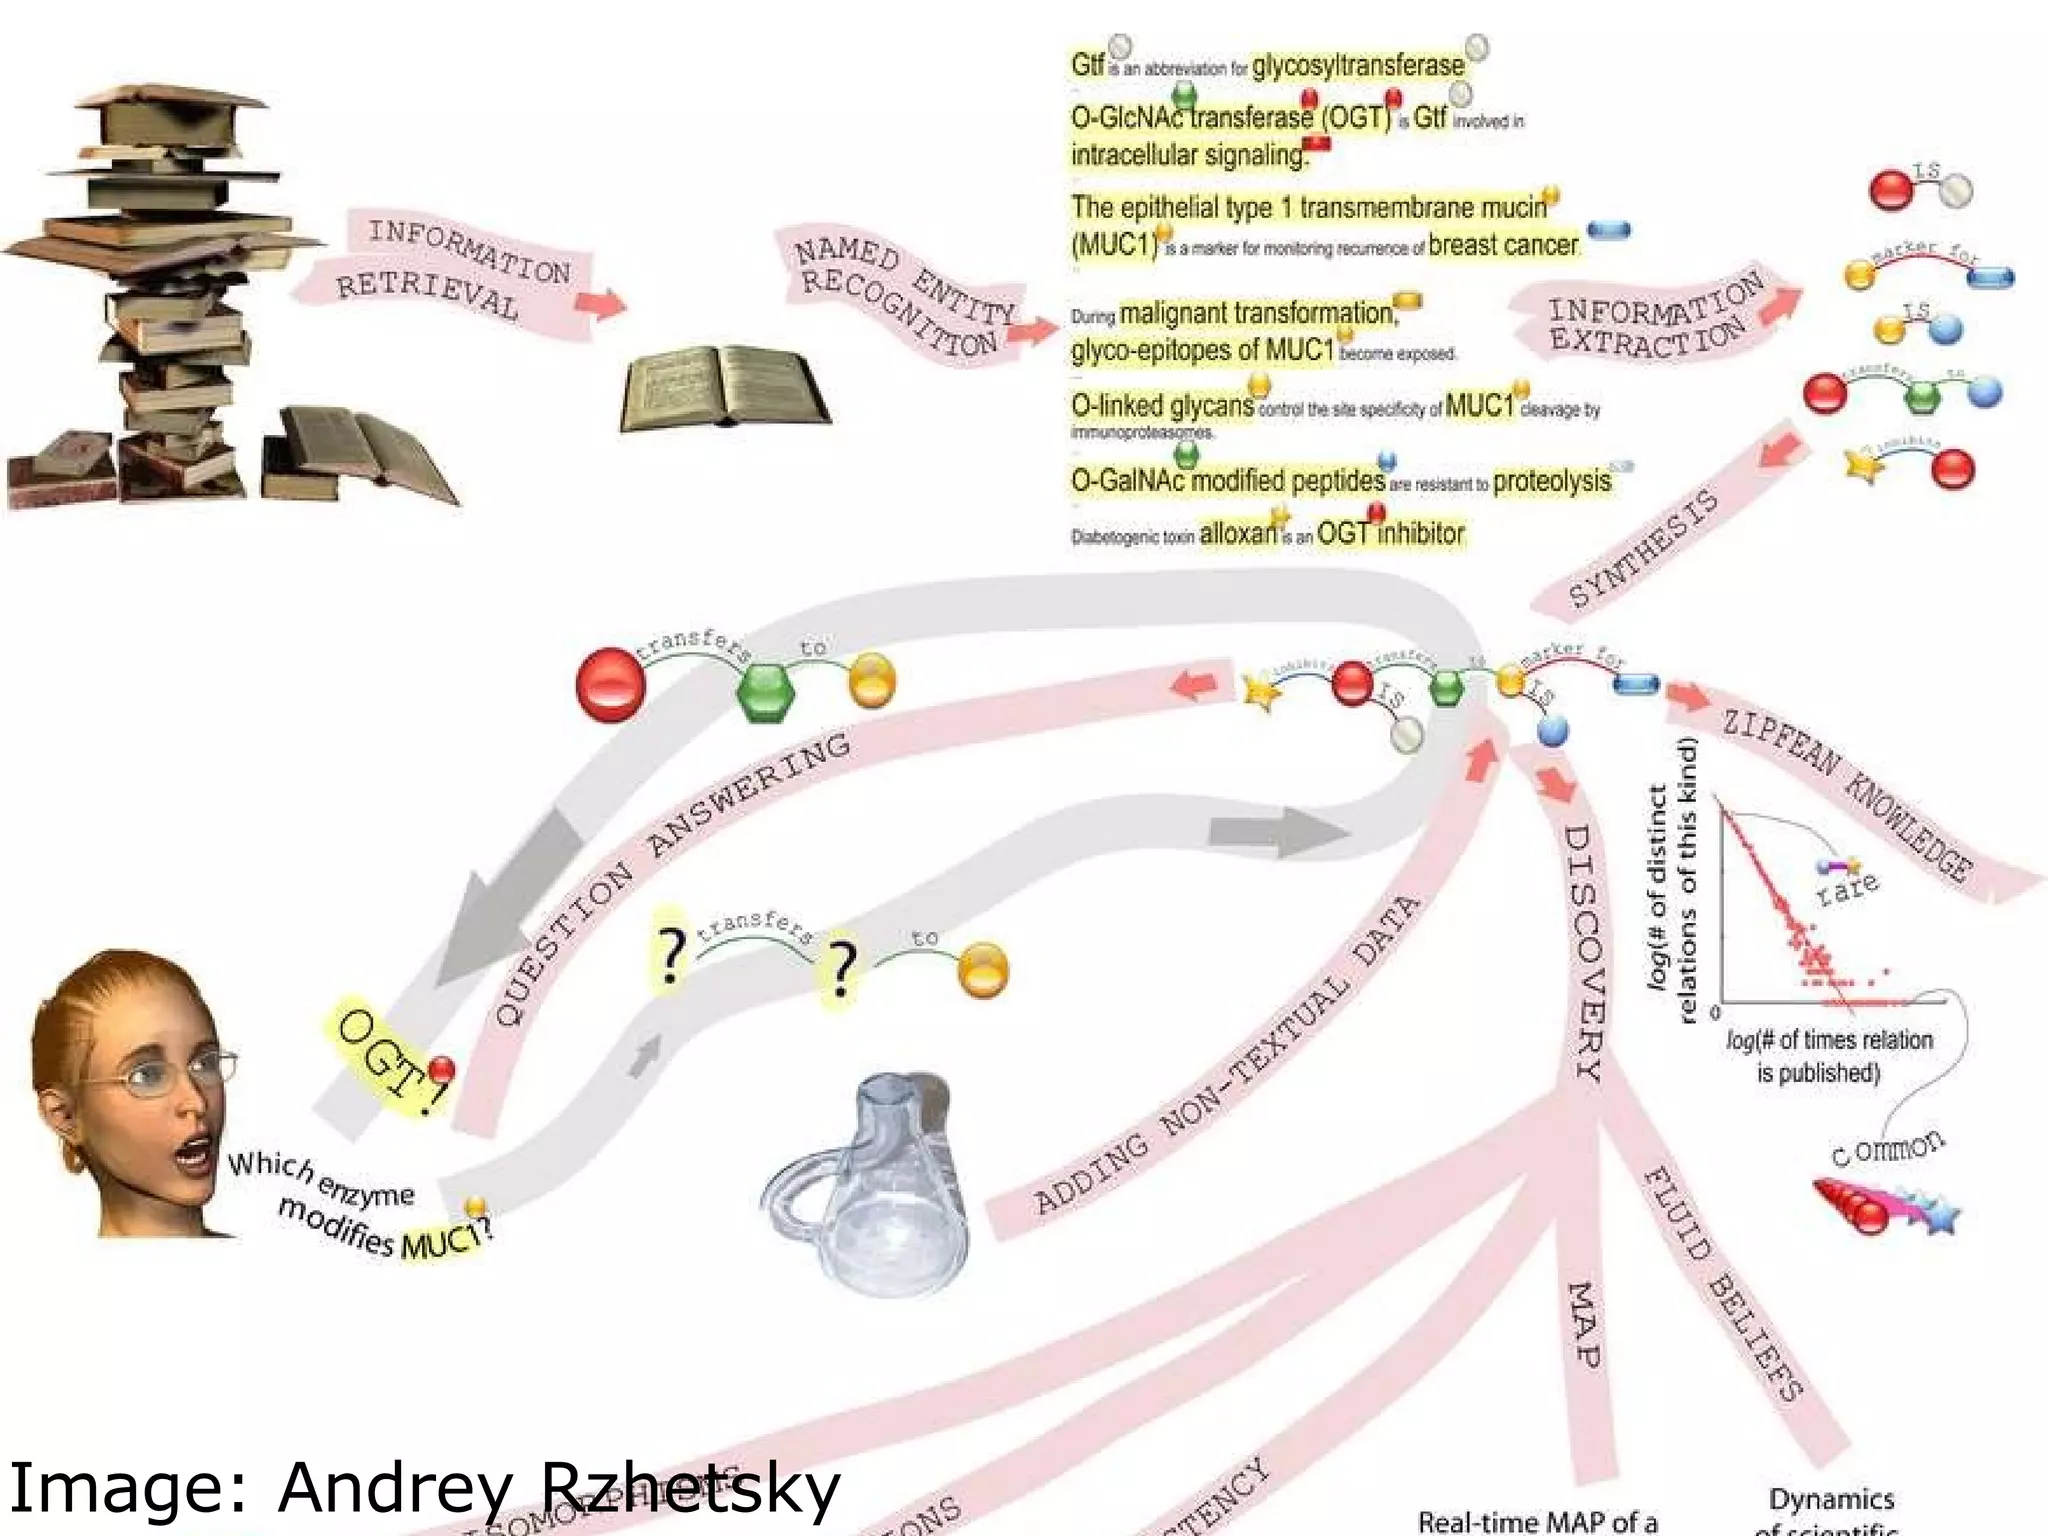
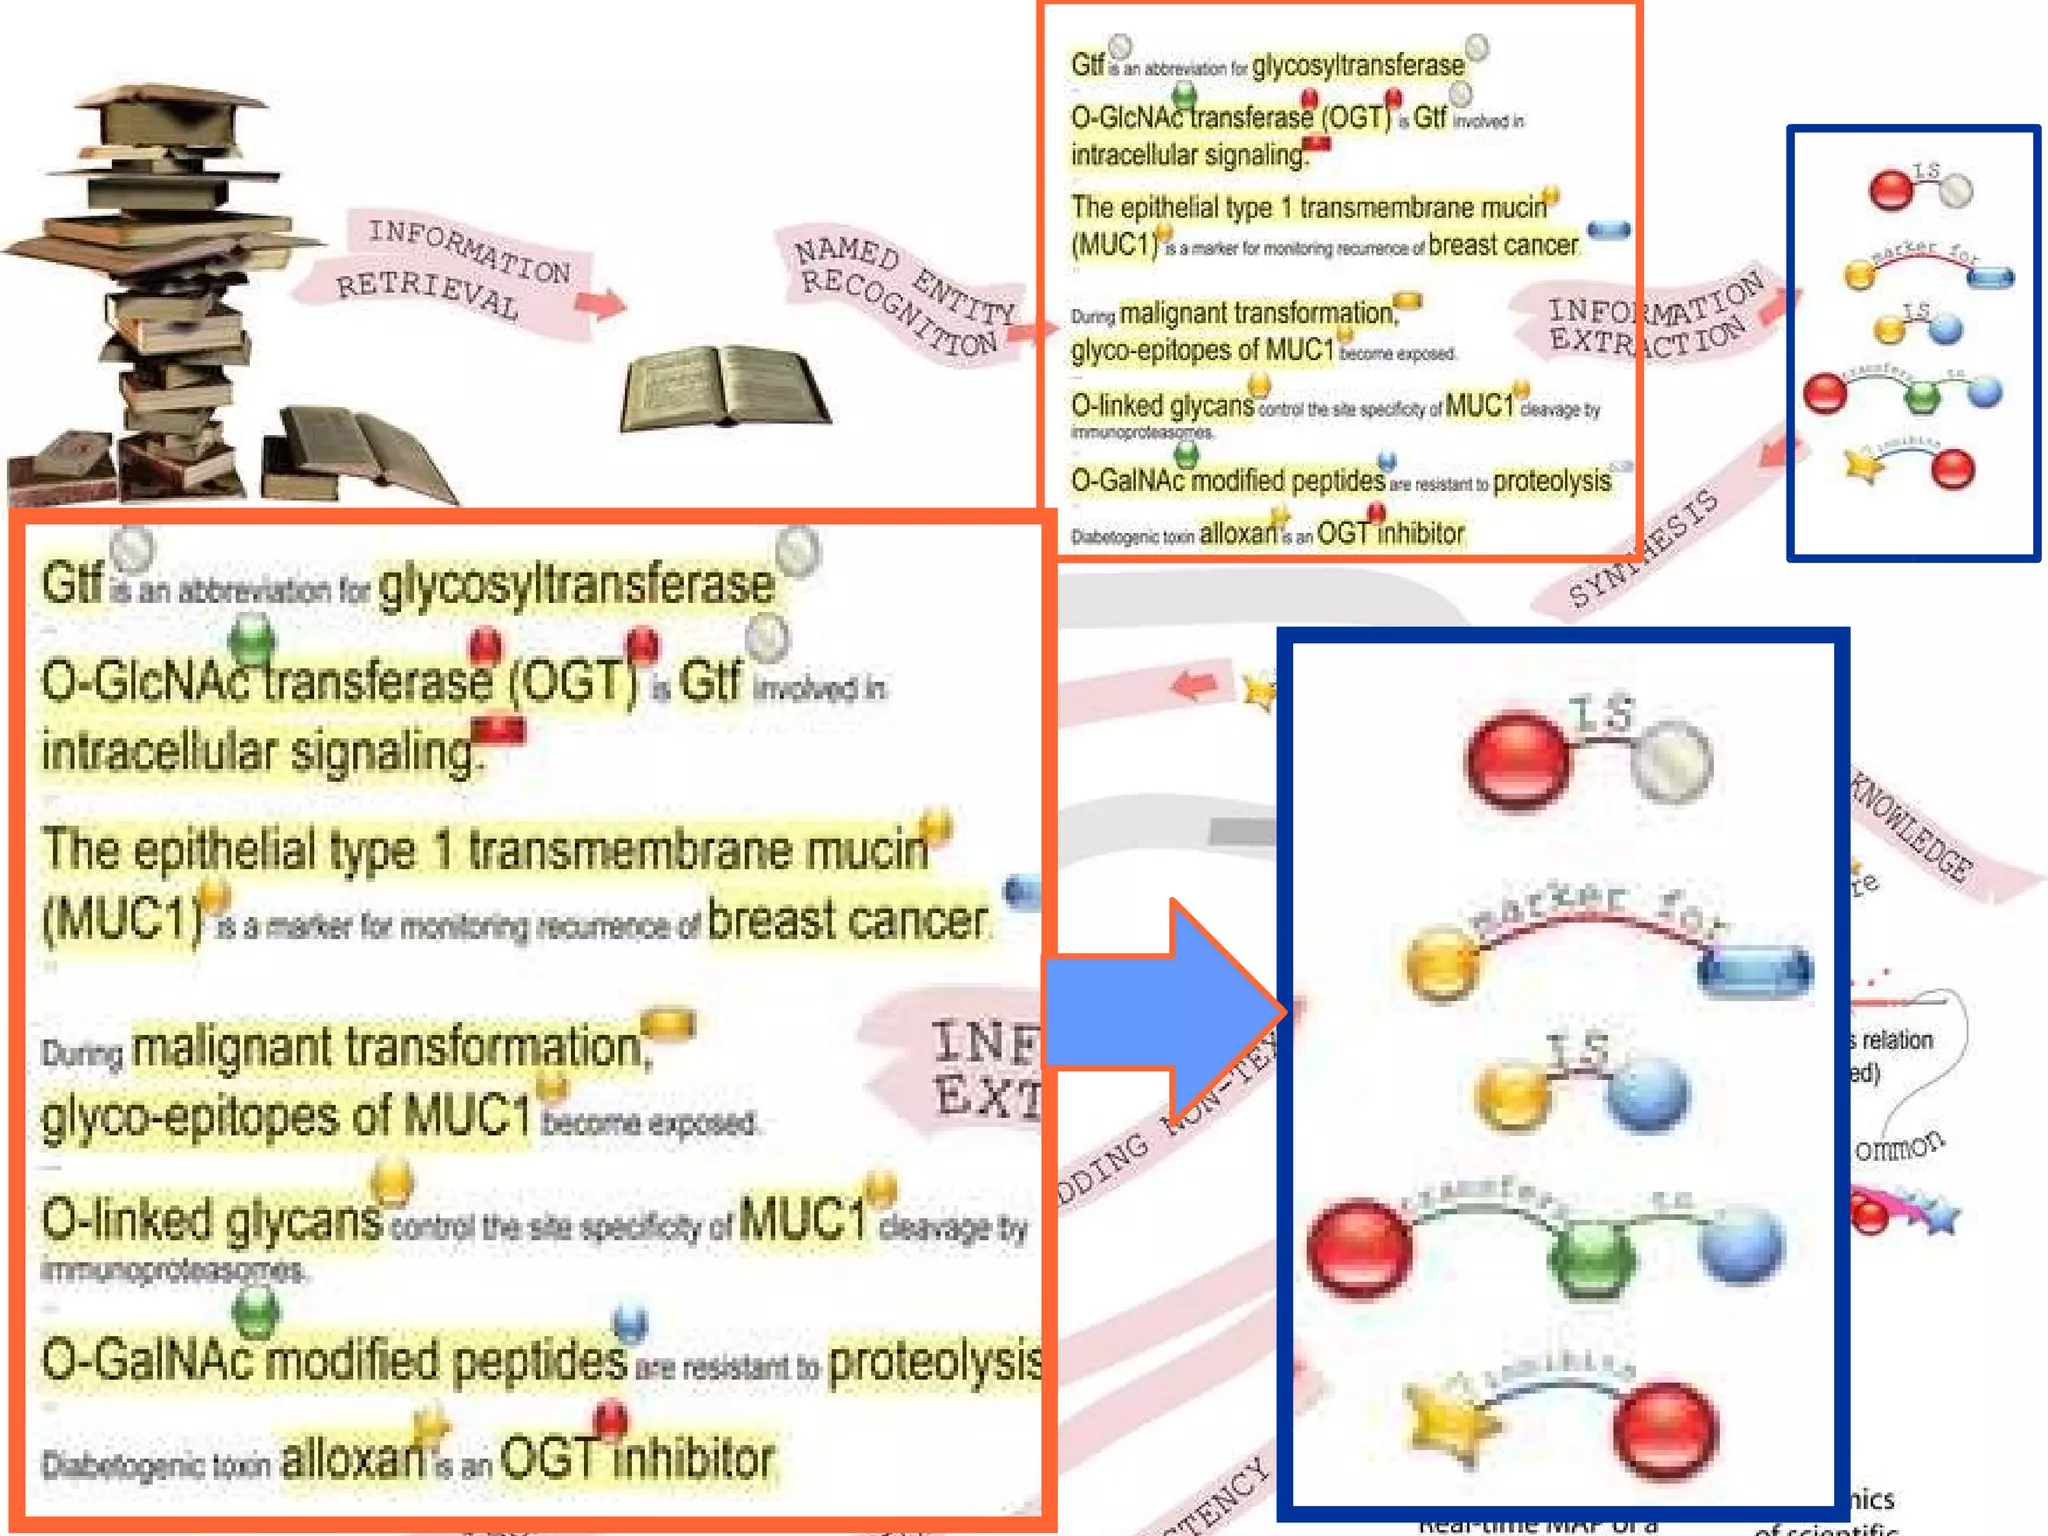
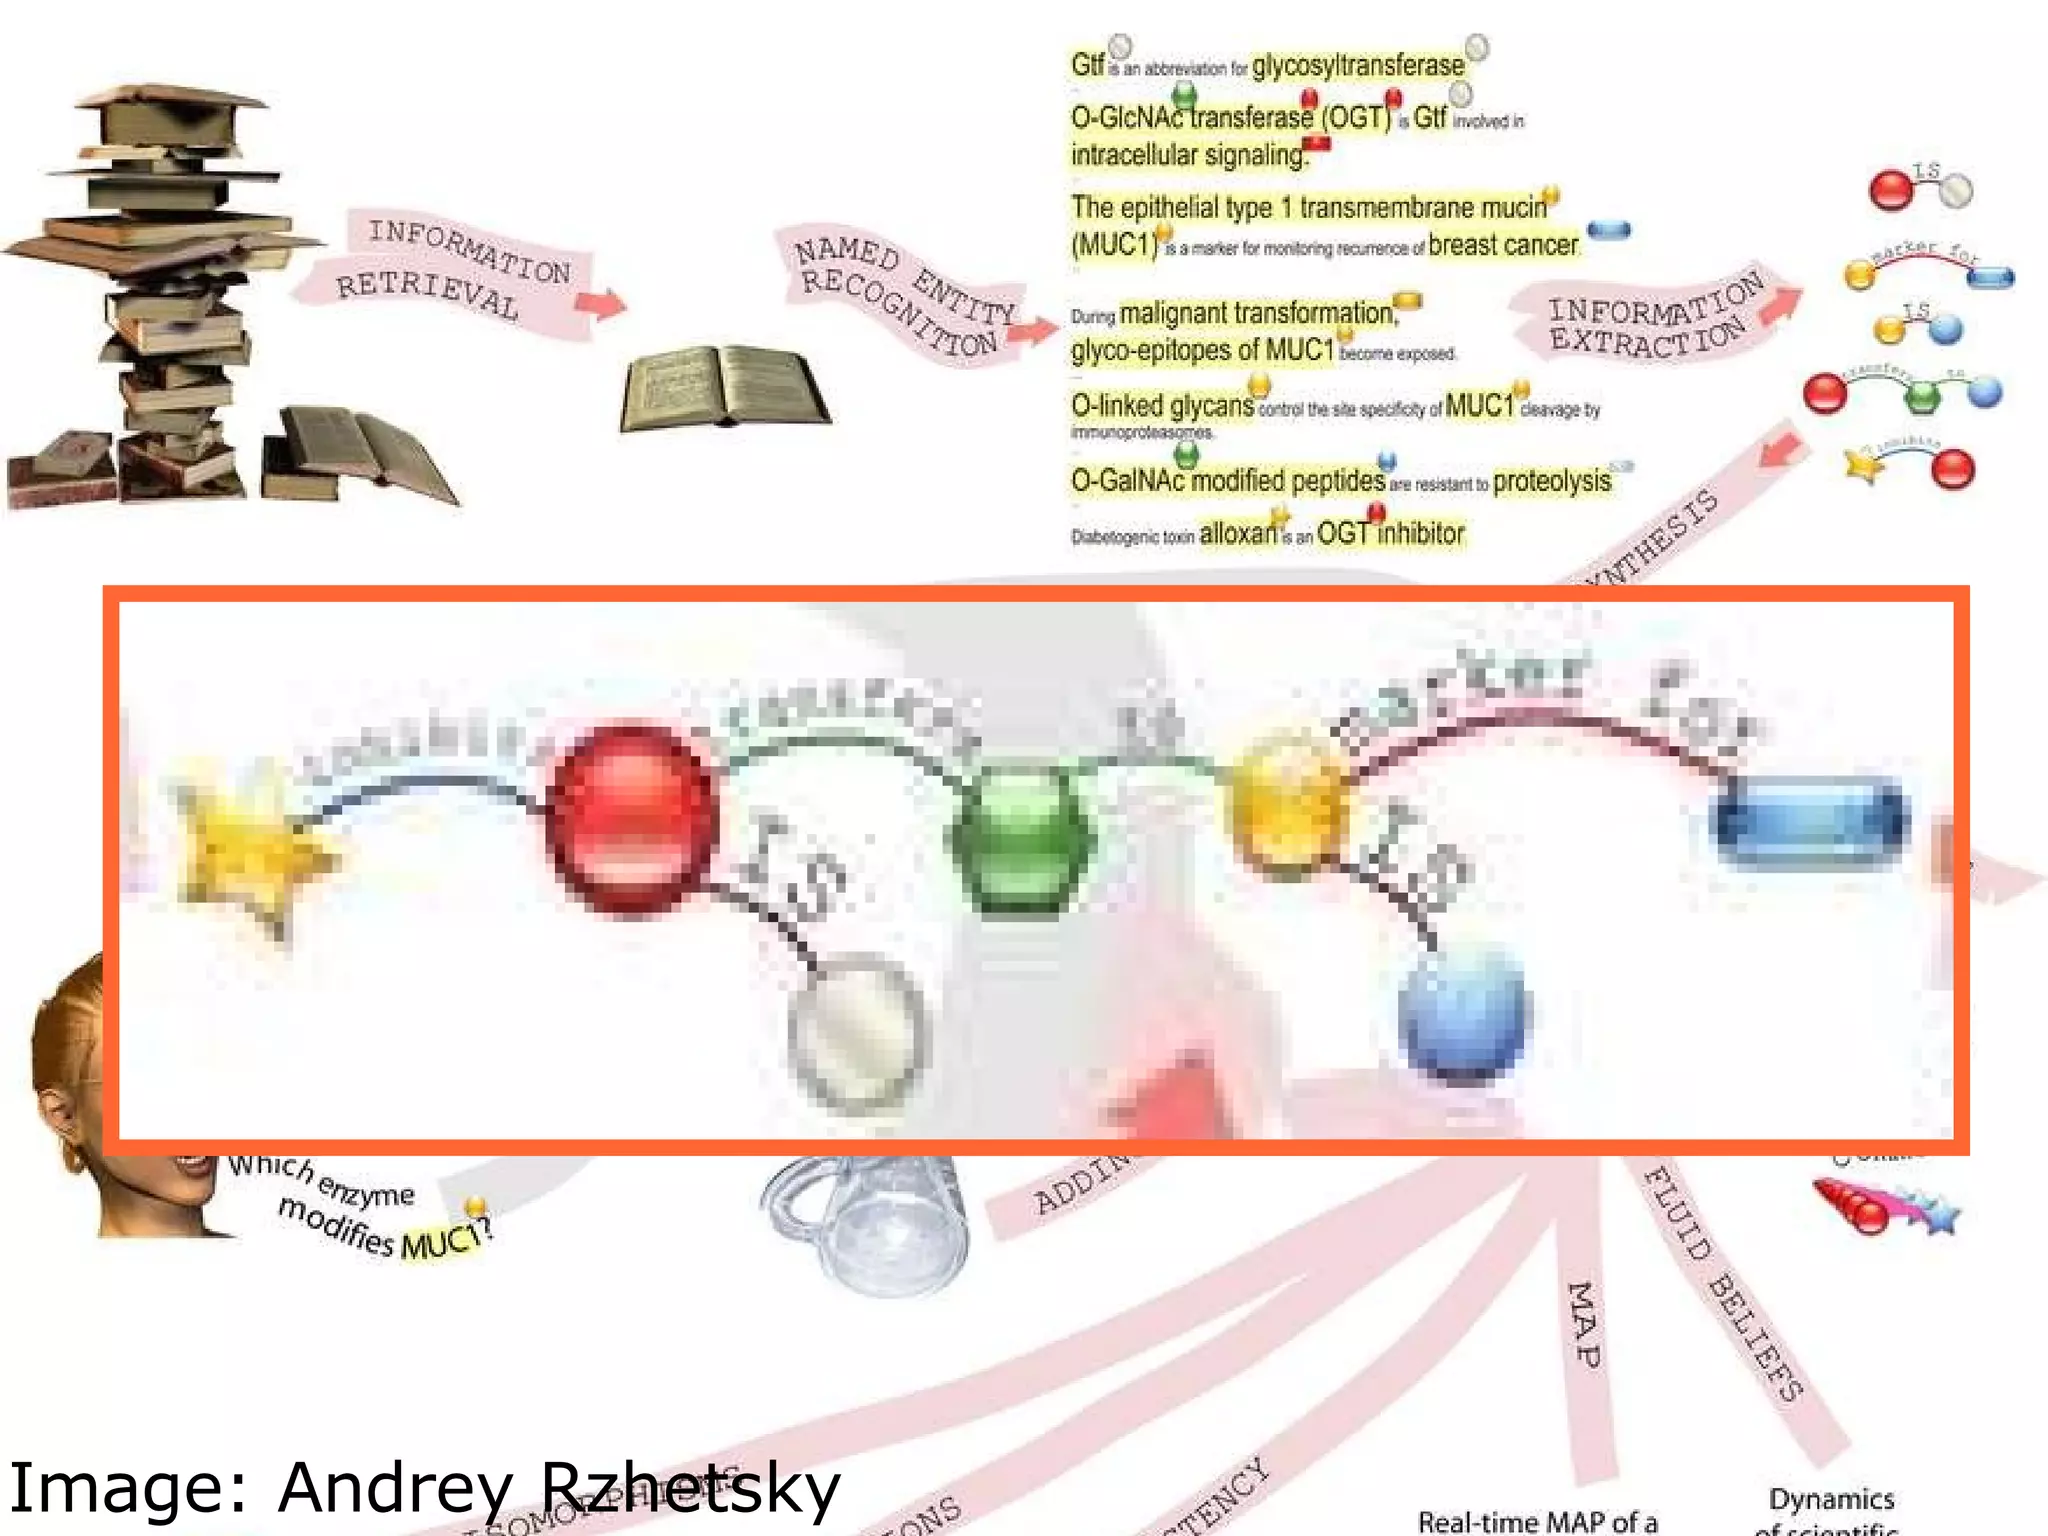
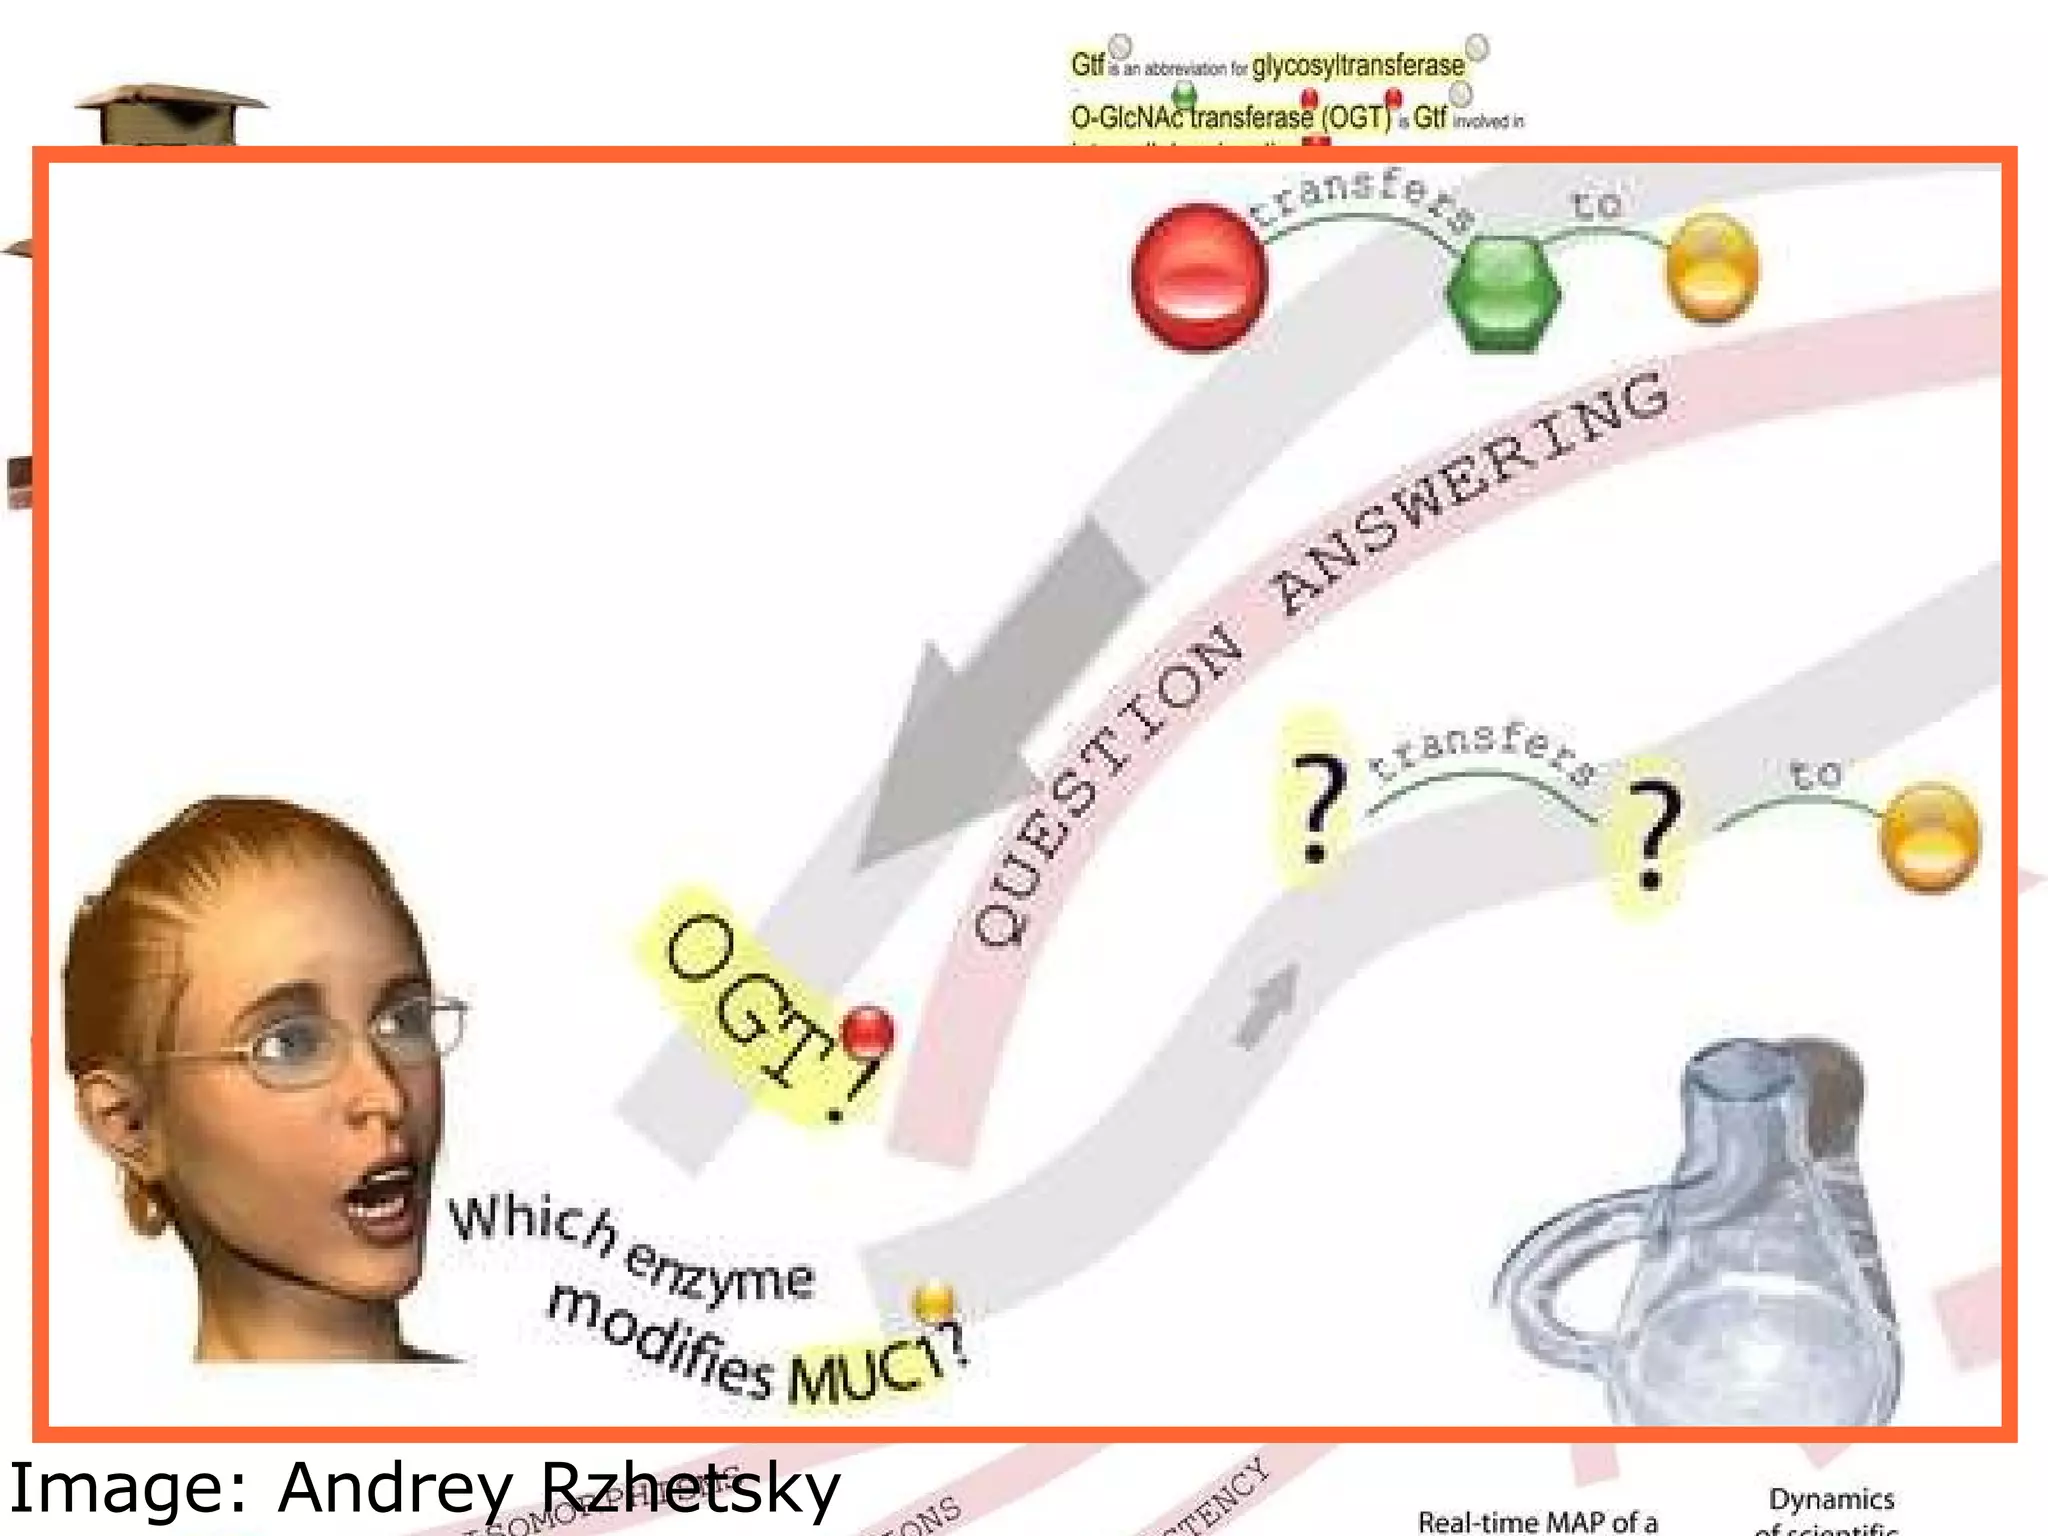
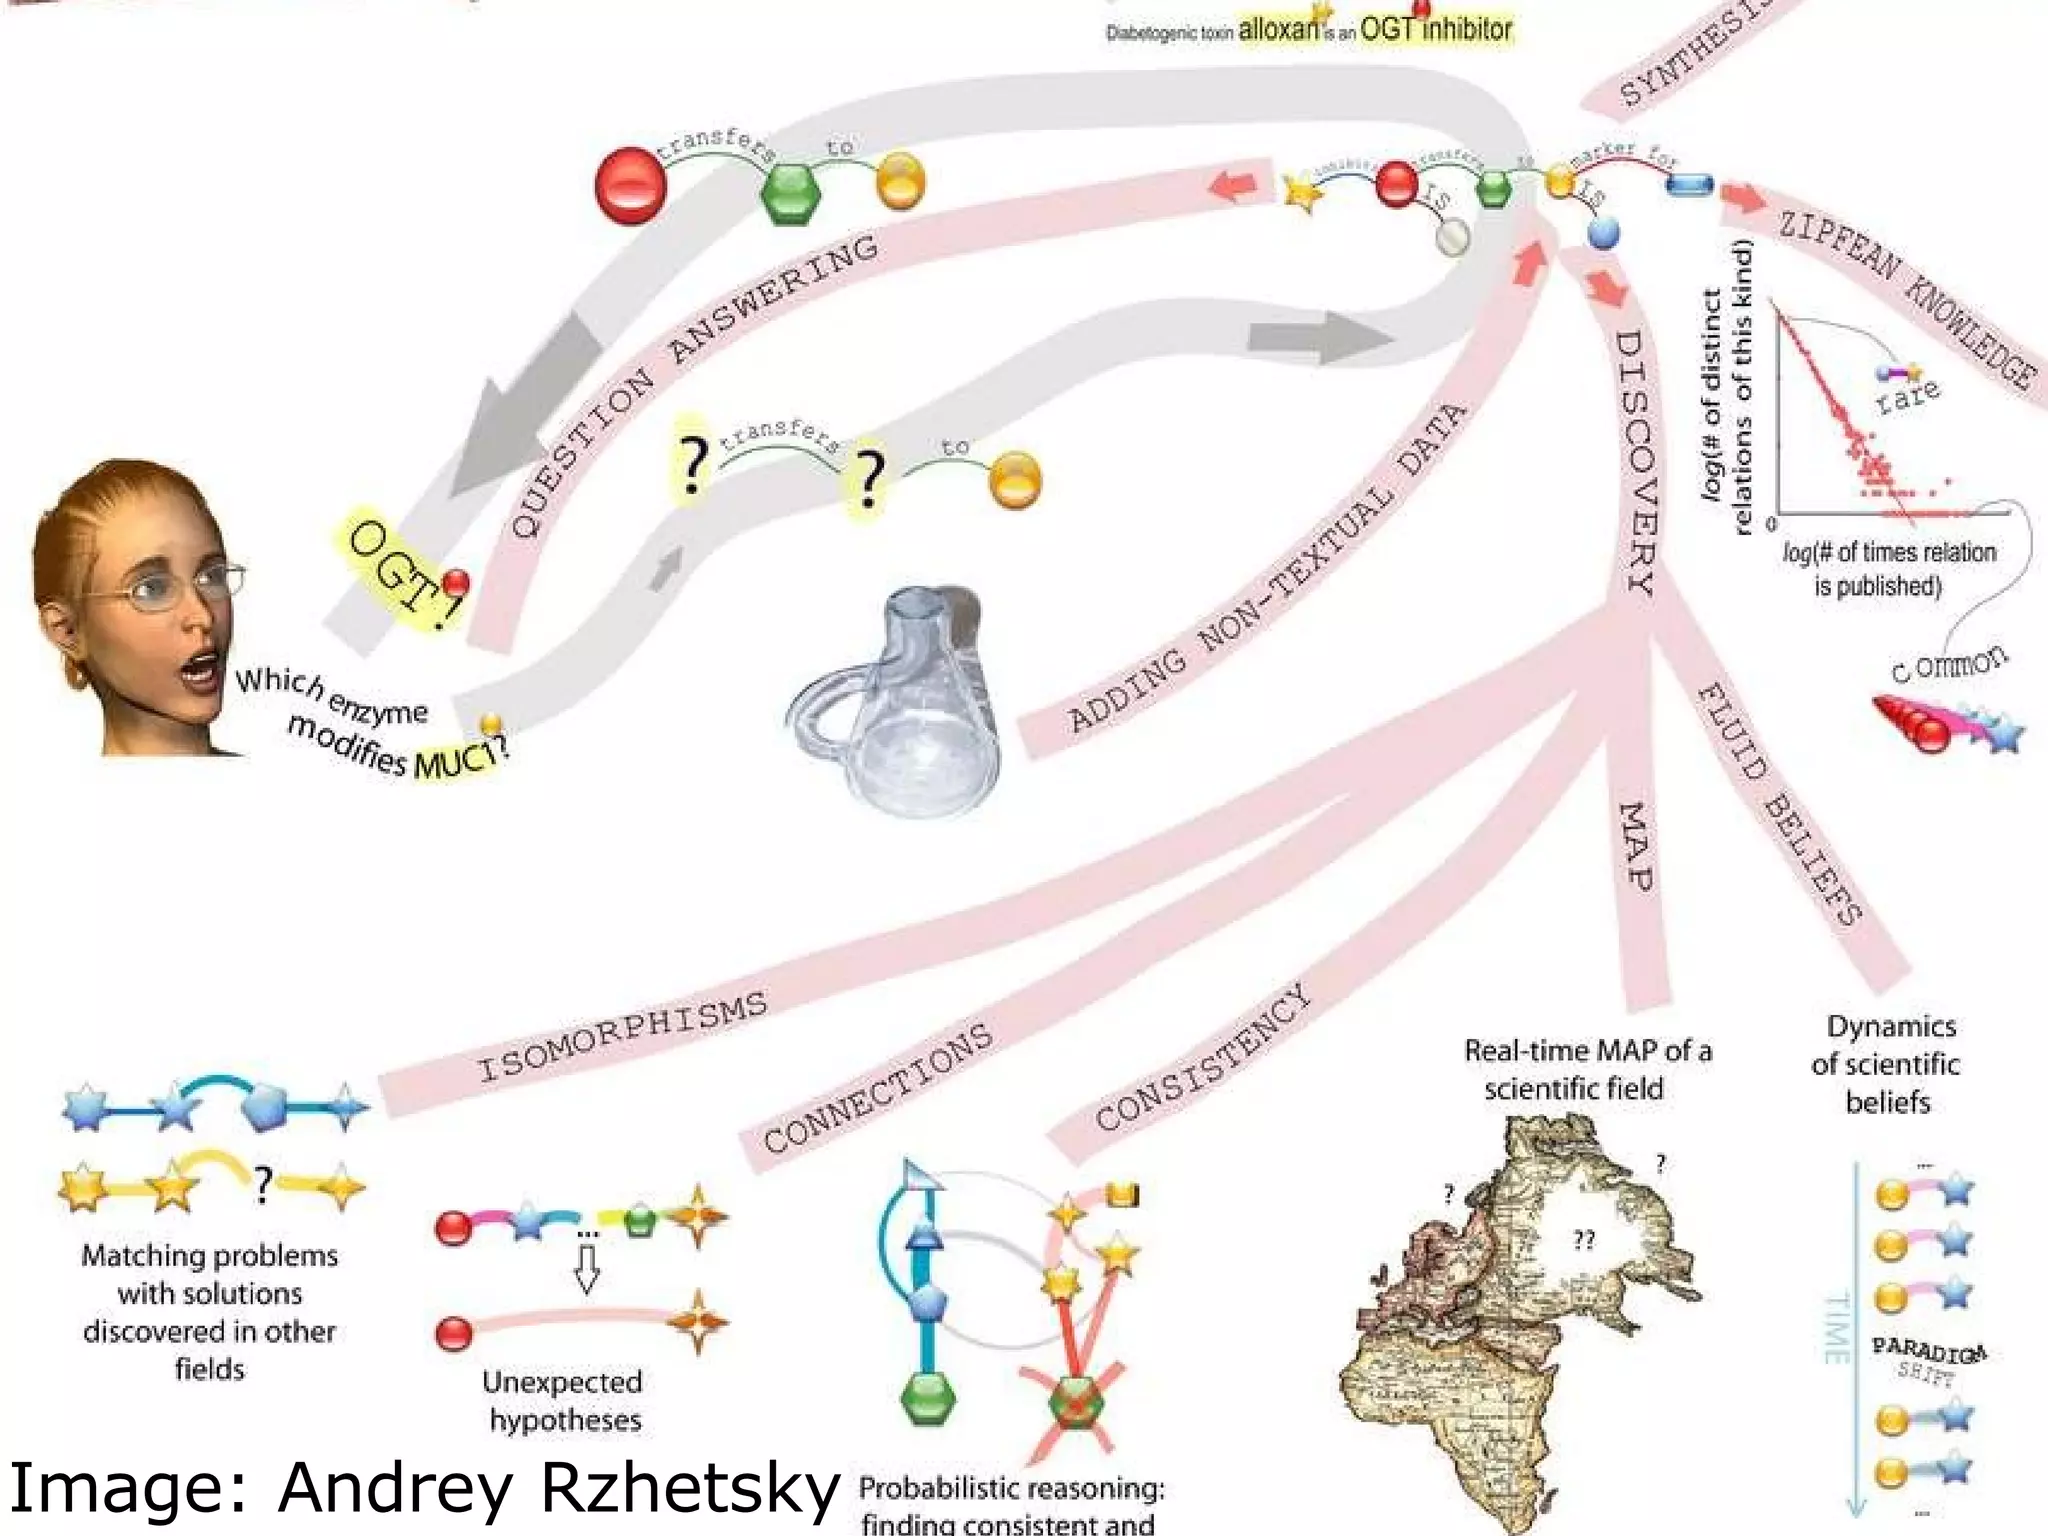
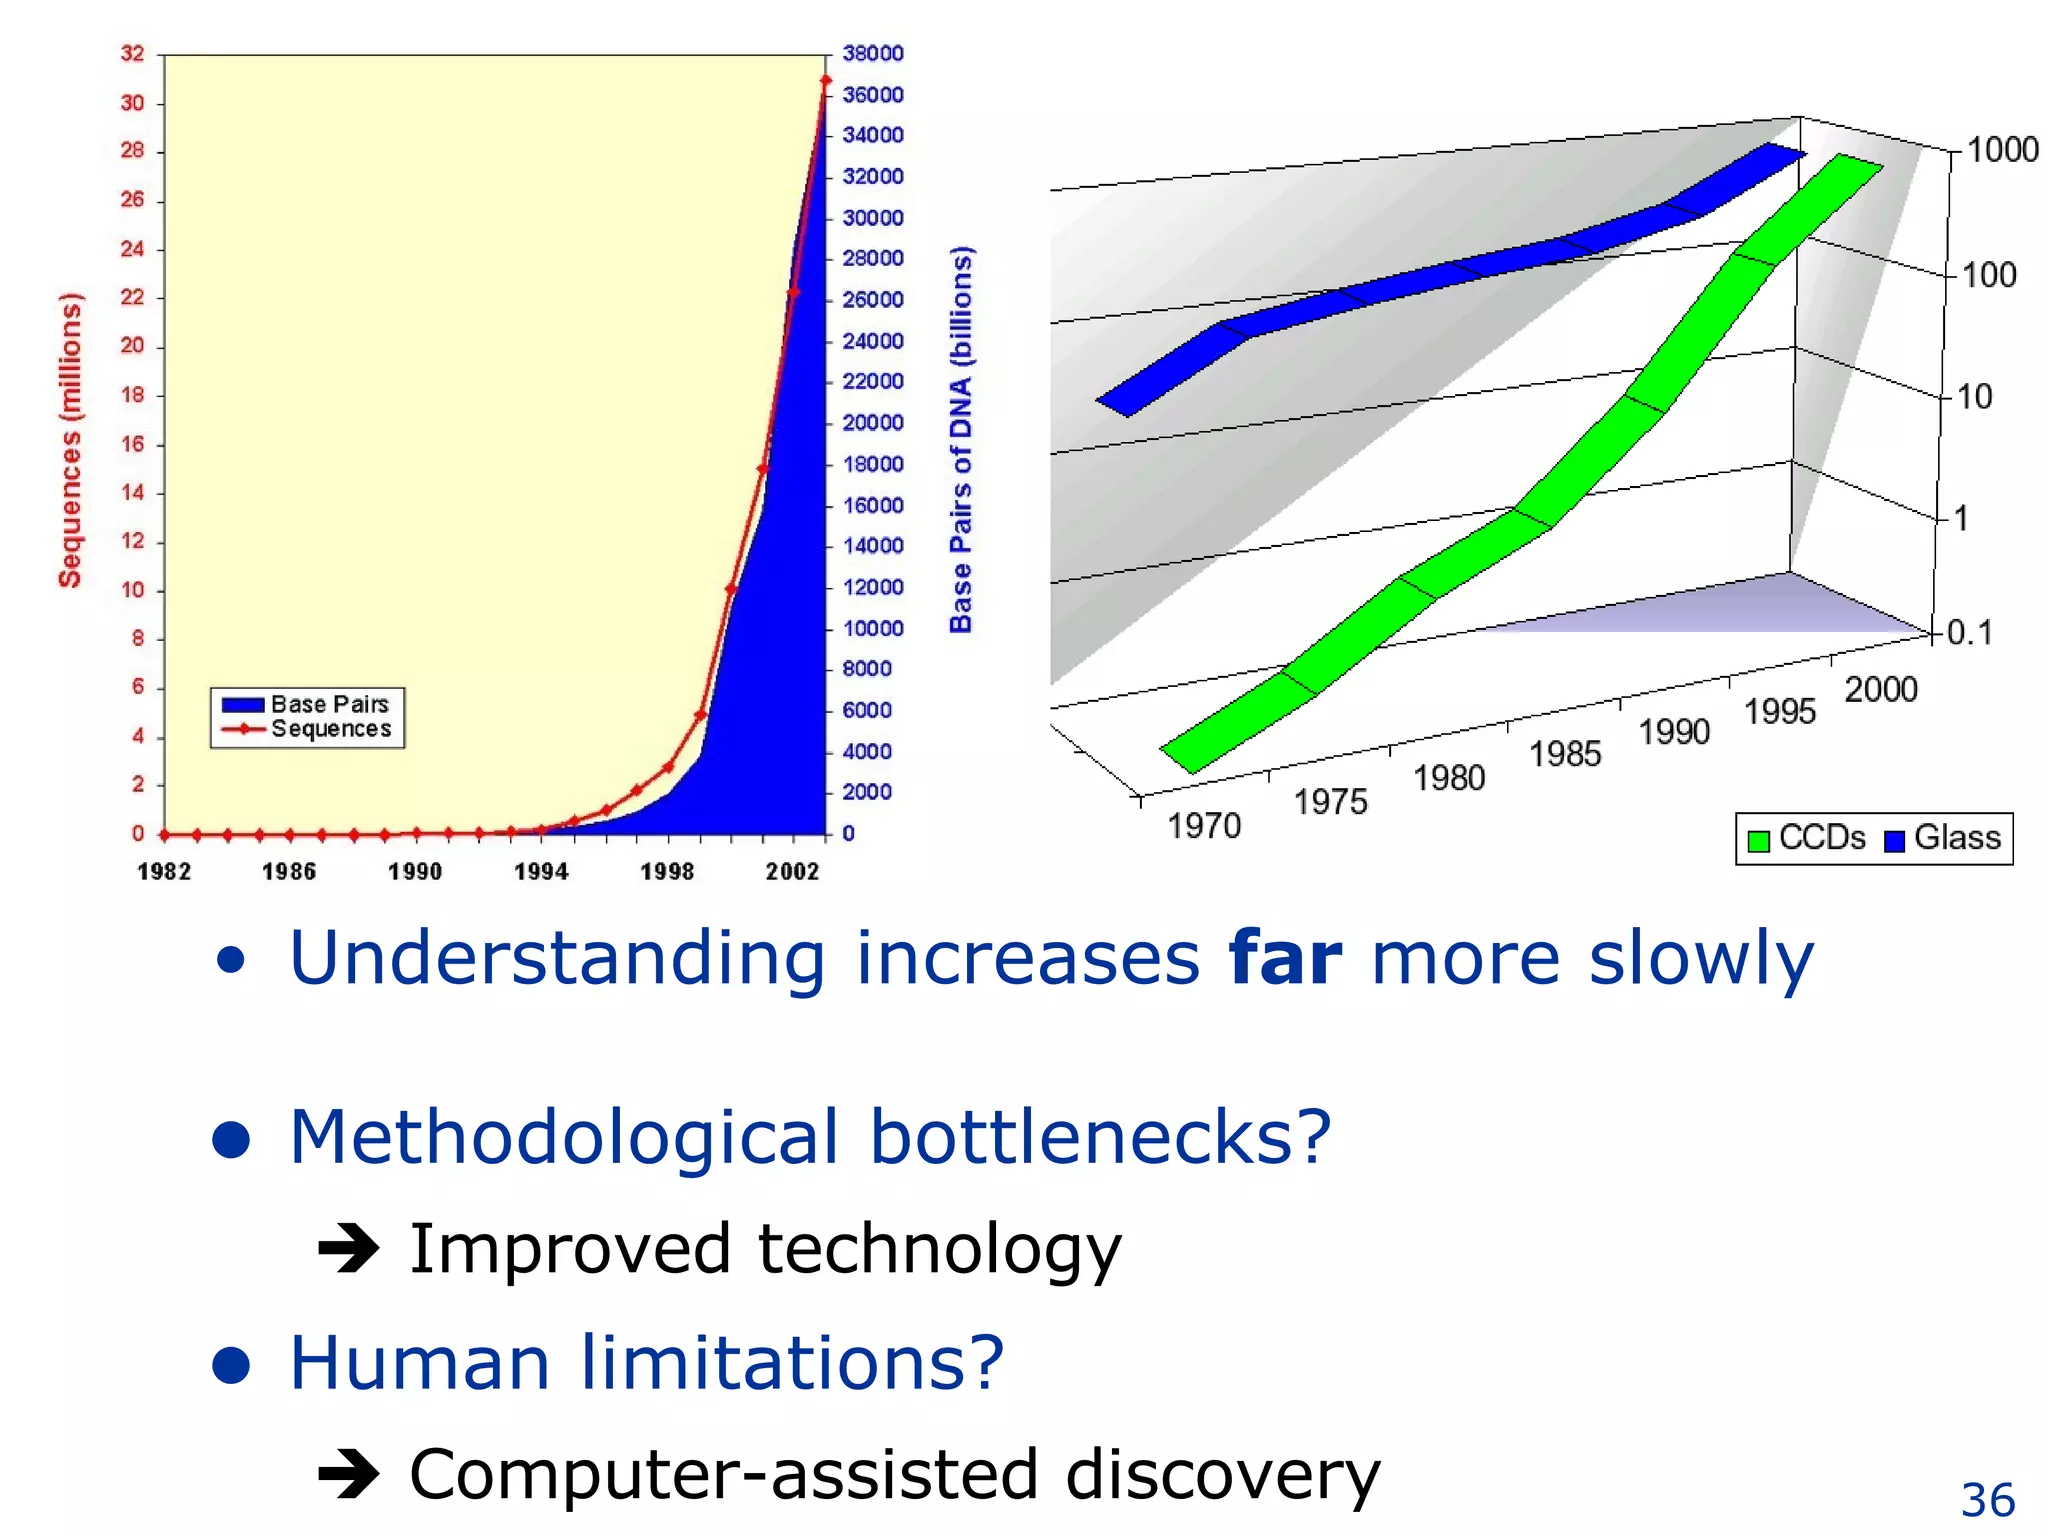
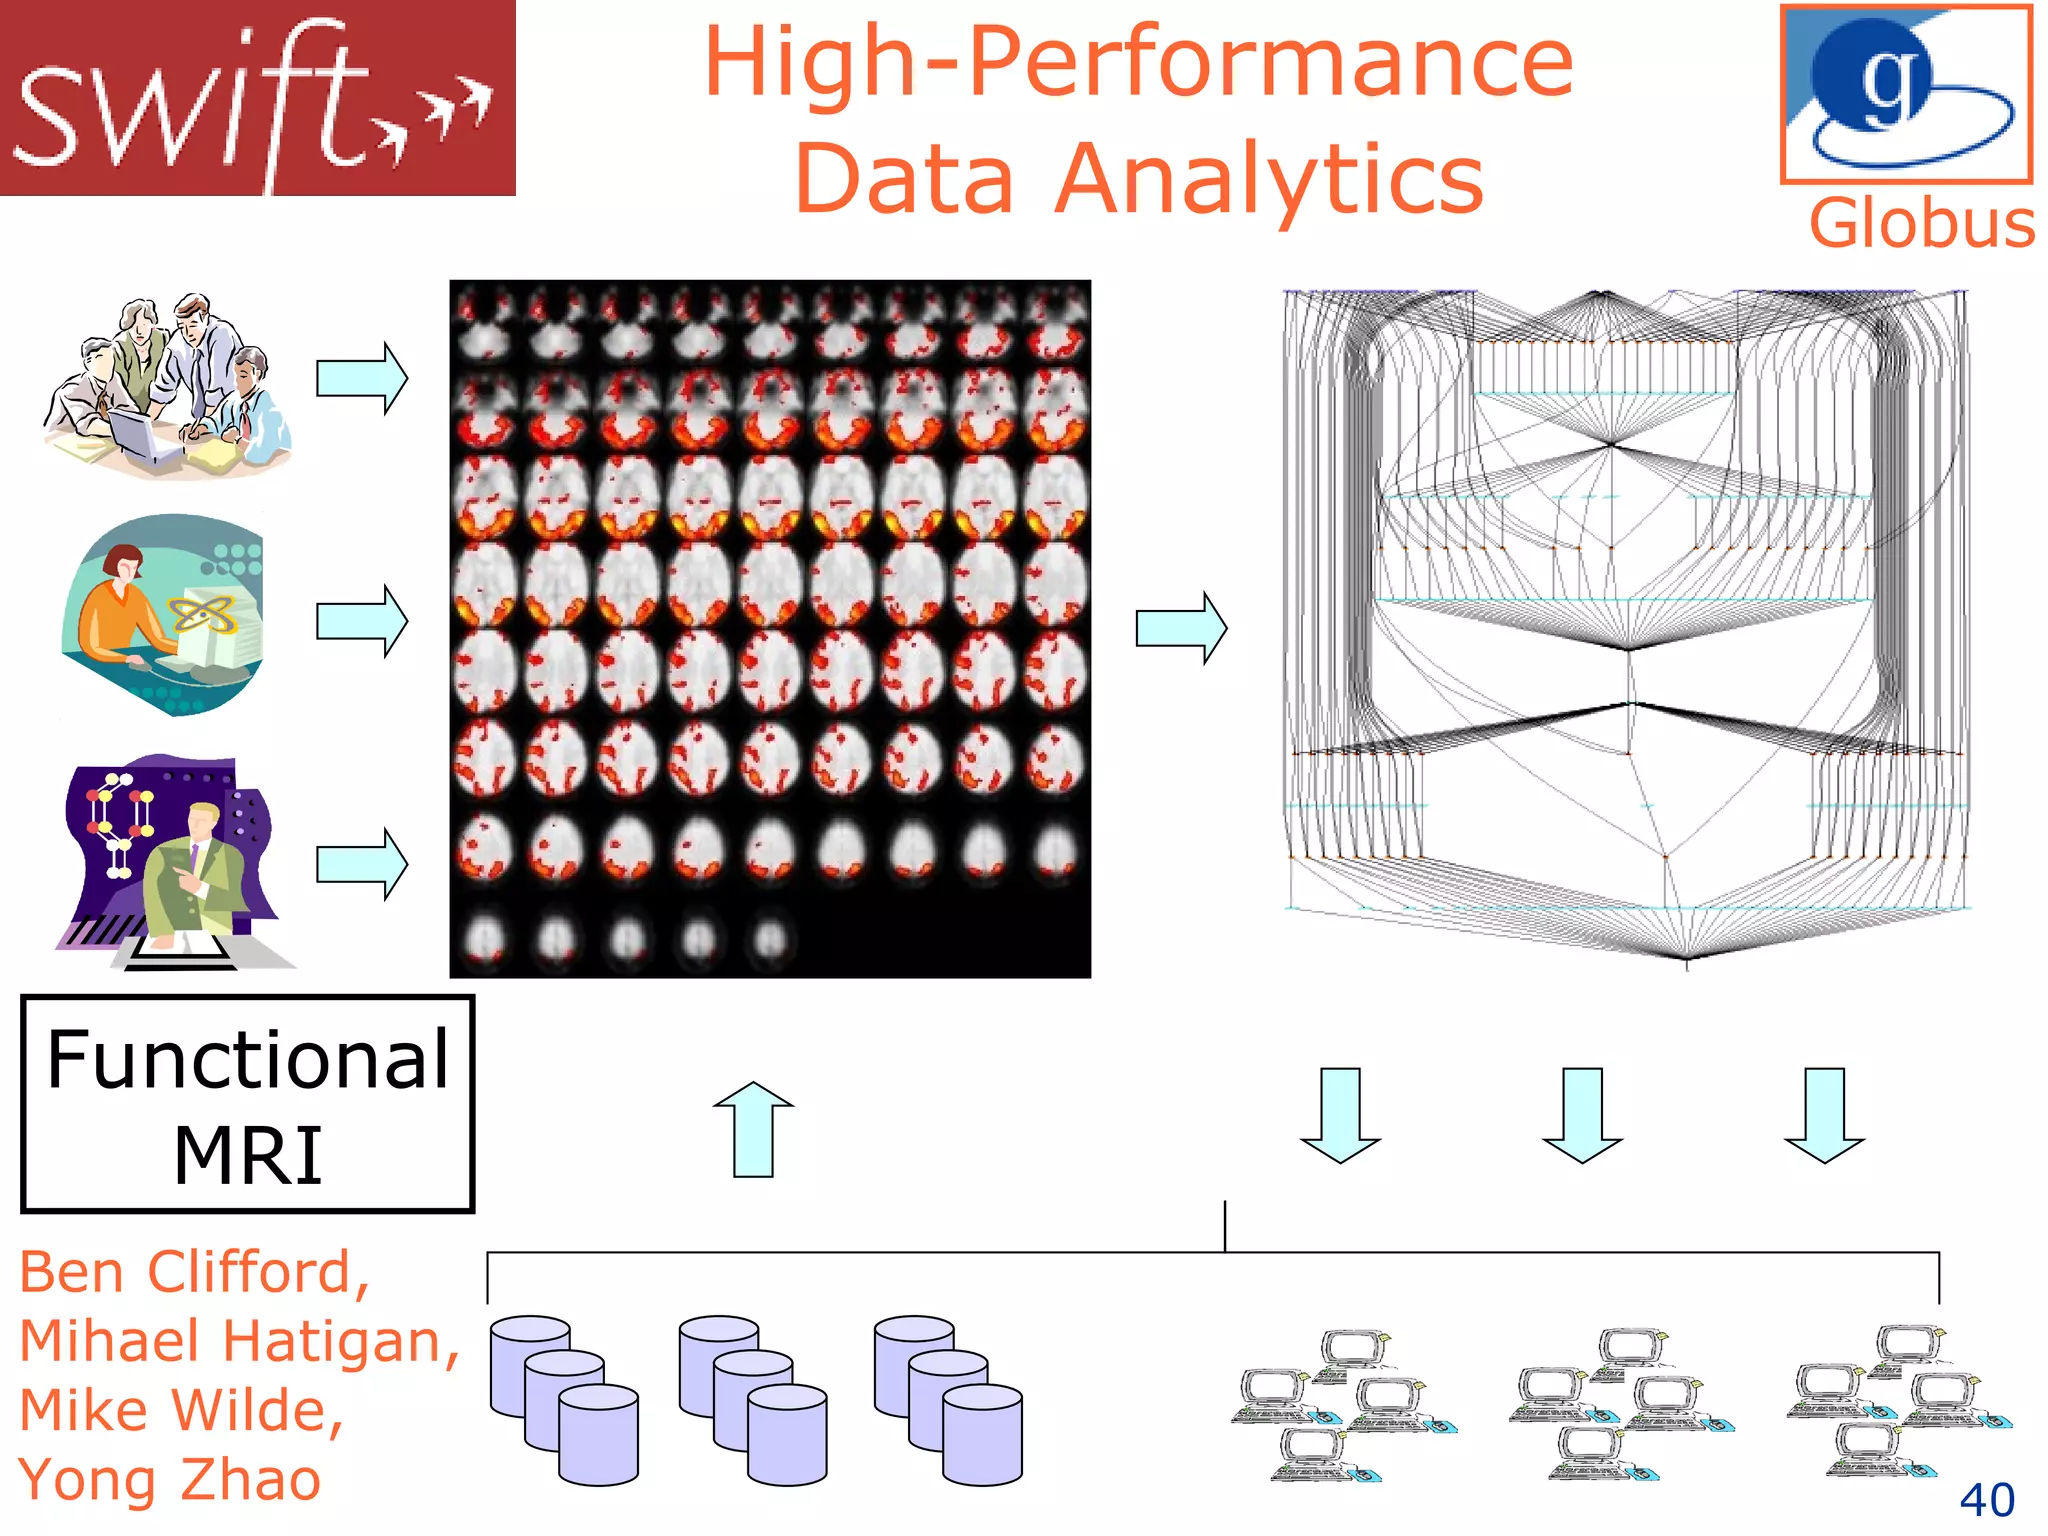
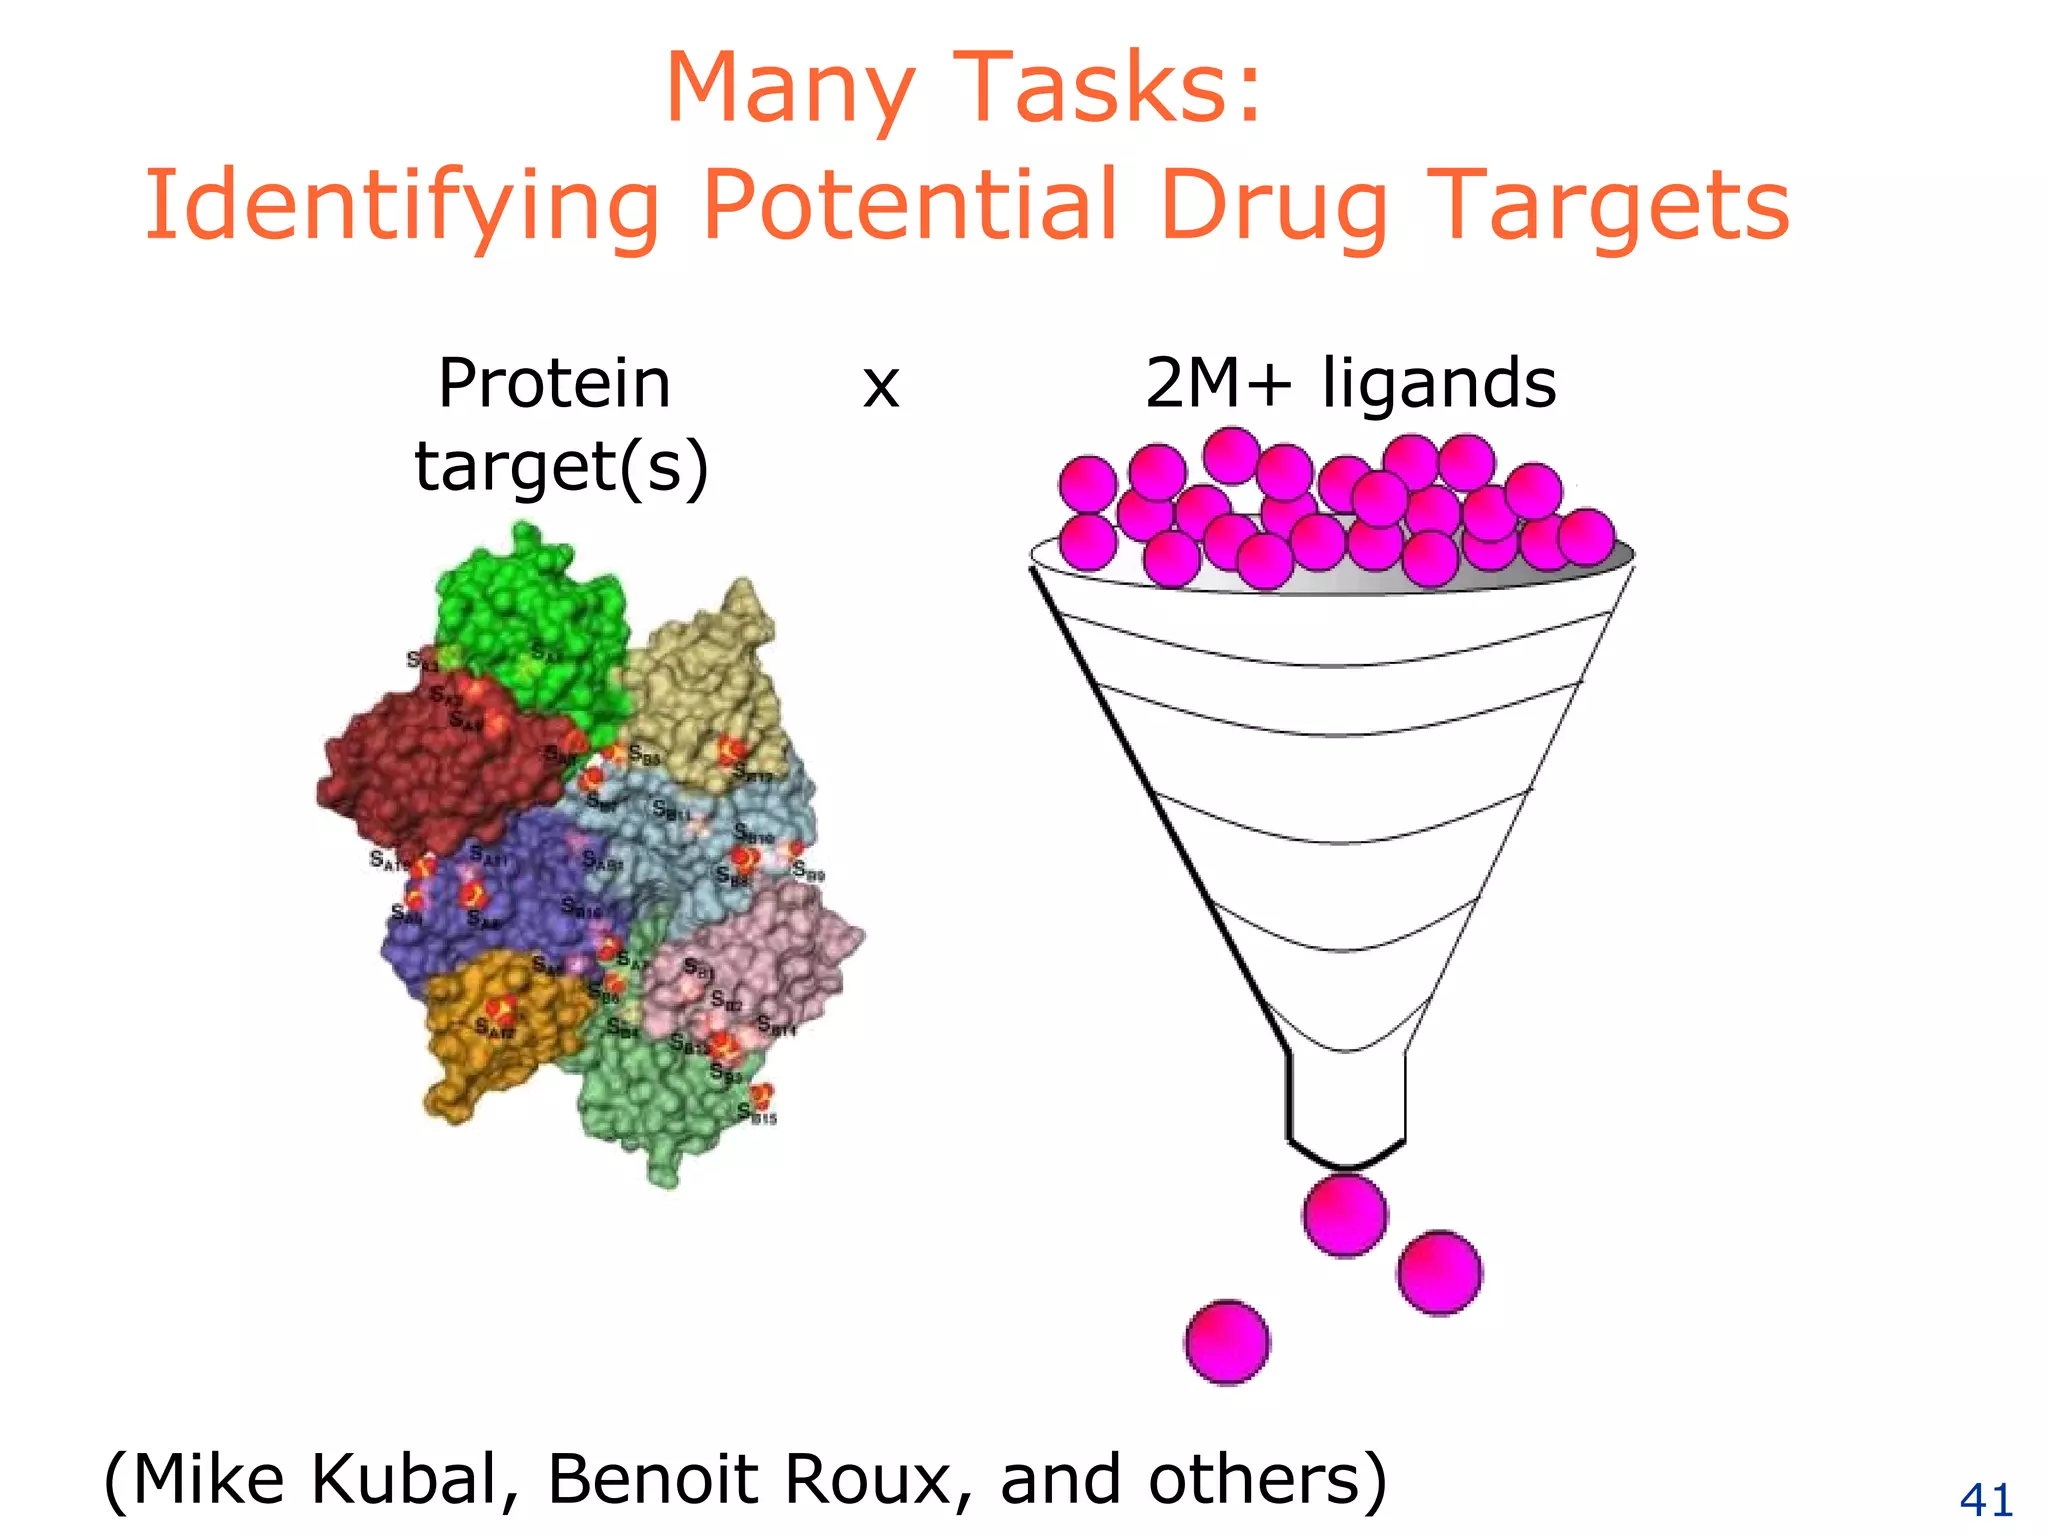
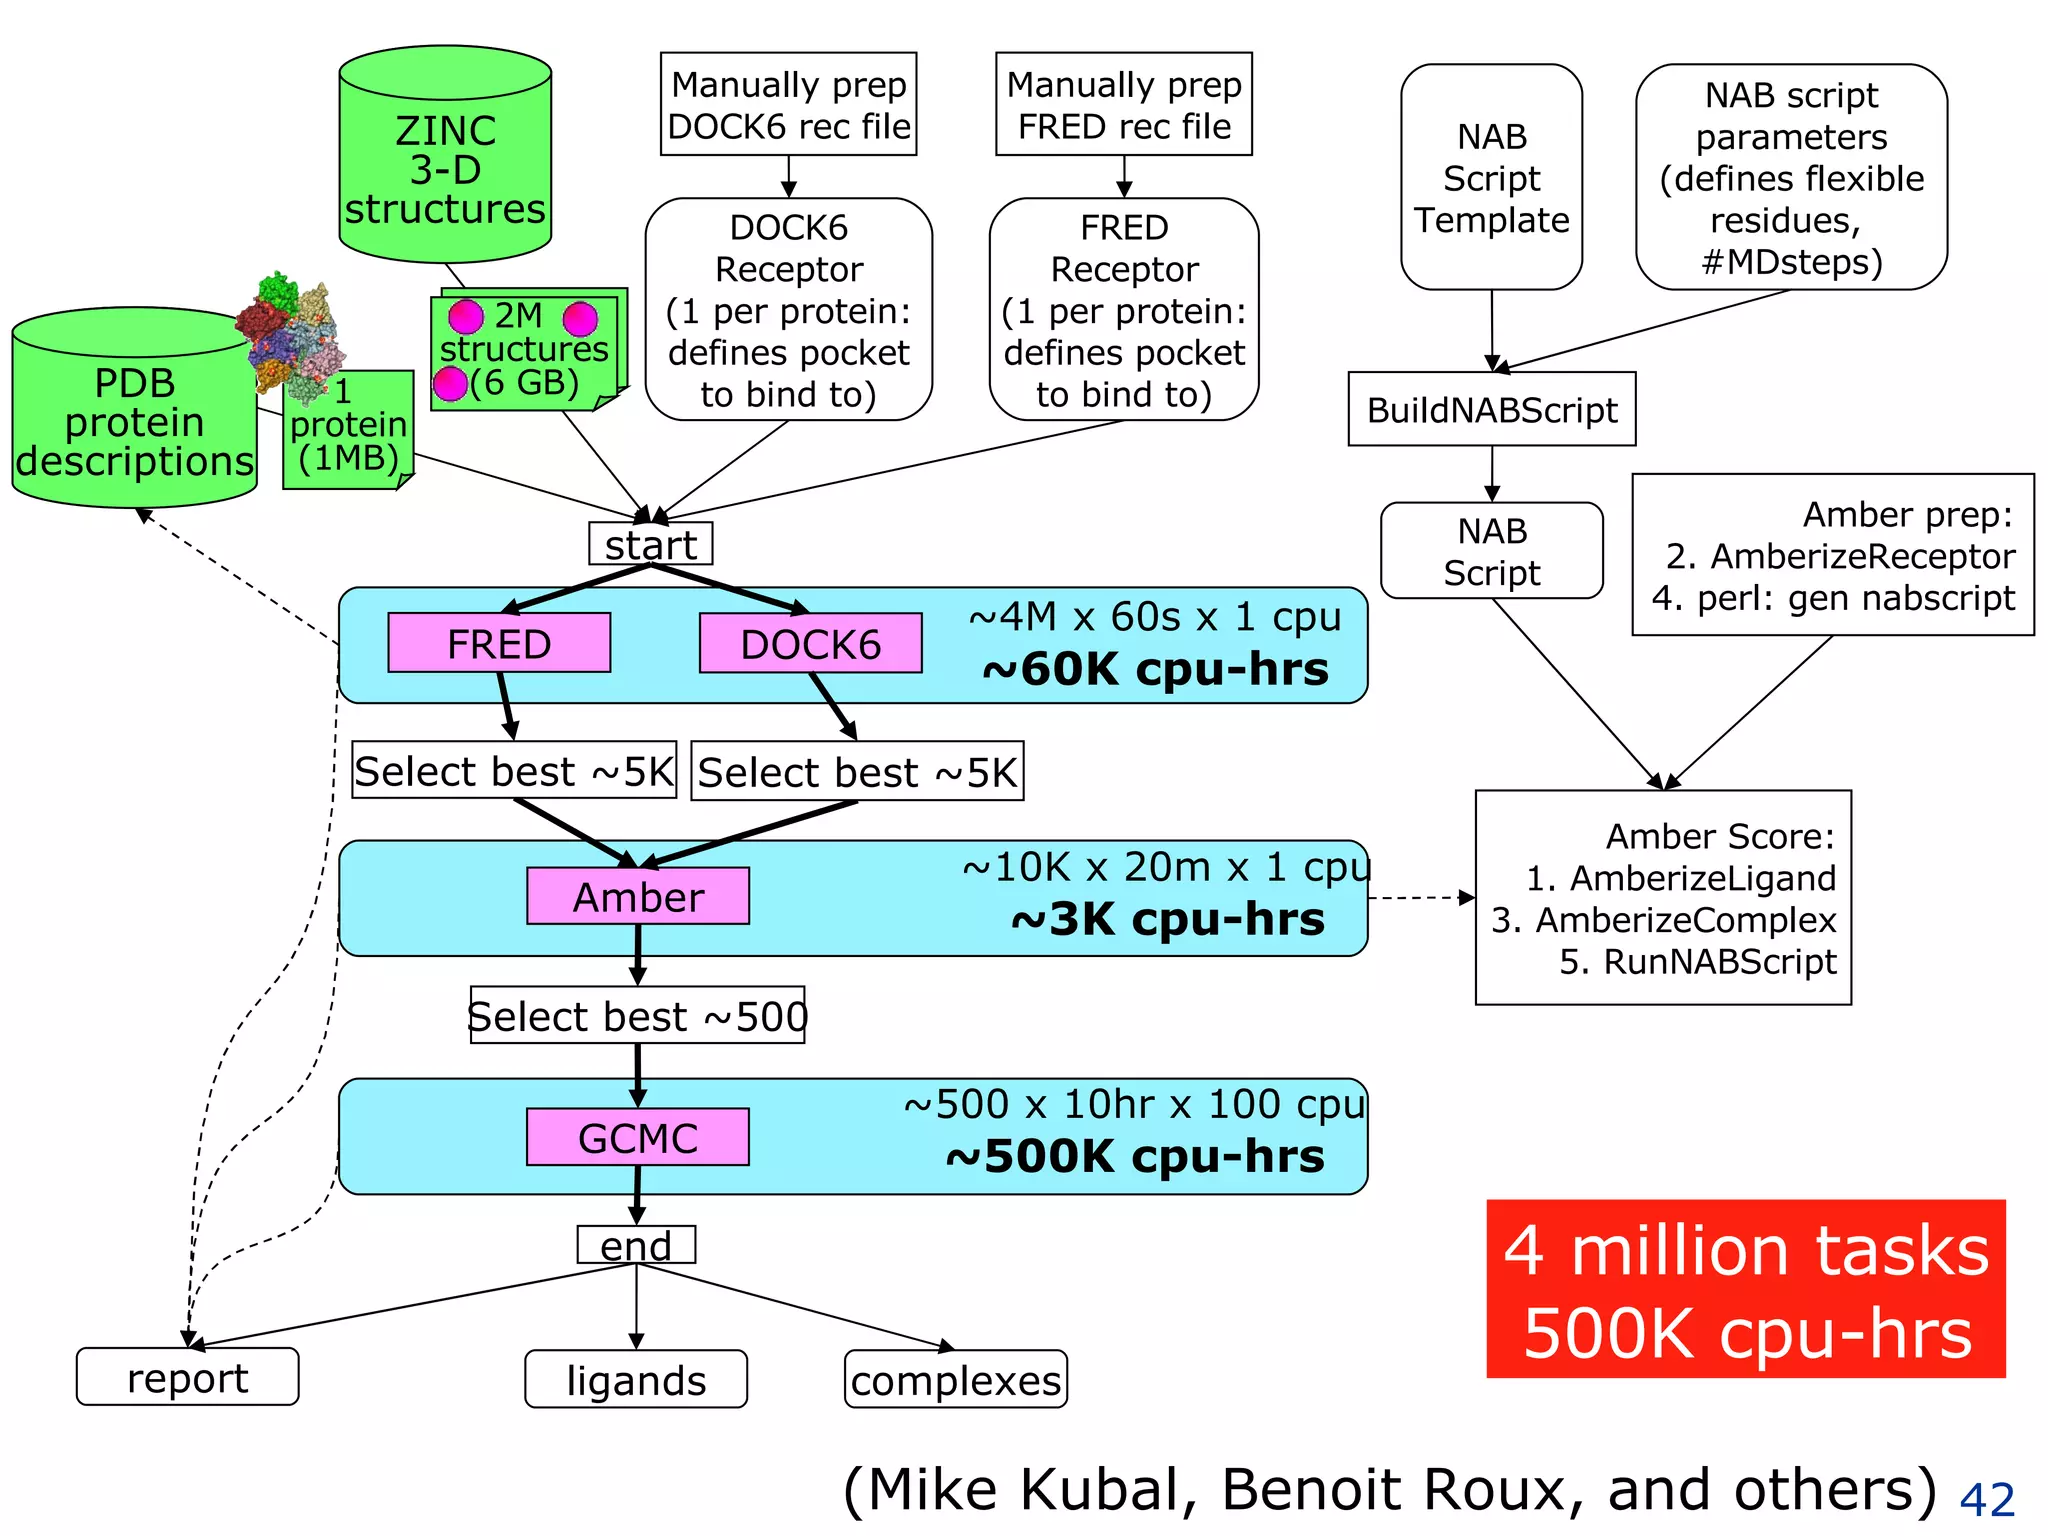
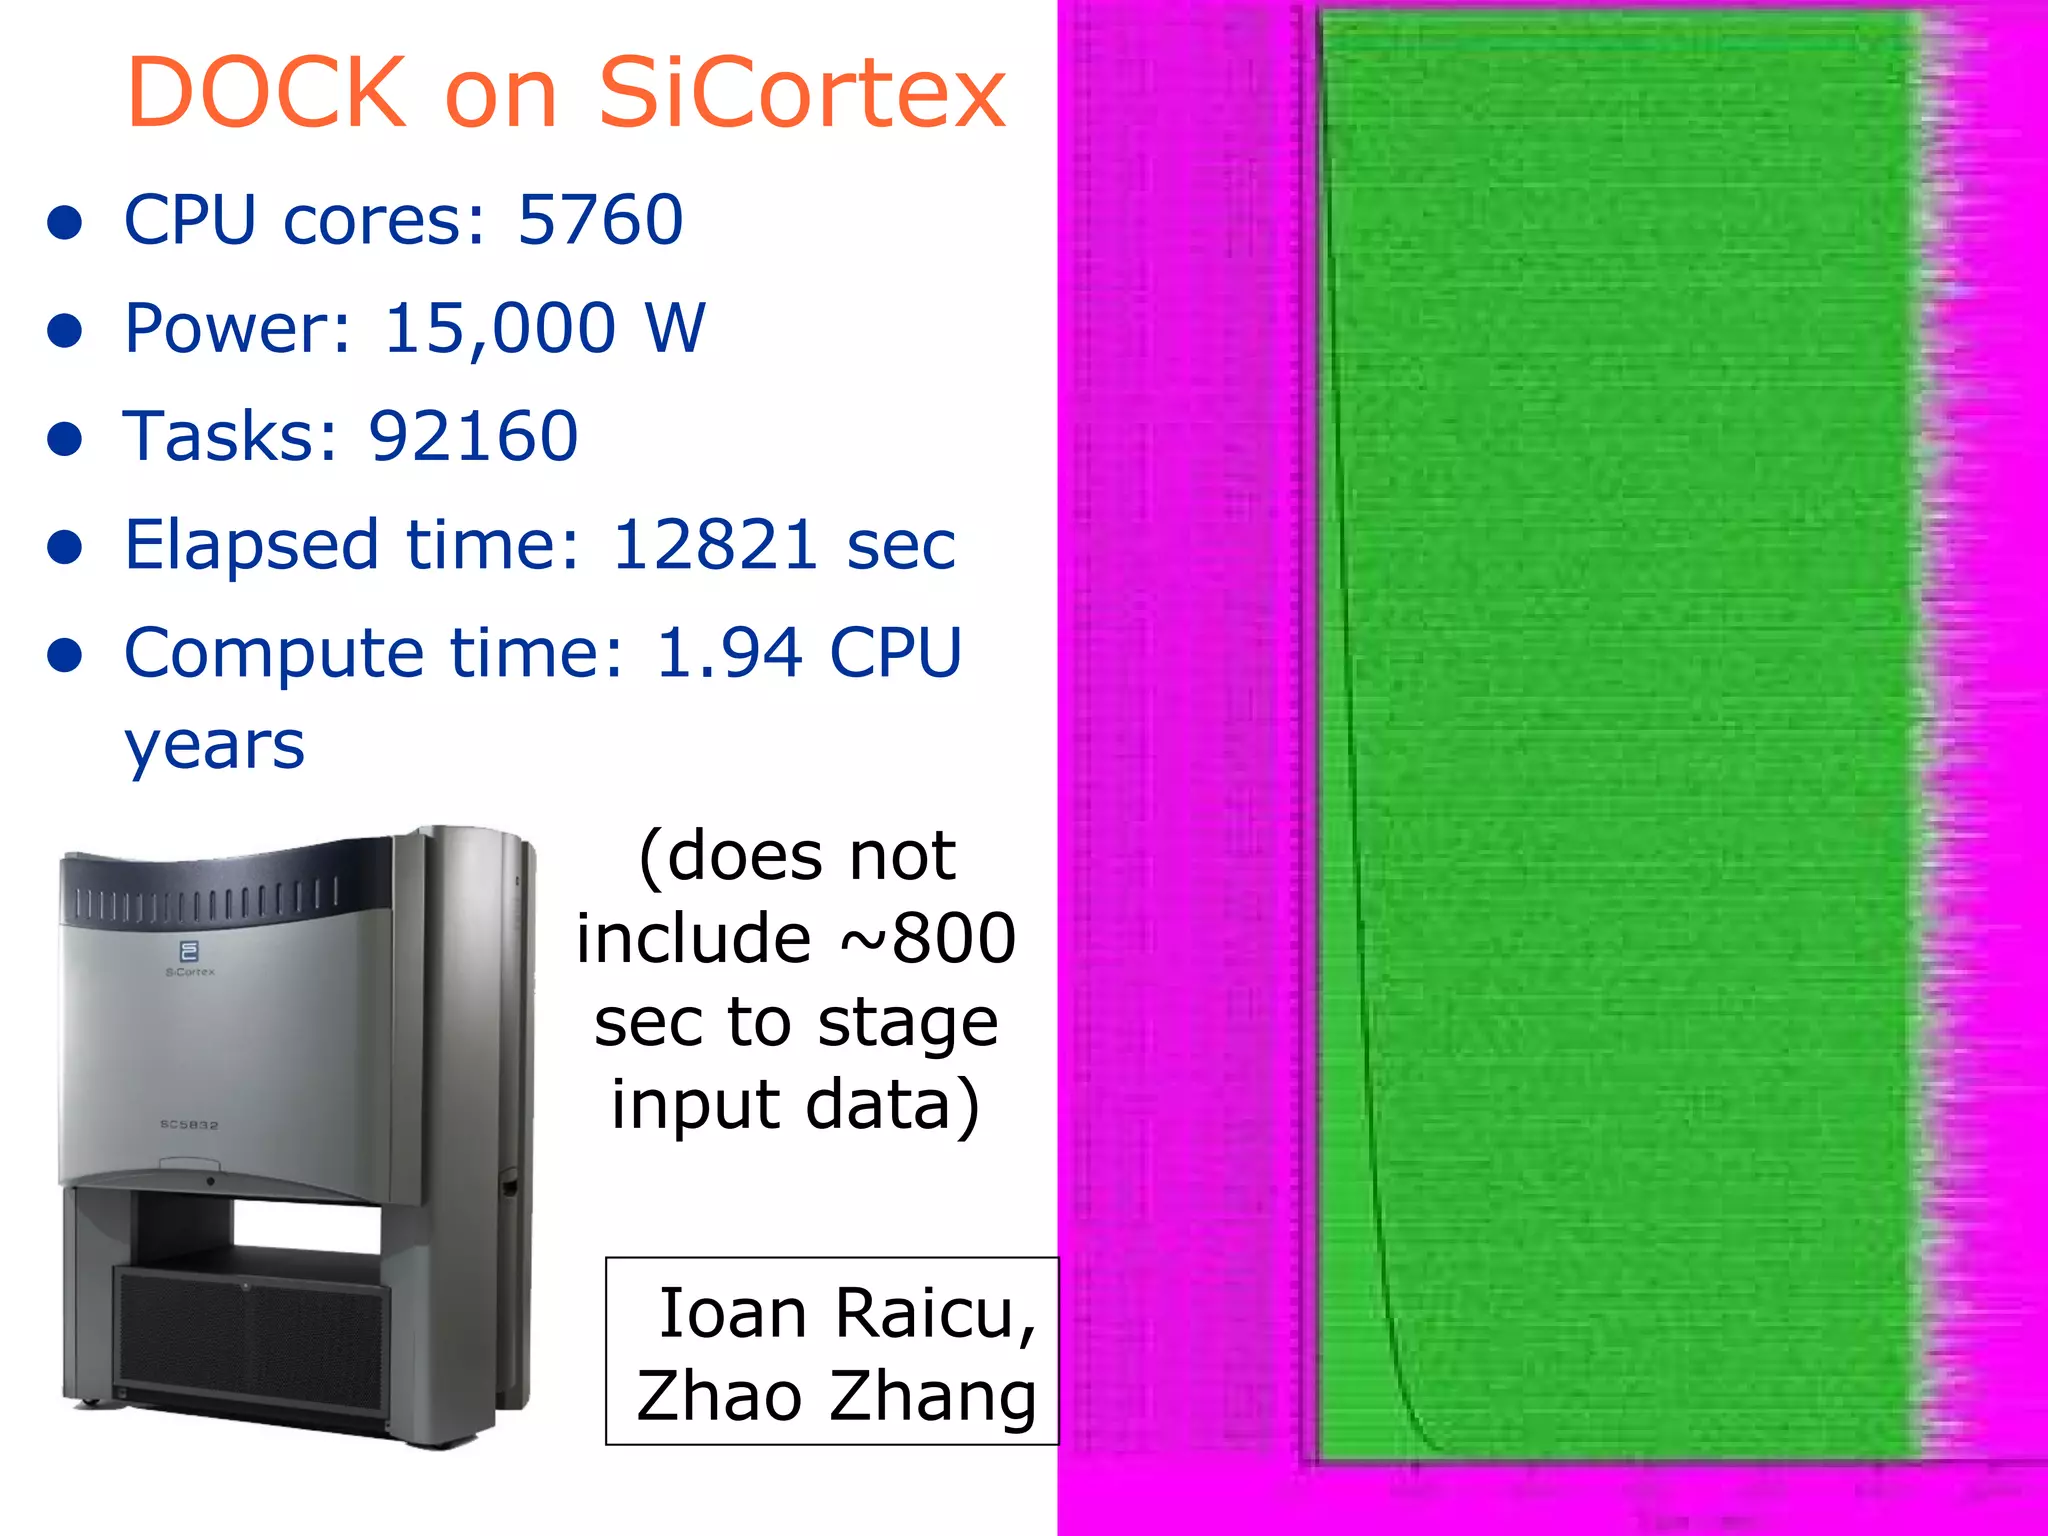
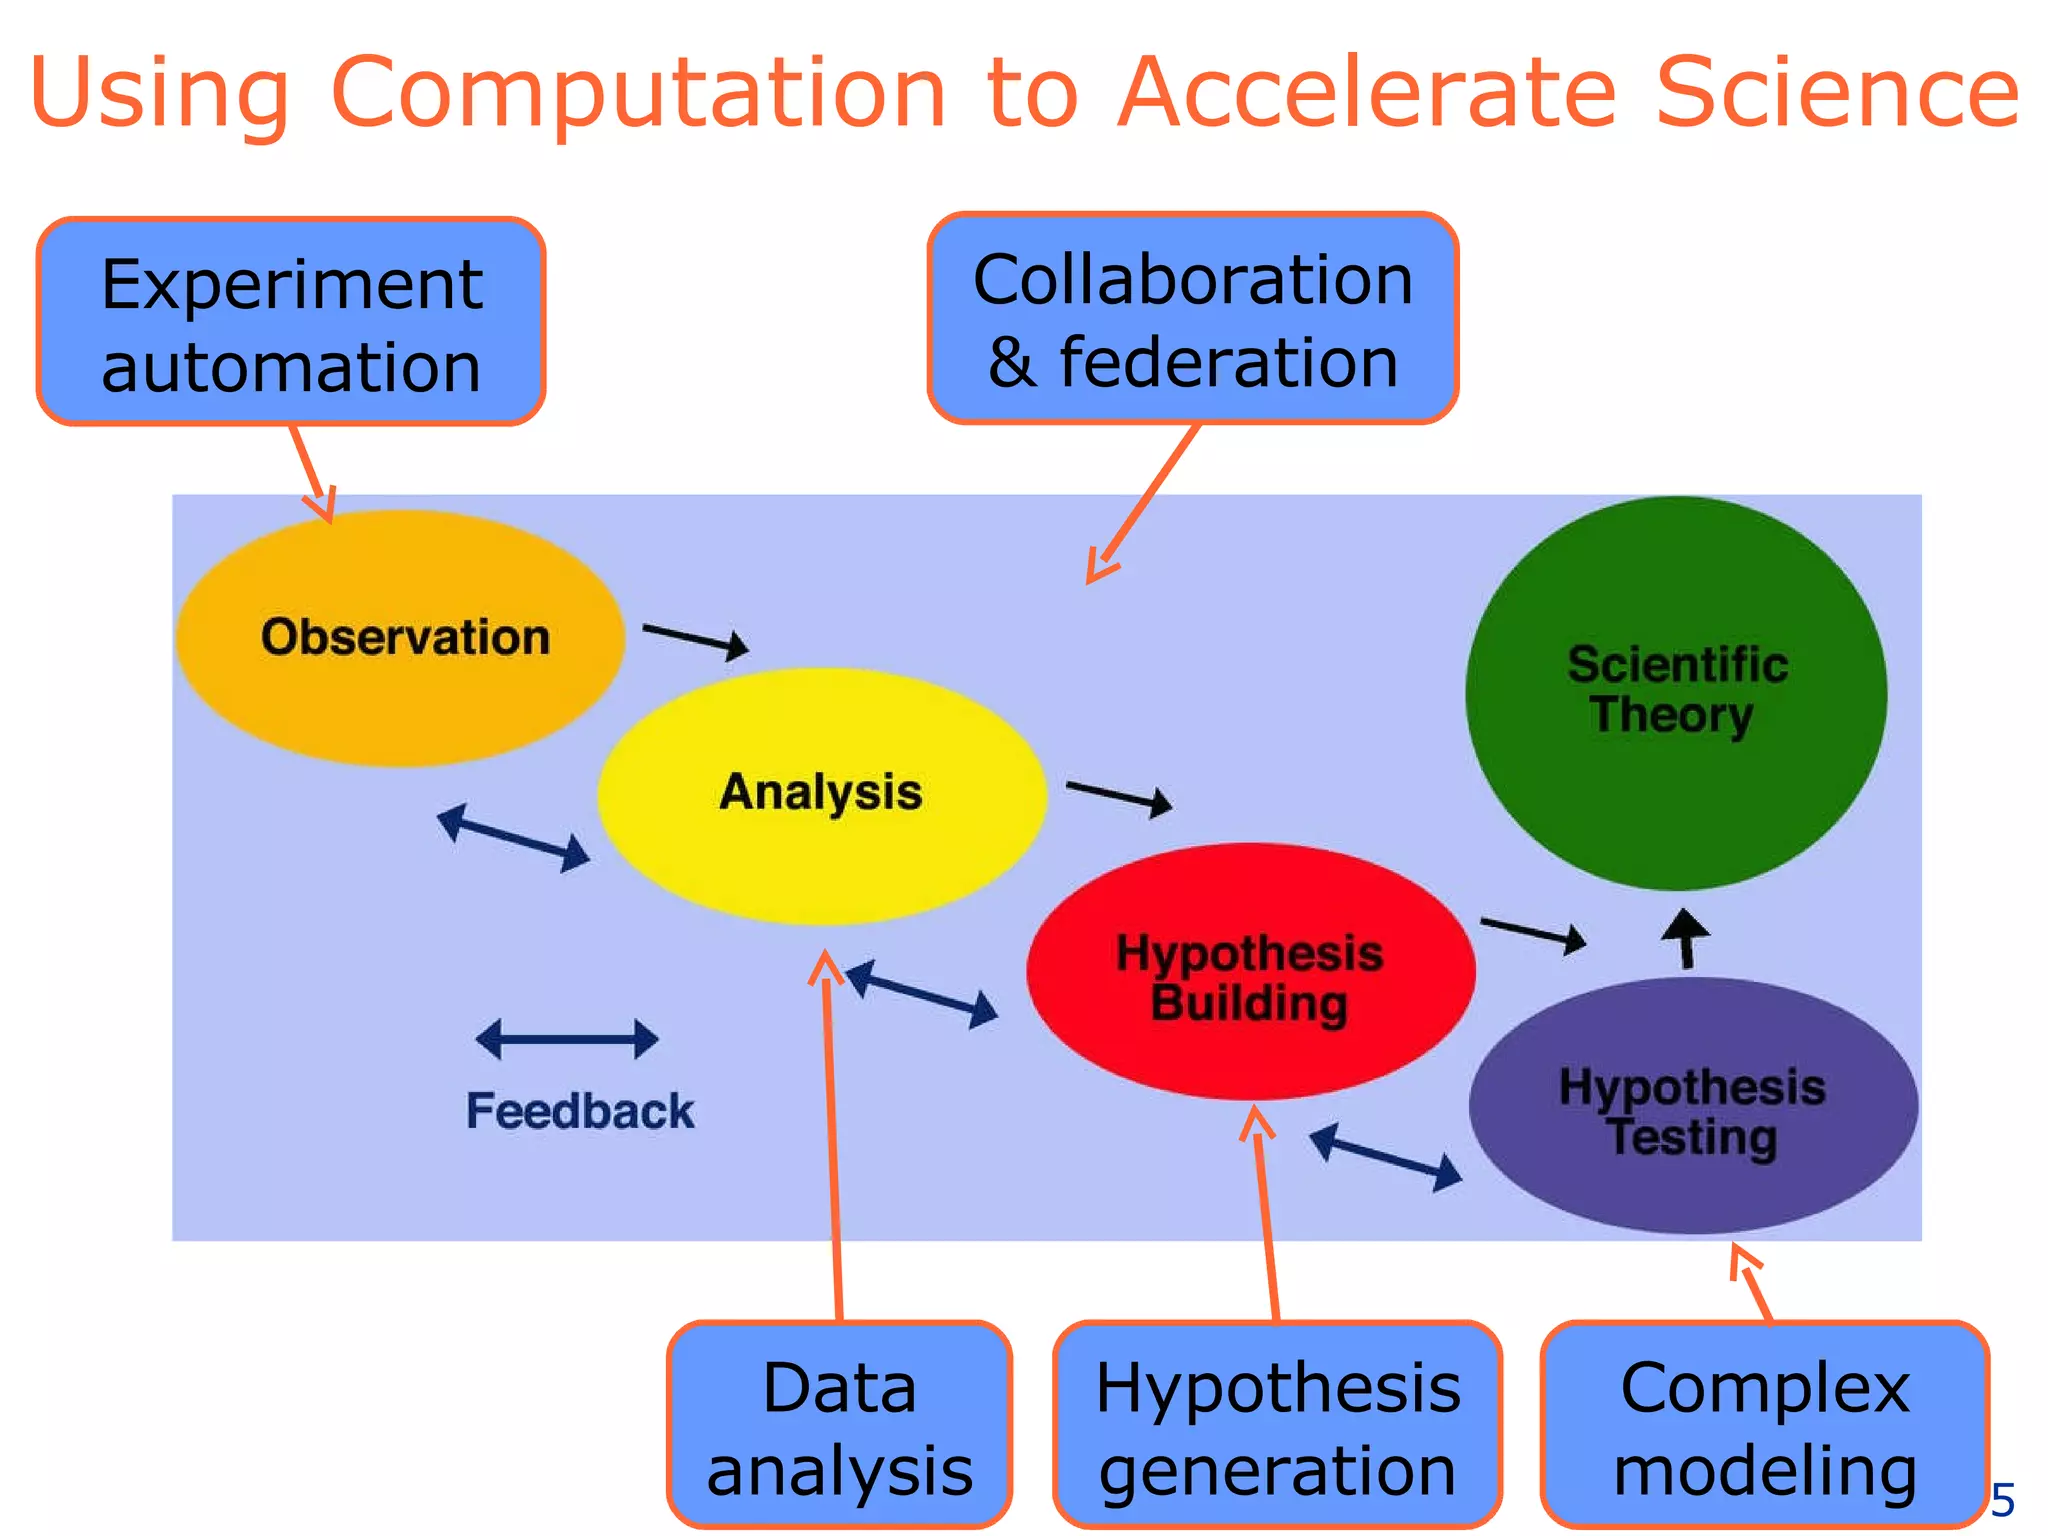
Computation  and  Knowledge Ian Foster Computation Institute Argonne National Lab & University of Chicago
Abstract I speak to the question of how computation can contribute to the generation of new knowledge by accelerating the work of distributed collaborative teams and enabling the extraction of knowledge from large quantities of information produced by many workers. I illustrate my presentation with examples of work being performed within the Computation Institute at the University of Chicago and Argonne National Laboratory.
 
Knowledge Generation in Astronomy ~1600 30 years ? years 10 years 6 years 2 years
Astronomy, from 1600  to 2000 Automation 10 -1    10 8  Hz data capture Community 10 0    10 4 astronomers (10 6  amateur) Computation Data 10 6    10 15  B aggregate 10 -1    10 15  Hz peak Literature 10 1    10 5 pages/year
Astronomy, from 1600  to 2000 Automation 10 -1    10 8  Hz data capture Community 10 0    10 4 astronomers (10 6  amateur) Computation Data 10 6    10 15  B aggregate 10 -1    10 15  Hz peak Literature 10 1    10 5 pages/year Text mining Federation/ collaboration Data analysis Complex system modeling Hypothesis generation Experiment design
FLASH Turbulence Simulation   (R.Fisher, D.Lamb, et al.)  LLNL BG/L External users access processed dataset 74 million files 154 TB 1 week, 65K CPUs 11M  CPU hours Largest compressible  homogeneous isotropic  turbulence simulation 23 TB 3 weeks @ 20 MB/sec (GridFTP) Globus
An  End-to-End Systems  Problem  That Includes … Massively parallel simulation High-performance parallel I/O Remote visualization  High-speed reliable data delivery High-performance local analysis  Data access and analysis by external users Troubleshooting Security Orchestration of distributed activities
Data Delivery  as a Systems Problem Data complexity Many components Parallelism (in many places) Network heterogeneities  (e.g., firewalls) Space (or the lack of it) Protocols Failures at many levels Deadlines Resource contention Policy and priorities 74 million files 154 TB 2 weeks  @20 MB/sec 3 hours @2000 MB/sec 2 mins? @200,000 MB/sec 23 TB
Send 1 GB  partitioned into  equi-sized files over 60 ms RTT, 1 Gbit/s WAN Megabit/sec File size (Kbyte) (16MB TCP buffer) Number of files John Bresnahan et al., Argonne Globus
LIGO Gravitational Wave Observatory Birmingham • >1 Terabyte/day to 8 sites 770 TB replicated to date: >120 million replicas MTBF = 1 month Ann Chervenak et al., ISI; Scott Koranda et al, LIGO Cardiff AEI/Golm   Globus
Lag Plot for Data Transfers to Caltech Credit: Kevin Flasch, LIGO
 
 
Cancer Biology Globus
Service-Oriented Science People  create  services (data, code, instr.) … which I  discover  (& decide whether to use) … &  compose  to create a new function ...  & then  publish  as a new service.    I find “someone else” to  host  services,  so I don’t have to become an expert in operating   services & computers!    I hope that this “someone else” can  manage  security, reliability, scalability, … ! ! “ Service-Oriented Science”,  Science , 2005
Discovering Services Assume success Syntax,   semantics Permissions Reputation    The ultimate arbiter?    Types, ontologies    Can I use it?    Billions of services A B
Discovery (1): Registries Duke OSU NCI NCI Globus
Discovery (2): Standardized Vocabularies Core Services Grid  Service Uses Terminology Described In Cancer Data Standards Repository  Enterprise Vocabulary Services  References Objects Defined in Service  Metadata Publishes Subscribes to and Aggregates Queries  Service Metadata Aggregated In Registers To Discovery  Client API Index Service  Globus
 
Text Mining
More Knowledge (?) US papers/year in ApJ+AJ+PASP
GeneWays Online  Journals Pathways GeneWays Andrey Rzhetsky  et al. Screening 250,000 journal articles 2.5M reasoning chains  4M statements
Image: Andrey Rzhetsky
 
Image: Andrey Rzhetsky
Evidence Integration: Genetics & Disease Susceptibility Identify Genes Phenotype 1  Phenotype 2  Phenotype 3  Phenotype 4 Predictive Disease Susceptibility Physiology Metabolism Endocrine Proteome Immune Transcriptome Biomarker Signatures Morphometrics Pharmacokinetics Ethnicity Environment Age Gender Source: Terry Magnuson
 
The Data Deluge
Images courtesy Mark Ellisman, UCSD
Images courtesy Mark Ellisman, UCSD A human brain  @ 1 micron voxel =  3.5 peta (10 15 )bytes
Understanding increases  far  more slowly  Methodological bottlenecks?    Improved technology Human limitations?    Computer-assisted discovery
Data Analysis gets Fuzzy Global statistics? Correlation functions:  N 2 Likelihood methods:  N 3 Best we can do is  N  or maybe  N logN   (scale approximate) Haystack: Jim Gray/Alex Szalay
Towards an Open Analytics Environment Data in “ No limits” Storage Computing Format Program Allowing for Provenance Collaboration Annotation Results out Programs & rules in
Tagging &  Social Networking GLOSS :  Generalized  Labels Over Scientific  data Sources    (Foster, Nestorov)
High-Performance Data Analytics Functional MRI Ben Clifford,  Mihael Hatigan,  Mike Wilde, Yong Zhao Globus
Many Tasks: Identifying Potential Drug Targets 2M+ ligands Protein  x target(s)  (Mike Kubal, Benoit Roux, and others)
start report DOCK6 Receptor (1 per protein: defines pocket to bind to) ZINC 3-D structures ligands complexes NAB script parameters (defines flexible residues,  #MDsteps) Amber Score: 1. AmberizeLigand 3. AmberizeComplex 5. RunNABScript end BuildNABScript NAB Script NAB Script Template Amber prep: 2. AmberizeReceptor 4. perl: gen nabscript FRED Receptor (1 per protein: defines pocket to bind to) Manually prep DOCK6 rec file Manually prep FRED rec file 1  protein (1MB) PDB protein descriptions 4 million tasks 500K cpu-hrs (Mike Kubal, Benoit Roux, and others) 6  GB 2M  structures (6 GB) DOCK6 FRED ~4M x 60s x 1 cpu ~60K cpu-hrs Amber ~10K x 20m x 1 cpu ~3K cpu-hrs Select best ~500 ~500 x 10hr x 100 cpu ~500K cpu-hrs GCMC Select best ~5K Select best ~5K
DOCK on SiCortex CPU cores: 5760 Power: 15,000 W Tasks: 92160 Elapsed time: 12821 sec Compute time: 1.94 CPU years (does not include ~800 sec to stage input data) Ioan Raicu, Zhao Zhang
An NSF MRI Proposal: PADS: Petascale Active Data Store 500 TB  reliable  storage  (data & metadata) 180 TB,  180 GB/s  17 Top/s analysis Data ingest Dynamic  provisioning Parallel analysis Remote access Offload to remote  data centers P A D S Diverse users Diverse data sources 1000 TB tape  backup
Using Computation to Accelerate Science Complex modeling Experiment automation Data analysis Collaboration & federation Hypothesis generation
Integrated View of Simulation, Experiment, & Informatics *Simulation Information Management System + Laboratory Information Management System Database Analysis Tools Experiment SIMS* Problem Specification Simulation Browsing & Visualization LIMS + Experimental Design Browsing & Visualization
Robot Scientist (University of Wales)
A Concluding Thought “ Applied computer science is now playing  the role that mathematics did from the 17th through the 20th centuries: providing an orderly, formal framework & exploratory apparatus for other sciences.” George Djorgovski
The Computation Institute A joint institute of Argonne and the University of Chicago, focused on furthering  system-level science  via the development and use of advanced computational   methods. Solutions to many grand challenges facing science    and society today require the analysis and    understanding of entire systems, not just individual    components. They require not reductionist    approaches but the synthesis of knowledge from    multiple levels of a system, whether biological,    physical, or social (or all three). www.ci.uchicago.edu Faculty, fellows, staff, students, computers, projects.
 

Computation and Knowledge

  • 1.
    Computation and Knowledge Ian Foster Computation Institute Argonne National Lab & University of Chicago
  • 2.
    Abstract I speakto the question of how computation can contribute to the generation of new knowledge by accelerating the work of distributed collaborative teams and enabling the extraction of knowledge from large quantities of information produced by many workers. I illustrate my presentation with examples of work being performed within the Computation Institute at the University of Chicago and Argonne National Laboratory.
  • 3.
  • 4.
    Knowledge Generation inAstronomy ~1600 30 years ? years 10 years 6 years 2 years
  • 5.
    Astronomy, from 1600 to 2000 Automation 10 -1  10 8 Hz data capture Community 10 0  10 4 astronomers (10 6 amateur) Computation Data 10 6  10 15 B aggregate 10 -1  10 15 Hz peak Literature 10 1  10 5 pages/year
  • 6.
    Astronomy, from 1600 to 2000 Automation 10 -1  10 8 Hz data capture Community 10 0  10 4 astronomers (10 6 amateur) Computation Data 10 6  10 15 B aggregate 10 -1  10 15 Hz peak Literature 10 1  10 5 pages/year Text mining Federation/ collaboration Data analysis Complex system modeling Hypothesis generation Experiment design
  • 7.
    FLASH Turbulence Simulation (R.Fisher, D.Lamb, et al.) LLNL BG/L External users access processed dataset 74 million files 154 TB 1 week, 65K CPUs 11M CPU hours Largest compressible homogeneous isotropic turbulence simulation 23 TB 3 weeks @ 20 MB/sec (GridFTP) Globus
  • 8.
    An End-to-EndSystems Problem That Includes … Massively parallel simulation High-performance parallel I/O Remote visualization High-speed reliable data delivery High-performance local analysis Data access and analysis by external users Troubleshooting Security Orchestration of distributed activities
  • 9.
    Data Delivery as a Systems Problem Data complexity Many components Parallelism (in many places) Network heterogeneities (e.g., firewalls) Space (or the lack of it) Protocols Failures at many levels Deadlines Resource contention Policy and priorities 74 million files 154 TB 2 weeks @20 MB/sec 3 hours @2000 MB/sec 2 mins? @200,000 MB/sec 23 TB
  • 10.
    Send 1 GB partitioned into equi-sized files over 60 ms RTT, 1 Gbit/s WAN Megabit/sec File size (Kbyte) (16MB TCP buffer) Number of files John Bresnahan et al., Argonne Globus
  • 11.
    LIGO Gravitational WaveObservatory Birmingham • >1 Terabyte/day to 8 sites 770 TB replicated to date: >120 million replicas MTBF = 1 month Ann Chervenak et al., ISI; Scott Koranda et al, LIGO Cardiff AEI/Golm Globus
  • 12.
    Lag Plot forData Transfers to Caltech Credit: Kevin Flasch, LIGO
  • 13.
  • 14.
  • 15.
  • 16.
    Service-Oriented Science People create services (data, code, instr.) … which I discover (& decide whether to use) … & compose to create a new function ... & then publish as a new service.  I find “someone else” to host services, so I don’t have to become an expert in operating services & computers!  I hope that this “someone else” can manage security, reliability, scalability, … ! ! “ Service-Oriented Science”, Science , 2005
  • 17.
    Discovering Services Assumesuccess Syntax, semantics Permissions Reputation  The ultimate arbiter?  Types, ontologies  Can I use it?  Billions of services A B
  • 18.
    Discovery (1): RegistriesDuke OSU NCI NCI Globus
  • 19.
    Discovery (2): StandardizedVocabularies Core Services Grid Service Uses Terminology Described In Cancer Data Standards Repository Enterprise Vocabulary Services References Objects Defined in Service Metadata Publishes Subscribes to and Aggregates Queries Service Metadata Aggregated In Registers To Discovery Client API Index Service Globus
  • 20.
  • 21.
  • 22.
    More Knowledge (?)US papers/year in ApJ+AJ+PASP
  • 23.
    GeneWays Online Journals Pathways GeneWays Andrey Rzhetsky et al. Screening 250,000 journal articles 2.5M reasoning chains 4M statements
  • 24.
  • 25.
  • 26.
  • 27.
  • 28.
  • 29.
    Evidence Integration: Genetics& Disease Susceptibility Identify Genes Phenotype 1 Phenotype 2 Phenotype 3 Phenotype 4 Predictive Disease Susceptibility Physiology Metabolism Endocrine Proteome Immune Transcriptome Biomarker Signatures Morphometrics Pharmacokinetics Ethnicity Environment Age Gender Source: Terry Magnuson
  • 30.
  • 31.
  • 32.
    Images courtesy MarkEllisman, UCSD
  • 33.
    Images courtesy MarkEllisman, UCSD
  • 34.
    Images courtesy MarkEllisman, UCSD
  • 35.
    Images courtesy MarkEllisman, UCSD A human brain @ 1 micron voxel = 3.5 peta (10 15 )bytes
  • 36.
    Understanding increases far more slowly Methodological bottlenecks?  Improved technology Human limitations?  Computer-assisted discovery
  • 37.
    Data Analysis getsFuzzy Global statistics? Correlation functions: N 2 Likelihood methods: N 3 Best we can do is N or maybe N logN (scale approximate) Haystack: Jim Gray/Alex Szalay
  • 38.
    Towards an OpenAnalytics Environment Data in “ No limits” Storage Computing Format Program Allowing for Provenance Collaboration Annotation Results out Programs & rules in
  • 39.
    Tagging & Social Networking GLOSS : Generalized Labels Over Scientific data Sources (Foster, Nestorov)
  • 40.
    High-Performance Data AnalyticsFunctional MRI Ben Clifford, Mihael Hatigan, Mike Wilde, Yong Zhao Globus
  • 41.
    Many Tasks: IdentifyingPotential Drug Targets 2M+ ligands Protein x target(s) (Mike Kubal, Benoit Roux, and others)
  • 42.
    start report DOCK6Receptor (1 per protein: defines pocket to bind to) ZINC 3-D structures ligands complexes NAB script parameters (defines flexible residues, #MDsteps) Amber Score: 1. AmberizeLigand 3. AmberizeComplex 5. RunNABScript end BuildNABScript NAB Script NAB Script Template Amber prep: 2. AmberizeReceptor 4. perl: gen nabscript FRED Receptor (1 per protein: defines pocket to bind to) Manually prep DOCK6 rec file Manually prep FRED rec file 1 protein (1MB) PDB protein descriptions 4 million tasks 500K cpu-hrs (Mike Kubal, Benoit Roux, and others) 6 GB 2M structures (6 GB) DOCK6 FRED ~4M x 60s x 1 cpu ~60K cpu-hrs Amber ~10K x 20m x 1 cpu ~3K cpu-hrs Select best ~500 ~500 x 10hr x 100 cpu ~500K cpu-hrs GCMC Select best ~5K Select best ~5K
  • 43.
    DOCK on SiCortexCPU cores: 5760 Power: 15,000 W Tasks: 92160 Elapsed time: 12821 sec Compute time: 1.94 CPU years (does not include ~800 sec to stage input data) Ioan Raicu, Zhao Zhang
  • 44.
    An NSF MRIProposal: PADS: Petascale Active Data Store 500 TB reliable storage (data & metadata) 180 TB, 180 GB/s 17 Top/s analysis Data ingest Dynamic provisioning Parallel analysis Remote access Offload to remote data centers P A D S Diverse users Diverse data sources 1000 TB tape backup
  • 45.
    Using Computation toAccelerate Science Complex modeling Experiment automation Data analysis Collaboration & federation Hypothesis generation
  • 46.
    Integrated View ofSimulation, Experiment, & Informatics *Simulation Information Management System + Laboratory Information Management System Database Analysis Tools Experiment SIMS* Problem Specification Simulation Browsing & Visualization LIMS + Experimental Design Browsing & Visualization
  • 47.
  • 48.
    A Concluding Thought“ Applied computer science is now playing the role that mathematics did from the 17th through the 20th centuries: providing an orderly, formal framework & exploratory apparatus for other sciences.” George Djorgovski
  • 49.
    The Computation InstituteA joint institute of Argonne and the University of Chicago, focused on furthering system-level science via the development and use of advanced computational methods. Solutions to many grand challenges facing science and society today require the analysis and understanding of entire systems, not just individual components. They require not reductionist approaches but the synthesis of knowledge from multiple levels of a system, whether biological, physical, or social (or all three). www.ci.uchicago.edu Faculty, fellows, staff, students, computers, projects.
  • 50.

Editor's Notes

  • #2 Ken Wilson observed: computational science a third mode of enquiry in addition to experiment and theory. My theme is rather how, by taking a systems view of the knowledge generation process, we can identify ways in which computation can accelerate.