1.7.2 Ultrapure WaterProduction 35
1.7.3 Solute Concentration 35
1.7.4 Organic Solvent Separation 38
1.8 Conclusions 38
References 39
Further Reading 45
List of Symbols
A water permeability coefficient
B solute permeability coefficient
c solute concentration
cb bulk concentration
cf feed concentration
cm solute concentration near membrane surface
cp solute concentration in the permeate
Cwm the concentration of water inside the selective layer
dh hydraulic diameter
D diffusion coefficient of solute
Dsm diffusion coefficient of solute inside RO rejection layer
Dwm diffusion coefficient of water inside RO rejection layer
J water flux
Js solute flux
k mass transfer coefficient
Ksm solute partitioning coefficient in the selective layer
L channel length
lm thickness of a selective layer
P hydraulic pressure
R rejection
Re Reynolds number
Rg universal gas constant (8.31 J mol1
K1
)
Rint intrinsic rejection of a membrane
Rm membrane hydraulic resistance
Sc Schemidt number
Sh Sherwood number
T absolute temperature (K)
u cross-flow velocity
Vw molar volume of water
v kinematic viscosity
η dynamic viscosity of water
δ boundary layer thickness
π osmotic pressure
1.1 INTRODUCTION OF REVERSE OSMOSIS
Osmosis, also called forward osmosis (FO), a natural phenomenon
discovered as early as 1748, is a diffusion of fluid (usually water) through
asemi-permeablemembranefromasolutionwithalowsoluteconcentration
2 1. REVERSE OSMOSIS MEMBRANE SEPARATION TECHNOLOGY
3.
to a solutionwith a higher solute concentration until an equilibrium of fluid
concentrationonbothsidesofthemembraneisreached[1].Thedrivingforce
for water transportis the chemical potential difference (i.e.,osmotic pressure
difference) across the membrane. Reverse osmosis (RO) is achieved by
applying a pressure in excess of the osmotic pressure gradient to drive the
water to flow from the high solute concentration side to the low solute con-
centration side, i.e., in an oppose direction to the automatic water flow in the
FO process. Fig. 1.1 illustrates four osmotic membrane processes including
pressure assisted osmosis (PAO), FO, pressure retarded osmosis (PRO) and
RO.Thefourprocessesaresimilarinawaythatasemi-permeablemembrane
isplacedinbetweenasolutionoflowosmoticpressureandasolutionofhigh
osmotic pressure. The first three (PAO, FO, and PRO) are the processes (par-
tially)drivenbyosmoticpressuredifference,wherewaterflowsfromthelow
osmotic pressure side to the high osmotic pressure side. They are not able to
achieve desalination by themselves. Only when the water flow direction is
reversedintheROprocess,cancleananddesaltedwaterbedirectlyobtained
by this pressure driven membrane process.
1.1.1 Historic Development of RO
The use of RO as a feasible separation process was first demonstrated in
the early 1960s. The milestones of RO membrane development are shown
in Fig. 1.2. The first practical RO membrane made of cellulose acetate (CA)
was reported by Loeb and Sourirajan in 1962 [2]. This membrane exhibited
high flux and salt rejection owing to the asymmetric structure (a thin skin
ΔP =0 p ΔP0 ΔP p
Forward osmosis
(FO)
Pressure
retarded osmosis
(PRO)
Reverse osmosis
(RO)
ΔP0
Pressure
assisted osmosis
(PAO)
Solution of low osmotic pressure
Solution of high osmotic pressure
Semi-permeable membrane
FIG. 1.1 Osmotic membrane processes including pressure assisted osmosis (PAO), for-
ward osmosis (FO), pressure retarded osmosis (PRO) and reverse osmosis (RO).
3
1.1 INTRODUCTION OF REVERSE OSMOSIS
4.
layer on aporous substrate). Cadotte and Petersen later made the first effi-
cient thin-film composite (TFC) membrane based on the reaction of phe-
nylene diamine and trimesoyl chloride, which was a key breakthrough to
make the large-scale application of RO membranes economically feasible
[3]. Today, the state-of-art desalination RO membranes are still TFC poly-
amide (PA) RO membranes [4]. Although they are produced based on the
original chemistry discovered during the 1980s, the performance of RO
membranes have been improved significantly over the 30 years [5], by
closer monitoring of the recipes for the substrates and selective layer
and/or applying coating, etc. [6]. More than sevenfold decrease in salt
passage has expanded the range of saline feeds, while the increased life-
span (2.3 times) and increased water permeability (2.5 times) have greatly
reduced the real cost (one twelfth) [5, 7]. Currently, TFC RO membranes
are produced in flat sheet configuration and mostly supplied in spiral
wound module (SWM). With the aim of further reducing energy cost in
desalination (theoretical minimal energy required to desalinate 35 g/L
seawater at 50% recovery is 1.06 kWh/m3
, while the real energy con-
sumption is 2–5 kWh/m3
[8, 9]), extensive researches are focused on
developing more superior performing, fouling resistant and chlorine
resistant RO membranes, in addition to the optimizations of the process
and membrane module design.
Since 2007, the emerging thin-film nanocomposite (TFN) membranes/
mixed matrix membranes (MMMs), i.e., TFC membranes with incorpo-
rated nanoparticles/inorganic particles in the selective layer and/or the
support layer, have attracted great interests in fabricating high perfor-
mance RO membranes [10, 11], due to their enhanced performance as
compared with pristine TFC membranes [12].
FIG. 1.2 Milestones of RO membrane development. Adapted from Baker RW. Reverse osmo-
sis. Membrane technology and applications. John Wiley Sons, Ltd; 2004. p. 191–235.
4 1. REVERSE OSMOSIS MEMBRANE SEPARATION TECHNOLOGY
5.
1.1.2 Basic Propertiesof RO Membrane
The basic properties of RO membrane are summarized in Table 1.1
along with other types of pressure driven membranes such as nanofiltra-
tion (NF), ultrafiltration (UF), and microfiltration (MF), which are catego-
rized based on the pore size or operating pressure range. MF and UF
membranes are the low-pressure membranes with relatively larger pores.
They are usually adopted in the pretreatment of RO/NF processes to pro-
tect the RO/NF membranes. They are also used as the support for fabri-
cating TFC RO and NF membranes. RO membranes have the tightest
surface “pores” (2 nm (diameter), generally considered as non-porous
membrane) and are able to retain dissolved ions (including monovalent
ions Na+
and Cl
) and small organic molecules. RO membranes can be
further divided into seawater RO (SWRO) and brackish water RO
(BWRO) membranes. SWRO membranes have high NaCl rejection
(99%) and are used for seawater desalination. The trade-off for this high
TABLE 1.1 Typical Properties of Pressure-Driven Membranes
Microfiltration Ultrafiltration Nanofiltration
Reverse
osmosis
Surface pore
size (nm)
50–10,000 1–100 2 2
Operating
pressure
(bar)
0.1–2.0 1.0–5.0 2.0–10 10–100
Water
permeability
(L/m2
h/bar)
500 20–500 5–50 0.5–10
MWCO (Da) Not applicable 1000–300,000 100 10
Targeted
contaminants
Bacteria, algae,
suspended
solids,
turbidity
Bacteria, virus,
colloids,
macromolecules
Di- and multi-
valent ions,
natural organic
matter, small
organic
molecules
Dissolved
ions, small
molecules
Membrane
materials
Polymeric,
inorganic
Polymeric,
inorganic
Thin-film
composite
polyamide,
cellulose
acetate, etc. [13]
Thin-film
composite
polyamide,
cellulose
acetate
Note: MWCO, molecular weight cut-off.
Adapted from Fane AG, Wang R, Tang C. Membrane technology for water: microfiltration, ultrafiltration,
nanofiltration, and reverse osmosis. Treatise on water science, vol. 4. Amsterdam; Hackensack, NJ: Elsevier Science;
2011. p. 301; Mulder M. Basic principles of membrane technology. The Netherlands: Kluwer Academic Publishers;
1996.
5
1.1 INTRODUCTION OF REVERSE OSMOSIS
6.
rejection is thelow water permeability (1 L/m2
h/bar). High pressure of
above 60 bar is generally required in real operation to overcome the sea-
water osmotic pressure to produce reasonably high-water flux. BWRO
membranes have relatively low NaCl rejection (95%) and higher water
permeability (1–10 L/m2
h/bar), and are used for water/wastewater
treatment where feed salt content is much lower compared to that of sea-
water. NF membranes are similar to RO membranes, but the bigger “pore”
size of NF membranes as compared with RO membranes leads to the
higher water permeability and much lower rejection to the monovalent
ions (e.g., 10%–90% rejection to Na+
depending strongly on the surface
charges of the membrane). NF membranes can effectively remove di-
and multi-valent ions, which makes them useful for water softening.
During a pressure driven membrane process, a feed stream is divided
into two streams, i.e., retentate stream (or concentrate stream) that is
retained by the membrane and permeate stream that passes through the
membrane. It is widely accepted that the transport of molecules through
the selective skin layer of a RO membrane is best described by the
solution-diffusion model [14, 15]. It assumes that both the solvent and
the solute are absorbed to the skin layer, and then diffuse through the
non-porous layer independent of each other under their respective chem-
ical potential gradient. A separation is achieved between the solvent and
the solute (or among different permeants) because of the differences in the
amount of the molecules that dissolve in the membrane (solubility) and
the rate at which the molecules diffuse through the membrane (diffusiv-
ity) [14]. RO membranes generally allow high absorption of water mole-
cules and fast diffusion of them through the selective layer, as compared
with sodium chloride [15].
1.2 RO MEMBRANE FABRICATION
RO membranes are generally categorized into integrally skinned asym-
metric membranes and TFC membranes based on the structure and mate-
rials. The common materials used for RO membrane fabrication are
summarized in Table 1.2. An integrally skinned asymmetric membrane
is made of one polymeric material, and CA membranes (made of cellulose
esters) are the most widely used examples [15]. The TFC RO membrane is
the state-of-the-art RO membrane, which comprises two or more polymer
materials. The porous membrane support is typically made of polysulfone
(PSf) or polyethersulfone (PES). The ultrathin selective layer is generally
made of polyamide (PA), which has relatively high water flux and high
solute rejection, as well as good chemical, mechanical, and thermal stabil-
ity (Table 1.2) [9].
6 1. REVERSE OSMOSIS MEMBRANE SEPARATION TECHNOLOGY
7.
TABLE 1.2 TypicalMaterials for RO Membrane Preparation
Polymer Structure Properties
Cellulose esters Hydrophilic
Cellulose diacetate and triacetate and their blends are widely
used for making RO membranes
Cellulose acetate membranes are subject to hydrolysis and
microbial attack
Stable over narrow pH range
Polysufone (PSf) High performance polymer with excellent chemical and thermal
stability
Form porous support layer of RO and NF membranes
Polyethersulfone
(PES)
Similar to PSf, high chemical and thermal stability
Less hydrophobic than PSf
Form porous support layer of RO and NF membranes
Polyamide (PA) Good thermal stability, chemical resistance and mechanical
strength
Used as ultrathin dense layer for RO membranes
Low resistance to chlorine
7
1.2
RO
MEMBRANE
FABRICATION
8.
1.2.1 Cellulose AcetateMembrane
Cellulose esters, including cellulose diacetate and cellulose triacetate,
are used to prepare the integrally skinned asymmetric RO membranes
via phase inversion. Phase inversion refers to a process whereby a poly-
mer solution (liquid form; in which the solvent system is the continuous
phase) inverts into a swollen three-dimensional macromolecular network
or gel (solid form; where the polymer is the continuous phase) [9]. In other
words, a liquid polymer solution is precipitated into two phases: a
polymer-rich phase that forms the matrix of the membrane, and a
polymer-lean phase that forms the membrane pores in an unstable nascent
membrane structure. For RO membrane/RO substrate preparation, the
precipitation is generally achieved by the immersion of a polymer solution
into a non-solvent coagulant bath, such as water (solvent containing water
coagulant bath is usually adopted for hollow fiber membrane preparation
[16]). Both flat-sheet membranes and hollow fiber membranes can be
fabricated using this method.
Despite the ease of preparation (i.e., one step casting), it is generally dif-
ficult for the integrally skinned asymmetric RO membranes to achieve
both high water permeability and high solute rejection. Formation of a
dense skin layer requires a relatively high polymer concentration, which
results in a less porous/less permeable support and therefore an increased
overall hydraulic resistance of the membrane. It has been reported that the
polymer concentration for making integrally skinned asymmetric CA
membrane is higher than that of TFC membrane with CA support [17,
18]. A common practice for increasing the solute rejection of CA mem-
brane is to adopt an annealing post-treatment, such as heating in a bath
of hot water for a few minutes [19]. This process modifies the selective
layer by eliminating the micropores and producing a denser skin, result-
ing in a decrease in water flux and an increase in salt rejection [19]. The
annealing temperature determines the final properties of the membrane
and a higher temperature generally leads to a denser skin layer. To com-
pensate the low permeability, the commercial CA RO membrane is pref-
erentially made into hollow fiber modules (e.g., Toyobo hollow fiber
membrane with a very small outer diameter of 165 μm [20]), which
can provide sufficiently high water productivity owing to the high pack-
ing density (high specific membrane area) [21]. Considerable research
efforts have been made to optimize CA membranes via changing the
compositions of polymer solution (e.g., type and concentration of poly-
mer/additives) and casting/spinning conditions (e.g., composition and
temperature of coagulant bath), and modifying the surface properties,
etc. [22–24]. However, their drawbacks of poor stability against chemicals,
bacteria, and temperature and lower water permeability make it less
competitive than the TFC polyamide membranes (see Tables 1.2 and 1.3).
8 1. REVERSE OSMOSIS MEMBRANE SEPARATION TECHNOLOGY
9.
1.2.2 TFC PolyamideMembrane
A TFC polyamide (PA) RO membrane generally comprises three layers,
including an aromatic PA selective layer (typically 200 nm thick), a
microporous support (usually a UF membrane, 20–50 μm), and a non-
woven fabric (backing layer, 100–200 μm) [9]. A schematic of a typical
TFC RO membrane is shown in Fig. 1.3. The selective layer and the sup-
port are produced separately, enabling the optimization of each individ-
ual layer for the respective specific function, i.e., the top selective layer is
thin but dense enough to attain high solvent flux and high solute rejection;
TABLE 1.3 Comparison of CA RO Membrane and TFC RO Membrane
Cellulose acetate (CA)
RO membrane
Thin-film composite (TFC)
polyamide (PA) RO membrane
Water permeability
(L/m2
h/bar)
Low (1 L/m2
h/bar
or less)
High
NaCl rejection (%) 85–98 95–99.9
Surface hydrophilicity Very hydrophilic Less hydrophilic
Surface roughness Smooth Rough surface with ridge-and-
valley structure
Operating pH range 5–7 3–10 (2–11 for certain membranes)
Maximum operating
temperature (°C)
30 45
Resistance to
biodegradation
Low Relatively good
Resistance to chlorine Stable at low levels
(1 ppm)
Low tolerance to free chlorine
(0.1 ppm)
Adapted from Fane AG, Wang R, Tang C. Membrane technology for water: microfiltration, ultrafiltration,
nanofiltration, and reverse osmosis. Treatise on water science, vol. 4. Amsterdam; Hackensack, NJ: Elsevier Science;
2011. p. 301.
Polyamide 0.05–0.3µm
Polysulfone ~20–50µm
Backing layer ~100–200 µm
FIG. 1.3 Schematic of a thin-film composite PA membrane.
9
1.2 RO MEMBRANE FABRICATION
10.
and the supportis porous enough to provide low resistance to permeate
while maintaining high mechanical strength [25]. This approach provides
great flexibility for utilizing different materials to tailor the membrane
structure and properties.
The PA layer of a TFC RO membrane is formed on a porous membrane
support via interfacial polymerization between amines (e.g.,
m-phenylenediamine, MPD) and aromatic acyl chlorides (e.g., trimesoyl
chloride, TMC). In the process of preparation (Fig. 1.4), a membrane sup-
port (UF or MF membrane) is immersed in an aqueous solution containing
MPD. After removing the excess MPD, the membrane surface is immersed
in/contacted with a water-immiscible solvent containing dissolved TMC.
Due to the rapid hydrolysis of acyl chloride in the aqueous phase and the
asymmetric solubility, the reaction is diffusion-controlled and comprises
three stages [26]: At the incipient stage, a loose polymer film begins to
emerge in the interface between two immiscible solvents; then amines
in the aqueous phase diffuse to the organic phase and the film becomes
dense and grows perpendicularly towards the organic phase; finally the
increase in thickness and density of the film inhibits the diffusion of
the monomers and the reaction. The advantage of interfacial reaction is
the fast reaction kinetics and self-inhibiting, resulting in an extremely thin
film. Heat treatment is often applied to complete the interfacial reaction
and further cross-linking [19]. The type and concentration of mono-
mers/solvents/additives, polymerization condition, and curing process
FIG. 1.4 (A) Schematic of the formation of a thin-film composite membrane via interfacial
polymerization; (B) reaction between MPD and TMC. Adapted from Weng X, Ji Y, Zhao F, An Q,
Gao C. Tailoring the structure of polyamide thin film composite membrane with zwitterions to achieve
high water permeability and antifouling property. RSC Adv 2015;5(120):98730-9
10 1. REVERSE OSMOSIS MEMBRANE SEPARATION TECHNOLOGY
11.
can affect theperformance of the PA layer and these conditions need to be
optimized for fabricating high-performance TFC membranes [27, 28].
In addition to the control of the reaction parameters of interfacial poly-
merization, the surface properties of the support such as pore structure,
surface morphology and chemistry are also important for the PA layer for-
mation [27, 29]. For example, a relatively porous and hydrophobic support
could result in the formation of a more permeable and rougher skin layer;
whereas a smoother PA layer with lower permeability is formed on a sup-
port of hydrophilic surface [30]. The increasing surface pore size was also
found to increase the RO membrane water permeability [31]. Although it
has been found that the support surface properties play an important role
in forming PA layer, the mechanisms are yet to be systematically investi-
gated. Besides the surface properties, an ideal support of a RO membrane
shall possess good mechanical, chemical, thermal, and biological stabili-
ties and relatively low hydraulic resistance.
In the aspect of RO support preparation, phase inversion is the most
extensively used method, with which an asymmetric UF membrane is
generally formed from polymers PSf or PES (Table 1.2). Similar to the
CA RO membrane fabrication and other UF membrane preparation,
factors such as the composition of polymer solution (e.g., the type and
concentration of polymer/additive), and coagulant bath, etc. have been
shown to influence the properties of resultant supports [15, 27]. For the
commercially available TFC membranes, the TFC RO supports are pro-
duced in flat sheets; hollow fiber TFC RO membranes are only prepared
in lab scale currently due to the challenges of large-scale production.
Nevertheless, the high performance hollow fiber TFC RO membranes
have been recently developed in a few research labs with promising
applications in brackish water desalination and surface water
treatment [32].
On the other hand, the recently emerged nanofibrous membranes pro-
duced by electrospinning have attracted many interests in preparing
membranes or membrane supports [29, 33]. Electrospinning involves a
process during which polymer is stretched into nanofibers from its
solution under an applied electrostatic force. This technique is so versatile
that the produced nanofibrous membranes can be tailored with desired
pore size, porosity, and thickness by varying the polymer solution and
electrospinning conditions [29, 34]. A typical nanofibrous membrane
has interconnected pores and relatively high porosity, which is favorable
for making RO/NF membranes with high water permeability [33]. Nev-
ertheless, the surface pore size of the nanofibrous membrane support
needs to be carefully controlled within a certain range for the successful
formation of PA selective layer. The nanofibrous support with high poros-
ity may also require other treatment to enhance its stability against high
pressure, such as heat pressing [33].
11
1.2 RO MEMBRANE FABRICATION
12.
1.2.3 Membrane Witha Polyelectrolyte Multilayer Film
RO/NF membranes can be prepared by the layer-by-layer assembly of
polyelectrolytes onto a charged support (UF or NF supports), where a
polycation (e.g., polyallylamine hydrochloride, PAH) and a polyanion
(e.g., poly(sodium 4-styrene-sulfonate), PSS) are deposited alternately
[35–37]. Fig. 1.5 presents a schematic of layer-by-layer assembly cycle.
The rejection property of the membrane usually depends on several fac-
tors, such as the type and concentration of polyelectrolytes, ionic condition
of the polyelectrolyte solution, contact time, and the number of bilayers
(one positively charged layer and one negatively charged layer) [37, 38].
These conditions may influence both the tightness of the “pores” in the
membrane skin layer as well as the surface charge, thereby affecting the
passage of solutes, especially charged solutes. This method is more widely
used for NF membrane preparation, as the monovalent rejection of the
polyelectrolyte film is not very high while the divalent ions are much bet-
ter retained. To enhance the solute rejection and the film stability, cross-
linking via heat treatment and/or the use of cross-linking agents are
generally adopted [37–40].
1.2.4 Recent Advances in Membranes
1.2.4.1 Mixed Matrix Membranes
Mixed matrix membranes (MMMs) for RO applications are fabricated
by incorporating inorganic nanoparticles into membrane matrix via
blending the materials into the polymer solution for the support or the
monomer solution for the PA layer [27, 41]. The membrane with nanopar-
ticles embedded PA layer is also named thin-film nanocomposite (TFN)
membrane. The pioneering study by Hoek’s group [12] reported the fab-
rication of a TFN RO membrane via immobilizing zeolite NaA nanopar-
ticles in the PA layer at loadings of 0.004%–0.4% (w/v). The results
Polycation Polyanion
Membrane
support
FIG. 1.5 Schematic of layer-by-layer assembly for preparing polyelectrolyte multilayer
film.
12 1. REVERSE OSMOSIS MEMBRANE SEPARATION TECHNOLOGY
13.
demonstrated dramatic increasein water permeability upon zeolite incor-
poration, while solute rejection remained comparable to the pure TFC
membrane (Fig. 1.6). The improved intrinsic properties of the TFN mem-
branes could be attributed to the unique pore structure of zeolite molec-
ular sieve particles, which provide a preferential flow path for water
molecules through its internal pore structure. In addition, the hydrophi-
licity and negative charges of zeolite nanoparticles could result in greater
affinity for water molecules and thus increase the repulsion of anions [10].
Similar to zeolites that provide size and shape selectivities, silica (SiO2) are
also available in various forms and sizes, such as nonporous silica and
mesoporous silica. The latter has pore size range of 2–50 nm, which
could make even shorter water flow path in TFN membranes [42]. How-
ever, increasing mesopore size of silica may cause sacrificed salt retention
[43]. Besides the selection of nanoparticles, the loading of nanoparticles
shall also be carefully controlled to minimally affect the crosslinking
degree of PA layer [27]. Other promising nanoparticles for MMM prepa-
ration include titanium nanotube, silver (Ag), carbon nanotube (CNT),
and grapheme oxide (GO), etc. In addition to the enhanced separation
FIG. 1.6 Zeolite nanoparticle-embedded TFN membranes. (A) Schematic of TFN mem-
branes; (B) SEM image of zeolite nanoparticles; (C) TEM image of PA layer with embedded
zeolite nanopartilces; and (D) water permeability and solute rejection performance upon zeo-
lite loading. Reproduced from Jeong BH, Hoek EMV, Yan Y, Subramani A, Huang X, Hurwitz G,
et al. Interfacial polymerization of thin film nanocomposites: a new concept for reverse osmosis mem-
branes. J Membr Sci 2007;294(1-2):1-7.
13
1.2 RO MEMBRANE FABRICATION
14.
properties, TFN membranesmay exhibit improved chemical and thermal
stability, improved reaction and sorption capacity [27]. For example, the
TFN membrane with Ag incorporated in the selective layer exhibited bet-
ter anti-biofouling property [44], and CNT embedded TFN membranes
showed improved resistance to chlorine and fouling [45].
On the other hand, MMMs with fillers in the supports have also been
extensively investigated [27]. Although TFN approach seems to be more
effective to improve RO membrane separation property, the nanoparticle
incorporation in the supports may benefit in a different way. Similar to
the effect of changing polymer solution composition (see Section 1.3.2),
a small amount of fillers in the support can significantly change the sup-
port’s properties, which may subsequently affect the selective layer forma-
tion [27]. The hydrophilic inorganic particles such as silica, zeolites, TiO2,
and CNTs could increase the hydrophilicity of the support layer.
Meanwhile, the changed pore structure (especially the surface character-
istics of the support) may contribute to the enhanced water permeability
[46]. This approach is very helpful in decreasing the structural parameter
of the support layer of FO membranes to reduce the internal concentration
polarization effect, thereby increasing FO water flux [46]. Moreover, the
fillers with superior mechanical property such as CNT can significantly
increase the tensile strength of the MMM membranes [47]. However, there
are still some challenges encountered during TFN membrane/MMM fab-
rication, such as poor dispersion of nanoparticles in the casting solution,
agglomeration of nanoparticles in the PA layer, lack of interaction
between nanoparticles and membrane matrix (leach out easily), and
unknown water and ion transport mechanisms especially for nonporous
nanoparticles [10].
1.2.4.2 Biomimetic Membranes
Different from the MMMs, the fillers used in biomimetic membranes
are aquaporin (AQP) laden vesicles. AQPs are known as water channels,
which selectively conduct water molecules while preventing the passage
of ions and other solutes (Fig. 1.7A). These characteristics make
them perfect for desalination. The single channel permeability of
AQP is 2–14 1014
cm3
water molecules/s (CNT is on the orders of
1014
–1012
cm3
/s but without perfect solute rejection) [48–50]. AQP
laden vesicles have been demonstrated to possess high water productivity
as compared to that of commercial RO membranes [51]. Among different
methods of making biomimetic membranes, TFC membrane is still the
most practical and promising approach [48]. Conceptually, the way of
immobilizing biomolecules into a PA layer is similar to the TFN mem-
brane fabrication. The fabrication of biomimetic TFC RO membrane has
been firstly successfully demonstrated by Zhao et al. [52], and the resul-
tant membrane showed 25% increase in water flux without compromising
14 1. REVERSE OSMOSIS MEMBRANE SEPARATION TECHNOLOGY
15.
the NaCl rejection.Later Li et al. showed that the water permeability
of AQP incorporated TFC hollow fiber membrane reached 8 L/m2
h/bar, which was twice as high as those of pristine TFC membrane and
commercial BWRO membranes [32]. A cross-sectional SEM image of bio-
mimetic RO membrane is shown in Fig. 1.7B, where the AQP laden ves-
icles can be observed within the PA layer. Despite the superior
separation performances, other issues shall be taken into consideration,
such as membrane stability (very few studies looked into the long term
stability [53]), scalability, and production cost. A comprehensive review
on biomimetic membranes can be found elsewhere [48]. On the other
Water
molecules
Lipid
bilayer
Aquaporin
Self-assembled
water channel
Unimolecular
water channel
(A)
Lipid
vesicles
Polyamide
layer
PES support
layer
(B)
FIG. 1.7 Water channels and biomimetic membranes. (A) Aquaporin and synthetic water
channels (self-assembled artificial water channel and unimolecular artificial water channel);
(B) biomimetic TFC RO membranes with incorporated aquaporins (spanned in lipid vesicles)
in the PA layer. Adapted from Li X, Chou S, Wang R, Shi L, Fang W, Chaitra G, et al. Nature gives
the best solution for desalination: aquaporin-based hollow fiber composite membrane with superior per-
formance. J Membr Sci 2015;494:68–77; Barboiu M. Artificial water channels—incipient innovative
developments. Chem Commun 2016;52(33):5657–65.
15
1.2 RO MEMBRANE FABRICATION
16.
hand, the highperformance of natural water channel has inspired
researchers to synthesize artificial water channels with nanotubular struc-
tures (Fig. 1.7A), which have potential to overcome the challenges faced by
AQP based biomimetic membranes [54].
1.3 MEMBRANE PROPERTIES AND
CHARACTERIZATIONS
Membrane separation properties generally consist of water permeabil-
ity and solute rejection, which directly determines membrane productiv-
ity. In addition, other important characteristics include hydrophilicity,
surface roughness and charge, and membrane stability, which are not only
related to the separation properties, but also influence membrane fouling
significantly. Correspondingly, membrane characterization (Table 1.4)
provides the information about the important membrane properties. It
can guide the optimization of membrane fabrication to achieve excellent
separation efficiency and fouling resistance.
TABLE 1.4 Membrane Characterization Methods
Instrument Membrane characteristics
Performance test Membrane filtration
setup
Water permeability, solute rejection, pore
size distribution
Microscopic
methods
SEM Surface/cross-section features
TEM Cross-section of membrane/cake layer
CLSM Membrane structure/foulant composition
AFM Roughness, surface morphology
Spectroscopic
methods
FTIR Membrane/foulant functional groups
XPS Elements/chemical bonding
EDX Elemental mapping of membrane/foulants
EIS Structural information of sublayers
Other methods Goniometer/
tensiometer
Hydrophilicity/hydrophobicity
Streaming potential
analyzer
Surface charge
AFM force
measurement
Interaction force (membrane-foulant)
Adapted from Fane AG, Wang R, Tang C. Membrane technology for water: microfiltration, ultrafiltration,
nanofiltration, and reverse osmosis. Treatise on water science, vol. 4. Amsterdam; Hackensack, NJ: Elsevier Science;
2011. p. 301.
16 1. REVERSE OSMOSIS MEMBRANE SEPARATION TECHNOLOGY
17.
1.3.1 Membrane Properties
1.3.1.1Water Permeability and Solute Permeability
The solution-diffusion model assumes that the solute and solvent are
absorbed into and diffuse through the membrane selective layer, indepen-
dent of each other, under the respective chemical potential gradient.
According to the model, the water flux J and the solute flux Js are propor-
tional to the net pressure difference and the concentration difference,
respectively, across the membrane [9]:
J ¼ A ΔPΔπ
ð Þ (1.1)
Js ¼ BΔc (1.2)
where A is defined as water permeability coefficient and B is the solute
permeability coefficient. ΔP and Δπ are hydraulic pressure difference
and osmotic pressure difference across the membrane, respectively. Δ c
is the concentration difference across the membrane. The transport coef-
ficients in this model can be related to membrane properties as shown
below:
A ¼
DwmCwmVw
RgTlm
(1.3)
B ¼
DsmKsm
lm
(1.4)
where Dwm and Dsm are water diffusion coefficient and solute diffusion
coefficient inside the selective layer, respectively. Csm is the concentration
of water inside the selective layer, Vw is the molar volume of water, Ksm is
the solute partitioning coefficient in the selective layer, lm is the thickness
of the selective layer, Rg is universal gas constant, and T is absolute
temperature.
The intrinsic rejection of a RO membrane Rint is defined as [55]:
Rint ¼ 1
cp
cm
(1.5)
where cp and cm are the solute concentration in permeate and at the feed
solution/membrane interface, respectively, and Rint can be determined
using the following equation:
Rint ¼ 1 +
B
A ΔPΔπ
ð Þ
1
(1.6)
According to the above Eqs. (1.3), (1.4), and (1.6), the intrinsic rejection
can be improved by increasing the preferential absorption of water mol-
ecules to the solutes, enhancing the diffusion coefficient of water mole-
cules inside the selective layer compared with that of solutes, and
increasing the applied pressure. This intrinsic rejection is different from
17
1.3 MEMBRANE PROPERTIES AND CHARACTERIZATIONS
18.
apparent rejection R,which is directly measured from experiments and
can be greatly affected by the concentration polarization (CP) (as dis-
cussed in Section 1.5):
R ¼ 1
cp
cf
(1.7)
where cf is the solute concentration in the feed. In general, apparent
rejection R has smaller value than intrinsic rejection Rint due to the CP
effect.
In addition to the solution diffusion model, permeate water flux J can be
also correlated to the driving force by following Darcy’s law and is com-
monly presented in terms of membrane hydraulic resistance Rm and
dynamic viscosity of the permeating water η [9]:
J ¼
ΔPΔπ
ηRm
(1.8)
Although A and B value are the intrinsic properties of a membrane, the
measured water flux and rejection are affected by different operating con-
ditions, which generally include the applied pressure, cross-flow velocity
of the feed stream, feed concentration (or recovery), and temperature
(Fig. 1.8). At a relatively low applied pressure (low water flux level),
the water flux increases linearly with applied pressure (Eq. 1.2 or
FIG. 1.8 Effect of operating conditions on RO membrane performance. Adapted from Fane
AG, Wang R, Tang C. Membrane technology for water: microfiltration, ultrafiltration, nanofiltration,
and reverse osmosis. Treatise on water science, vol. 4. Amsterdam; Hackensack, NJ: Elsevier Science;
2011. p. 301.
18 1. REVERSE OSMOSIS MEMBRANE SEPARATION TECHNOLOGY
19.
Eq. 1.8), thesolute rejection also increases with increasing pressure
based on the solution diffusion model (Eq. 1.6). However, at a higher
applied pressure, the water flux increase deviates from the linear line,
due to the increased concentration polarization (i.e., increased concen-
tration/osmotic pressure at membrane surface, see Section 1.5). The
increased concentration at membrane surface also results in a lower
apparent rejection. Increasing the cross-flow velocity tends to increase
both water flux and solute rejection, as a result of reduced concentration
polarization. Increasing the recovery or increasing the feed concentra-
tion has an effect of reducing both water flux and solute rejection,
due to the increased osmotic pressure of the bulk solution. Hence,
the recovery for a typical SWRO desalination plant is limited to 50%,
while that for a water reclamation plant is controlled below 80% [9].
Increasing the system temperature can lead to an increase in both water
flux and solute flux, due to the enhanced diffusion coefficient (Dwm and
Dsm) in the membrane selective layer. The solute flux generally
increases more drastically than the water flux, so the solute rejection
tends to decrease at a higher temperature. It is noted that the change
in temperature affects the intrinsic properties of membrane selective
layer, while the other operating conditions discussed here are related
to the solute concentration at membrane surface.
1.3.1.2 Hydrophilicity
Hydrophilicity is a characteristic of materials exhibiting an affinity to
water. The surface of a hydrophilic membrane can readily absorb water.
In contrast, a hydrophobic membrane has little or no tendency to absorb
water. The relative hydrophilicity/hydrophobicity can be determined
using contact angle measurement (see Table 1.4). In general, a hydrophilic
membrane surface is preferred in RO applications for enhancing water
permeability and reducing membrane fouling propensity [56–58]. In this
regard, CA membrane surface is preferred compared to a typical TFC
membrane surface (a comparison of the two membranes is shown in
Table 1.3).
1.3.1.3 Surface Roughness
Membrane surface roughness is an important parameter affecting RO
membrane fouling. A rougher surface is subject to more membrane foul-
ing due to the decreased shear force over the rougher surface and the
increased membrane non-homogeneity (i.e., varied flux distribution over
the membrane surface and the local high flux would promote fouling (see
Section 1.6)) [9]. TFC RO membranes consisting of PA skin layer have
ridge and valley surface morphology that contributes to the roughness.
In contrast, CA membrane as well as semi-aromatic NF membranes
19
1.3 MEMBRANE PROPERTIES AND CHARACTERIZATIONS
20.
possess smoother surface,which is less prone to initial foulant deposi-
tion/growth [58–60]. Nevertheless, surface modification can be applied
to decrease the roughness, such as the polyvinyl alcohol (PVA) coating
on BW30 membrane (Dow Filmtec) [61].
1.3.1.4 Surface Charge
The surface charge of a membrane is generally dependent on its
charged functional groups or the preferential adsorption of some specific
ionic species [9]. Most TFC RO membranes have negatively charged active
surfaces at neutral pH, due to the presence of –COOH functional groups
on the PA layer. The surface charge can influence solute rejection. For
example, the rejection of sodium chloride by a typical RO membrane
can be partially contributed by Donnan exclusion effect [13], i.e., Cl
is
retained by the negatively charged surface due to electrostatic repulsion,
and Na+
is also retained to maintain charge neutrality [13]. The rejection of
charged trace organic solutes is also affected by the charge of membrane
[62]. Moreover, the membrane water permeability may be affected by sur-
face charge, as evidenced by the lowest water flux at pH 5 (i.e., the isoelec-
tric point of the membrane) where membrane surface is least charged [63].
On the other hand, the membrane surface charge plays an important role
in fouling. The attractive force between oppositely charged foulants and
membrane surface has a strong tendency to induce foulant deposition
[64]. Membrane-foulant interaction can greatly affect flux performance
at initial fouling stage [65].
1.3.1.5 Stability
The mechanical, chemical and thermal stabilities of a membrane are
important for it to be successfully applied in a membrane process. The
requirement of the mechanical strength of a RO membrane depends
on its application. For example, SWRO membrane shall withstand higher
pressure than the BWRO membrane. The chemical and thermal stabilities
are closely related to the type of materials used for membrane fabrica-
tion. The RO membranes made of CA have relatively poor stability
against chemicals, bacteria, and temperature. The typical operating con-
ditions for such membranes are in range of pH 5–7 to avoid the hydro-
lysis of the polymer, at temperature below 30°C to avoid the annealing
effect (see Section 1.2.1). In contrast, the most widely used TFC RO mem-
branes with PA selective layer are generally more stable, except that it
has low chlorine resistance. To prevent unacceptable membrane damage,
the chlorine level shall be carefully controlled at a level below 0.1 ppm
(Table 1.3) [66, 67].
20 1. REVERSE OSMOSIS MEMBRANE SEPARATION TECHNOLOGY
21.
1.3.2 Membrane Characterizations
1.3.2.1Performance Tests
Membrane filtration setup is used to test water permeability and the
rejection of the solutes of interests. NaCl rejection is the most commonly
used separation efficiency indicator for RO membranes. Molecular weight
cut-off (MWCO), defined as the molecular weight of a solute that is
rejected by membrane at 90%, is also used to represent the “pore size”
or the selectivity of RO membrane (see Table 1.1), although this concept
is more commonly used for UF/MF membranes or the support of RO/
NF membranes.
1.3.2.2 Microscopic Methods
Microscopic characterization is used for the visualization of the mor-
phology and the structure of membrane surface and cross-section. It
can be also used for the characterization of fouled membranes to provide
the details about the morphology, structure and properties of the foulant
cake layer. Scanning electron microscopy (SEM) is the most widely used
tool to visualize the surface and cross section of clean and fouled mem-
branes, attributing to its high resolution (as good as 5 nm for polymeric
samples) and relatively easy sample preparation [68]. Transmission elec-
tron microscopy (TEM) generally provides higher resolution (atomic scale
for crystalline samples), especially in detailing the structural information
of membranes and foulants [61, 69], but the sample preparation demands
more skilled hands and complicated procedures. Compared to SEM and
TEM, confocal laser scanning microscopy (CLSM) has lower resolution
(microscale), but it is a powerful tool for characterizing membrane biofoul-
ing [70] and macroporous structure [68, 71]. Atomic force microscopy
(AFM) provides the information about membrane surface topography
and is used as a standard method to measure membrane surface
roughness [58].
1.3.2.3 Spectroscopic Methods
Most spectroscopic methods are used to provide the chemistry infor-
mation of membranes, such as Fourier transform infrared spectroscopy
(FTIR), X-ray photoelectron spectroscopy (XPS), and energy dispersive
spectroscopy (EDX). FTIR identifies various chemical bonds of membrane
materials based on its adsorption of infrared irradiation [61]. XPS and EDX
are able to identify elements. The former is a highly surface-sensitive tech-
nique that measures the elemental composition and chemical bonding for
top 1–5 nm surface region [9]. It can detect all the elements with an atomic
number of 3 and above, with detection limit of parts per thousand for most
of the elements. Moreover, the depth profile with XPS can be obtained
using ion beam to etch the layers of membrane surface [72]. EDX is a less
21
1.3 MEMBRANE PROPERTIES AND CHARACTERIZATIONS
22.
sensitive technique, butit can be coupled with SEM or TEM to analyze
specific locations with constructed elemental mapping. Different from
these chemistry analyzing techniques, electrical impedance spectroscopy
(EIS) provides the structural information of membrane supports [73].
1.3.2.4 Other Characterization Techniques
The contact angle of a flat-sheet membrane surface is measured using a
goniometer to provide the hydrophilicity/hydrophobicity information,
while the dynamic contact angle of a hollow fiber membrane is measured
using a tensiometer according to Wilhelmy method [74]. The zeta poten-
tial is measured using streaming potential analyzer for understanding
surface charge characteristics. The measurement can be performed at a
series of pHs/ionic strength to obtain the isoelectric point or comprehen-
sive information of surface charge. AFM force measurement (different
from imaging mode for obtaining topography) can be used to characterize
the interaction between the membrane surfaces (or fouled membrane sur-
faces) and foulants. Such interaction forces correlate well with membrane
fouling behavior [75, 76]. All the characterization methods are summa-
rized in Table 1.4.
1.4 MEMBRANE MODULES AND PROCESS OPERATION
1.4.1 Membrane Modules
RO membrane modules are generally classified into four groups,
including spiral wound module (SWM), hollow fiber module, plate-
and-frame module and tubular module. Although the SWM design is
dominant in the market, other types of modules can still find their niche
applications.
1.4.1.1 Spiral Wound Module (SWM)
SWM is the most widely used design for RO/NF membranes applied in
water industry. The schematic of SWM is shown in Fig. 1.9A. Flat sheet
membranes are sealed on three sides to form leaves attached to a permeate
tube along the unsealed edge. A permeate spacer is placed inside each leaf
to support the membranes and to allow permeate to flow to the permeate
tube. A net-like feed spacer fits between the leaves to define the feed chan-
nel height (1 mm). It also plays an important role in promoting mass
transfer in boundary layer to control the concentration polarization
(Section 1.5). Several leaves and feed spacers are wound around the per-
meate tube to form a SWM with outer rigid casing. There is a trade-off
between feed spacer thickness (fouling reduction) and membrane area
(productivity). Due to the presence of spacer, the packing density of
SWM is lower than that of hollow fiber module.
22 1. REVERSE OSMOSIS MEMBRANE SEPARATION TECHNOLOGY
23.
A typical pressurevessel consists of 6–8 SWMs in series. In a real appli-
cation, the membrane modules at back are exposed to higher feed salinity
and concentration, resulting in lower water flux. The lower flux may lead
to less accumulation of particulates, organic foulants and biofilms, despite
the increased feed concentration. However, the possibility of mineral scale
formation increases, as scaling is much more sensitive to the increased
concentration of scale precursors. Therefore, in RO systems the fouling
caused by the particulates, organic matters, and biofilm formation is usu-
ally more pronounced in the first two membrane elements of the pressure
vessels, and the last two elements suffer more from mineral scaling [77].
1.4.1.2 Hollow Fiber Module
A large number of membrane fibers are potted in a “shell and tube”
arrangement to form a hollow fiber RO membrane module (Fig. 1.9B). It
is generally a shell-side feed module, where high pressure up to
1000 psi is applied externally on the shell side of the membranes. Hence,
hollow fiber membranes are self-support and have small diameters [78].
Flat-sheet
membrane
Feed
spacer
Permeate
tube
Membrane
leaf
Permeate
spacer Feed inlet
Retentate
Permeate
Feed spacer
Permeate spacer
Membrane
Feed flow
Feed
Permeate
Hollow fibers
“Shell” Membranes
(tubes)
Feed
Container
Disc
(A)
(B)
(D)
(C)
Central axis
Concentrated
water
Permeate Raw water
RO membrane
Retentate
Permeate
flow
Retentate
Permeate
Membrane
leaf
FIG. 1.9 RO membrane modules. (A) Spiral wound module; (B) hollow fiber module;
(C) plate-and-frame module; and (D) tubular module. Adapted from Baker RW. Reverse osmosis.
Membrane technology and applications. John Wiley Sons, Ltd; 2004. p. 191–235; Fane AG, Wang
R, Tang C. Membrane technology for water: microfiltration, ultrafiltration, nanofiltration, and reverse
osmosis. Treatise on water science, vol. 4. Amsterdam; Hackensack, NJ: Elsevier Science; 2011. p. 301;
kobelco-eco.co. Available from: http://www.kobelco-eco.co.jp/english/product/dt_module/genri.html.
23
1.4 MEMBRANE MODULES AND PROCESS OPERATION
24.
Currently, the onlylarge company that makes hollow-fiber RO membrane
elements is Toyobo, Japan. The membranes are made of cellulose triace-
tate, which has high chlorine resistance, but relatively low water perme-
ability (compared to TFC RO membranes). A high productivity per
module can be still attained due to the major advantage of high packing
density of hollow fiber module. The feed water flow regime in a hollow
fiber module is laminar, resulting in little or no “scrubbing effect” and
thus promoting membrane fouling. Therefore, it requires more enhanced
water pretreatment to remove particulate foulants from the feed.
1.4.1.3 Plate-and-Frame Module
Plate-and-frame module uses flat sheet TFC membranes. The mem-
branes and discs are installed to a pressure tight case using the central axis
only, allowing easy assembly and disassembly (Fig. 1.9C). The flat sheets
can be easily removed from the module and hand-cleaned individually
(i.e., easier maintenance and better cleaning). However, it has lower pack-
ing density, which is about half of that of SWM. As a result, the plate-and-
frame module is not ideal for municipal water RO desalination, but for
high solids applications such as food processing [77].
1.4.1.4 Tubular Module
As shown in Fig. 1.9D, tubular module employs membranes of tube
shape (similar to hollow fiber membrane, but with larger diameter of
5–15 mm), the material of which is generally cellulosic based for RO appli-
cations. Similar to the plate-and-frame module, the tubular module has
relatively low packing density and allows for robust cleaning methods,
therefore it is generally used to process difficult feed streams such as those
with high solids content and/or greases and fats. For the control of con-
centration polarization, a high flow rate is required to achieve turbulent
flow regime.
1.4.2 Process Operation
Membrane filtration can be operated in cross-flow and dead-end
modes. The cross-flow filtration is dominant in most RO and NF processes
to provide a steady production rate with a continuous cross-flow to con-
trol the concentration polarization and fouling. The dead-end mode is
used in some low pressure membrane (i.e., UF/MF) processes for energy
saving, such as the pre-treatment of RO where feed streams have rela-
tively low levels of suspended solids or turbidity [9].
Membrane modules can be connected in parallel or in series or the com-
bination of both. In a typical SWRO plant, the modules are arranged in
both parallel and series. As shown in Fig. 1.10A, the feed to each pressure
24 1. REVERSE OSMOSIS MEMBRANE SEPARATION TECHNOLOGY
25.
vessel in Stage1 is similar because they are connected in parallel. The con-
centrate from Stage 1 enters as the feed to Stage 2 and possibly followed by
Stage 3 to increase the total recovery. As the volume of the feed to Stage 2
and 3 decreases, there are fewer numbers of pressure vessels in parallel,
which is known as tapered cascade. Two-pass connection (Fig. 1.10B) is
adopted to attain higher removal efficiency of contaminants, such
as boron [79, 80]. In this arrangement, the permeate from the first pass
enters the second pass as the feed for further treatment. The product water
from the second pass will be improved in quality.
1.5 CONCENTRATION POLARIZATION
RO membrane process and other pressure driven membrane processes
accomplish a separation with their ability to transport one component
more readily than another. For a feed containing a solute and a solvent,
the solvent permeates through the membrane whereas the solute is
(partly) retained by the membrane under applied pressure. Hence, the
concentration of the solute in the permeate is lower than that in the bulk
of the feed solution. The retained solutes accumulate at the membrane
surface, leading to a higher solute concentration near the surface com-
pared to the bulk concentration. This phenomenon is known as concen-
tration polarization (CP) [15]. This concentration build-up leads to a
FIG. 1.10 Membrane module/pressure vessel connection in (A) tapered cascade 3:2:1
array; (B) two-pass connection. Adapted from Fane AG, Wang R, Tang C. Membrane technology
for water: microfiltration, ultrafiltration, nanofiltration, and reverse osmosis. Treatise on water sci-
ence, vol. 4. Amsterdam; Hackensack, NJ: Elsevier Science; 2011. p. 301.
25
1.5 CONCENTRATION POLARIZATION
26.
diffusive flow ofthe solute back to the bulk of the feed, which will reach
a steady-state condition after certain period of time. The convective
transport of the solute will be balanced by the permeate flow through
the membrane and the diffusive back transport to the bulk, as shown
in Fig. 1.11 and Eq. (1.9):
Jc + D
dc
dx
¼ Jcp (1.9)
The boundary conditions are:
x ¼ 0,c ¼ cm,
x ¼ δ,c ¼ cb:
Integration of Eq. (1.9) results in
ln
cm cp
cb cp
¼
Jδ
D
(1.10)
or
cm cp
cb cp
¼ exp
Jδ
D
(1.11)
The ratio of the diffusion coefficient D and the thickness of boundary
layer δ is called mass transfer coefficient, k:
k ¼
D
δ
(1.12)
The definition of intrinsic rejection Rint of a RO membrane can be found
in Eq. (1.5). By substituting Eqs. (1.5) and (1.12) into Eq. (1.11), we have:
J·c
D·dc/dx
J·cp
cb
cp
Bulk feed Boundary
layer (d)
Membrane
cm
FIG. 1.11 Concentration polarization profile.
26 1. REVERSE OSMOSIS MEMBRANE SEPARATION TECHNOLOGY
27.
cm
cb
¼
exp J=k
ð Þ
Rint+ 1Rint
ð Þexp J=k
ð Þ
(1.13)
The ratio cm/cb is the concentration polarization modulus. It increases
with the increasing flux J, with increasing Rint and with decreasing k, when
Rint ≪ 1. When the solutes are completely retained by the membrane, i.e.,
Rint ¼ 1 and cp ¼ 0, Eq. (1.13) becomes:
cm
cb
¼ exp J=k
ð Þ (1.14)
The mass transfer coefficient k can be determined from Sherwood num-
ber Sh:
Sh ¼
kdh
D
(1.15)
Sherwood number is related to Reynolds number Re and Schmidt num-
ber Sc:
Sh ¼ a Reb
Scc
dh=L
ð Þd
(1.16)
Sc ¼
v
D
(1.17)
Re ¼
udh
ν
(1.18)
where dh is the hydraulic diameter, L is the channel length, u is the cross-
flow velocity, and v is the kinematic viscosity. In Eq. 1.16, a, b, c, and d are
the constant and their magnitudes depend on the flow regime and the
geometry of flow channel [9].
CP gives rise to an increased solute concentration at the membrane
surface, which decreases the water flux and apparent solute rejection
(see Fig. 1.8 and Section 1.3.1.1). The CP of foulants can accelerate membrane
fouling [81]. The presence of foulant cake layer on the other hand may also
enhance the CP, which is called cake-enhanced CP [82]. This phenomenon is
caused by the decreased mass transfer of solutes (e.g., ions) in the cake layer,
as a result of decreased shear flow rate within the layer. Because the CP
modulus (cm/cb) increases with increasing water flux and decreasing mass
transfer coefficient, the CP can be controlled by operating at a lower water
flux, and enhancing the mass transfer at membrane surface via increasing
the cross-flow velocity and/or the use of a well-designed spacer, etc.
1.6 MEMBRANE FOULING AND CONTROL
Membrane fouling is defined as the deposition of contaminants on a
membrane surface and/or inside membrane pores. Non-porous RO mem-
branes generally suffer from the foulant cake deposition on the membrane
27
1.6 MEMBRANE FOULING AND CONTROL
28.
surface. According tothe nature of foulants, membrane fouling can be cat-
egorized into colloidal fouling, organic fouling, inorganic scaling, and bio-
fouling (Fig. 1.12).
Similar to the CP, membrane fouling can directly lead to water flux
drop during constant pressure operation. However, the foulant layer
remains on the membrane surface when the permeate flux is reduced to
zero, while CP disappears in absence of permeate flux. The timescale
for CP to reach a stable condition or disappear is short, while the fouling
typically occurs over longer timescale (rapid fouling can occur under
unfavorable conditions). Although CP and fouling are two different phe-
nomena, CP can accelerate membrane fouling as CP causes increased fou-
lant concentration at membrane surface, while foulant deposition can
result in enhanced CP.
1.6.1 Factors Affecting Membrane Fouling
A great number of factors can affect RO membrane fouling. In general,
these factors are classified into three groups as shown in Fig. 1.13, includ-
ing membrane properties, feed water composition, and hydrodynamic
conditions.
1.6.1.1 Membrane Properties
The membrane properties such as hydrophilicity, roughness, and sur-
face charge can affect membrane fouling. Generally, a membrane with
hydrophilic and smooth surface and low surface charge is preferred to
resist fouling at initial stage [57, 58, 83, 84]. For example, a NF membrane
with a smooth and hydrophilic surface exhibited more sustainable flux
performance at the initial stage of bovine serum albumin (BSA) fouling,
as compared with other RO/NF membranes of rougher and less hydro-
philic surfaces [65]. In addition, the surface functional groups are also
important to membrane fouling. The –COO–
on the TFC PA membrane
surface may interact with specific ions such as Ca2+
, which accelerates
membrane fouling [85]. However, these effects could hardly be observed
under severe fouling conditions such as at longer fouling duration, as
FIG. 1.12 Types of membrane foulants.
28 1. REVERSE OSMOSIS MEMBRANE SEPARATION TECHNOLOGY
29.
fouling is dominatedby foulant-deposited-foulant interaction instead of
foulant-membrane interaction [76, 86].
1.6.1.2 Feed Water Composition
The type and concentration of foulants can significantly affect mem-
brane fouling. For instance, the feed water containing a high concentration
of sparingly soluble salts is susceptible to scale formation [87], while the
presence of microorganisms and nutrients may promote biofouling. On
the other hand, the solution chemistry such as pH, ionic strength, and spe-
cific ions can drastically change the physiochemical properties of foulants
(i.e., functional groups, size, charge, conformation, etc.) [88], or affect the
interaction between foulants or between foulants and membranes [89].
Unfavorable solution conditions can lead to less repulsion between fou-
lants and/or foulants and membrane, resulting in severe organic and col-
loidal fouling [65, 86, 90–92].
1.6.1.3 Hydrodynamic Conditions
Hydrodynamic conditions, including the level of water flux/pressure,
cross-flow velocity, recovery, temperature and module/spacer design, are
important to membrane fouling. The influence of some factors on mem-
brane performance (in the absence of foulants) has been discussed in
Section 1.3.1.1. Those factors affecting CP can also influence the membrane
fouling. For example, a high-water flux level leads to more severe CP of
foulants, which may promote gel formation on the membrane surface.
In addition, the greater drag force towards membrane surface may facil-
itate foulant deposition [65]. Increasing cross-flow velocity enhances mass
Feedwater composition
Foulant type, concentration
pH, ionic strength,
specific ions such as Ca2+
Hydrodynamic conditions
Flux
Cross-flow velocity
Recovery
Temperature
Module and spacer design
Membrane properties
Roughness
Charge
Hydrophobicity
Surface functional groups
FIG. 1.13 Factors affecting membrane fouling. Reprinted from Tang CY, Chong TH, Fane AG.
Colloidal interactions and fouling of NF and RO membranes: a review. Adv Colloid Interface Sci
2011;164(1–2):126–43.
29
1.6 MEMBRANE FOULING AND CONTROL
30.
transfer at membranesurface, resulting in less CP as well as less foulant
deposition [65]. The use of spacer helps to increase turbulence of flow and
thus enhance the mass transfer, but it is noted that the poor design of
spacer (e.g., presence of hydraulic dead zones) may promote foulant
deposition [85, 93].
1.6.2 Fouling Mitigation
In addition to the control of the parameters that affect fouling (dis-
cussed in Sections 1.6.1.1–1.6.1.3), other measures are also commonly
applied to mitigate fouling, including pretreatment of feed water, enhanc-
ing membrane antifouling property, using chemicals/agents during RO
operation and frequent cleaning [94]. These methods are summarized
as follows:
• Properly designed RO system and operating conditions. For example,
selection of suitable membrane modules and operating conditions (i.e.,
recovery, cross-flow velocity, pressure or flux level, etc.) according to
the feed water composition.
• Enhancing antifouling property of the membrane. To make membrane
surface smoother and more hydrophilic is a common strategy to reduce
fouling, which can be achieved by surface modification through coating
and grafting, etc. [94]. Recently, use of novel materials such as silver
nanoparticles and graphene oxide (GO) to impart anti-biofouling
properties has become an attractive direction [27, 94].
• Pretreatment of feed solution. A good pretreatment system is essential
to achieve a long RO membrane life. Different pretreatment processes
can be chosen depending on the feed composition and the RO
membrane materials/modules. The following methods are commonly
used in pretreatment: coagulation and granular media filtration, UF/
MF, adsorption by activated carbon, chlorination [15, 95]. It is noted that
CA RO membrane demands bacteria-free feed water and the
chlorination in pretreatment is an essential step [19].
• Use of chemicals during RO process. For example, adding a complexing
agent such as ethylenediaminetetraacetic acid (EDTA) to reduce free
calcium ions is helpful in fouling control; pH adjustment is important to
alter the charge of proteins and thereby affecting the foulant-foulant or
foulant-membrane interactions.
• Cleaning. Although the above-mentioned methods are able to reduce
fouling to certain extent, various cleaning methods are always
employed in practical applications. Physical cleaning and chemical
cleaning are the common methods used for RO membranes [15, 94].
A typical cleaning regime consists of flushing membrane modules by
circulating cleaning solutions at a high flow rate, followed by soaking
30 1. REVERSE OSMOSIS MEMBRANE SEPARATION TECHNOLOGY
31.
and then secondtime flush, and so on. The commonly used chemical
cleaning agents include acids, alkalis, chelatants, detergents and
sterilizers [15, 19].
1.7 RO APPLICATIONS
RO has received various applications mainly comprising water produc-
tion and solute concentration. The former produces clean water/desalted
water (solvent) from feed water while the latter focuses on the production
of concentrated solutes.
1.7.1 Desalination and Water Reclamation
1.7.1.1 Desalination
More than one-half of the RO systems currently installed are for the
desalination of seawater and brackish water [96]. Table 1.5 presents a com-
parison of the components in seawater and brackish water. The data show
TABLE 1.5 Comparison of the Components in Seawater and Brackish Water
Components Seawater (mg/L)
Brackish water 1 (mg/
L)
Brackish water 2 (mg/
L)
Ca2+
440–670 175 179
Mg2+
1400–1550 58 132
Ba2+
0.010 0.10 0.06
Sr2+
5–7.5 – 26.4
Boron 4.9–5.3 – –
Na+
12,000 170 905
Cl
21,000–23,000 72 1867
SO4
2 2400–2670 670 384
HCO3
120–142 260 146
TDS 38,000–40,000 1320 3664
DOC 2 – 1.4
Note: the seawater source is surface water from the Mediterranean Sea (Toulon, France), and both of the
brackish water sources are groundwaters (the first is from Port Hueneme, CA, USA; the second is from
Martin county, FL, USA).
Adapted from Greenlee LF, Lawler DF, Freeman BD, Marrot B, Moulin P. Reverse osmosis desalination: water
sources, technology, and today’s challenges. Water Res 2009 43(9):2317–48.
31
1.7 RO APPLICATIONS
32.
obvious differences betweenthe two types of water. The seawater has a
much higher total dissolved solids (TDS) concentration, mainly due to
the large amounts of Na+
and Cl
(the ratios of Na/TDS and Cl/TDS in
seawater are significantly higher than that in brackish water). The boron
content in seawater is generally higher than that in brackish water [97].
A typical RO system for water production consists of pretreatment,
membrane separation, and post treatment [9, 98]. The examples of differ-
ent RO systems are shown in Table 1.6. For seawater desalination, SWRO
membranes are used to attain high salt rejection during the membrane
process. The high osmotic pressure (high salinity) requires an operating
pressure of 60–70 bar, making SWRO more energy intensive than other
RO/water source options. Media filtration or low-pressure membrane
process (MF or UF) is adopted for the pretreatment of seawater to reduce
membrane fouling. The product water is usually conditioned by the addi-
tion of calcium ions to meet the requirement of World Health Organiza-
tion (WHO) [99]. The concentrate brine will pass through an energy
recovery device prior to the discharge to ocean or further treatment. Since
the end of the 1970s, the energy consumption of SWRO has been reduced
significantly from more than 15 kWh/m3
to 2 kWh/m3
due to continual
technological improvements (Fig. 1.14) [8]. The current energy consump-
tion is close to the thermal minimum energy of desalination (1.06 kWh/m3
for seawater of 35 g/L at 50% recovery) [8]. The actual consumption is
higher than this minimum value, as desalination plants are finite in size
and do not operate as a reversible thermodynamic process [8]. BWRO is
usually operated at modest-size plants (not a limitless source) with higher
recovery (75%–90%). The lower salinity of brackish water requires much
lower pressure (6–30 bar) [97] and thus lower energy consumption.
SWRO generally faces the fouling problem caused by particulate mat-
ter, organic compounds, and biological growth, while the high recovery in
BWRO causes severe scaling problems mainly due to the calcium sulfate
and carbonate precipitation. In addition, boron removal of RO system is
also a concern for achieving drinking water standard, due to the low rejec-
tion of boron compared to other ions at neutral pH [97]. The high boron
concentration in seawater often requires a second RO pass to further
reduce the boron content to meet the drinking water quality
(2.4 mg/L [100]). Although boron concentration in brackish water is
low, the relatively low rejection of BWRO membrane and higher recovery
still demands another boron removal strategy, such as boron-specific ion
exchange [97].
1.7.1.2 Water Reclamation/Wastewater Treatment
Wastewater sources that use RO treatment include municipal wastewa-
ter, industrial wastewater, and other contaminated water sources (e.g.,
leachate water). When the feed water is wastewater or treated wastewater,
32 1. REVERSE OSMOSIS MEMBRANE SEPARATION TECHNOLOGY
33.
TABLE 1.6 Examplesof RO Systems for Desalination and Water Reclamation
Application Source water Membranes
Pressure
(bar) Pretreatment Posttreatment Target removals
Desalination Seawater SWRO 60–70 Media filtration or
MF/UF
Calcium addition, alkalinity
adjustment, disinfection
Salinity
Brackish
groundwater
BWRO 6–30 Filtration Salinity
Reclamation Treated
wastewater
BWRO 20 bar MF/UF Advanced oxidation treatment Pathogens, trace
organics
Wastewater BWRO Membrane
bioreactor (MBR)
Advanced oxidation treatment Pathogens, trace
organics
Adapted from Fane AG, Wang R, Tang C. Membrane technology for water: microfiltration, ultrafiltration, nanofiltration, and reverse osmosis. Treatise on water science,
vol. 4. Amsterdam; Hackensack, NJ: Elsevier Science; 2011. p. 301; Greenlee LF, Lawler DF, Freeman BD, Marrot B, Moulin P. Reverse osmosis desalination: water sources,
technology, and today’s challenges. Water Res 2009 43(9):2317–48.
33
1.7
RO
APPLICATIONS
34.
the target removalsare pathogens and trace organics, instead of salinity
(Table 1.6). In the case of municipal wastewater, the treated wastewater
(i.e., secondary effluent) as RO feed is more common, as it builds on the
existing municipal wastewater infrastructure. MF/UF pretreatment is
generally operated in the dead-end cycles to provide the feed with low
solid content to the RO unit. The low salinity content allows the RO to
operate at much lower pressure with higher recovery (75% vs. 50%) as
compared to a SWRO unit. Advanced oxidation (e.g., UV) as post treat-
ment can provide an added barrier to virus and oxidize the trace organics
present in the RO permeates. The high quality permeate water produced
by the dual membrane reclamation processes (MF/UF + RO) is generally
suitable for the demanding industrial applications (e.g., ultrapure water
for the electronics, pharmaceutical, and power generation industries)
and indirect potable reuse (IPR). A comprehensive review of membrane
reclamation plant and comparison with SWRO was given by C^
ot
e et al.
[99]. The detailed reviews on pretreatment and retentate treatment tech-
nology can be also found elsewhere [95, 101, 102].
The target for water treatment varies for different industrial wastewa-
ters and contaminated water sources. For example, the targets of RO treat-
ment for landfill leachate and electroplating wastewater are for
purification and discharge [103, 104], while the wastewaters from dairy
industry, textile industry, and olive mill are often reused after RO
FIG. 1.14 The change in energy consumption for the reverse osmosis stage in SWRO
plants from the 1970s to 2008. The horizontal dashed line corresponds to the theoretical mini-
mum energy (1.06 kWh/m3
) required for desalination of 35 g/L seawater at 50% recovery.
The energy data presented here exclude the energy required for intake, pretreatment,
post-treatment, and brine discharge. Reprinted from Elimelech M, Phillip WA. The future of sea-
water desalination: energy, technology, and the environment. Science 2011;333(6043):712–7.
34 1. REVERSE OSMOSIS MEMBRANE SEPARATION TECHNOLOGY
35.
treatment [105–107], andsome RO process is targeted for zero liquid dis-
charge [108]. The pretreatment and post-treatment processes depend on
both the wastewater sources and the final target. For high recovery or zero
liquid discharge, controlled crystallization can be used as a post treatment
[103, 108]. When treated water is recycled as process water (without the
demand of ultrapure water quality), the wastewater is generally pre-
treated by UF and no post treatment is needed after RO unit [106]. One
of the most attractive applications is to separate valuable products from
wastewater, such as the reclamation of plating wastewater and recovery
of heavy metals [19]. An example is the recovery of nickel from nickel plate
rinsing tanks. The use of RO unit produces a permeate water with low con-
centration of nickel for reuse and a retentate stream with concentrated
nickel that can be sent back to plating tank [19].
1.7.2 Ultrapure Water Production
Ultrapure water production for the electronics industry is an estab-
lished application of RO. The usual feed is the municipal drinking water,
typically containing less than 200 mg/L dissolved solids. To meet the
requirement of extraordinarily high purity (almost only water molecules
present in the ultrapure water, refer to Table 1.7 for the specifications of
drinking water and ultrapure water), the municipal drinking water
undergoes extensive treatment with a complex array of operations [19].
As the key part of the process, RO unit removes more than 98% of dis-
solved salts and particulates under high recovery (90%). In addition
to RO, carbon absorption removes dissolved organics, ion exchange step
removes trace ionic impurities, and UV sterilizers and cartridge microfil-
ters are used to maintain sterility [19].
1.7.3 Solute Concentration
1.7.3.1 Concentration of Juices and Dairy Products
The start of the interests in RO concentration of fruit juices dates back to
40 years ago, due to its advantages over conventional thermal based pro-
cesses: (1) low damage to the thermal sensitive components, (2) low
energy consumption, and (3) ability to produce high quality products
(retain the flavor of products) [96]. Prior studies have reported RO appli-
cations for various juice concentrations, including apple, pear, grape,
orange, blackcurrent, etc. [109–113] (Table 1.8). The high solid content
in the feed preferentially uses the plate-and-frame module or tubular
module which is suitable for tougher cleaning methods [96] (the descrip-
tion of different RO membrane modules can be found in Section 1.4). In an
example of the concentration of apple juice, the RO-evaporation system
35
1.7 RO APPLICATIONS
36.
shows excellent performance[117]. RO as pre-concentration step can
remove more than 50% of the water prior to evaporation, while maintain-
ing 98%–99% of sugar and acid as well as 80%–90% of volatile flavors in
the concentrate. It achieves a sugar concentration level of 20–25°Brix,
while the subsequent evaporation can boost the level to above 75°Brix.
This combined system can save energy of 60%–75% as compared to direct
evaporation. Meanwhile, the permeate water from the RO unit can be
recycled as process water (i.e., water reuse) [117].
Similar to fruit juices, milk and whey can be also concentrated by RO,
with the advantage of low temperature operation. Pre-concentration of
milk and whey prior to transportation can reduce transportation costs
[96, 117]. The main application of RO seems to be the treatment of dairy
process waters and effluents, in order to recover milk proteins and lactose,
while obtaining a permeate that can be recycled for rinsing or cooling [105,
117]. Most of earlier work used spiral wound modules (SWM) because of
their availability and low cost [105, 117]. On the other hand, concentration
of milk by RO has great potential for ice-cream manufacturing, as 70% of
water can be removed while the solids can be well retained [117].
TABLE 1.7 Specifications for Typical Municipal Drinking Water and Ultrapure Water
Ultrapure water Drinking water
Resistivity (MΩ cm) 18.2 –
TOC (ppb) 5 5000
Particles/L by laser 0.1 μm 100 –
Bacteria/100 mL by culture 0.1 30
Silica, dissolved (ppb) 3 3000
Boron (ppb) 1 40
Ions (ppb)
Na+
0.01 3000
K+
0.02 2000
Cl
0.02 10,000
Br
0.02 –
NO3
0.02 –
SO4
2 0.02 15,000
Total ions 0.1 100,000
Adapted from Baker RW. Reverse osmosis. Membrane technology and applications. John Wiley Sons, Ltd; 2004.
p. 191–235.
36 1. REVERSE OSMOSIS MEMBRANE SEPARATION TECHNOLOGY
37.
TABLE 1.8 Performanceof RO Membrane in Juice Concentration and Dealcoholization
Feed Membrane Initial
concentration
Final
concentration
Operating conditions Ref.
Juices Apple juice Tubular PA membrane 11°Brix 26°Brix P ¼ 55 bar, T ¼ 35°C [109]
Blackcurrent juice Tubular PA membrane 16.5°Brix 28.6°Brix P ¼ 60 bar, T ¼ 25°C [110]
Orange juice Plate-and-frame PA
membrane
8°Brix 36°Brix P ¼ 60 bar, T ¼ 25°C [111]
Grape juice Plate-and-frame PA
membrane
14.7°Brix 28.2°Brix P ¼ 60 bar, T ¼ 40°C [112]
Pear juice PA membrane (pilot
plant)
11.9°Brix 28.9°Brix P ¼ 40 bar, T ¼ 25–27°
C
[113]
Fermented
beverage
Home-made alcoholic
beveragea
Spiral wound
membrane
5.5%v/v 0.5%v/v P ¼ 35 bar, T ¼ 0°C [114]
Beerb
CA membrane 5.28%v/v – P ¼ 35 bar, T ¼ 0°C,
RE ¼ 3.6%
[115]
Red winec
CA membrane 12%v/v 8.4%v/v P ¼ 16 bar, T ¼ 30°C,
RE ¼ 2.5%
[116]
Note: P, feed pressure (bar); T, temperature (°C); RE, ethanol rejection (%); initial and final concentrations for juices are in the unit of °Brix (sugar content) and those for
fermented beverages are in the unit of %v/v (alcohol concentration).
a
Operated in continuous mode.
b
Operated in diafiltration mode.
c
Operated in semi-continuous mode.
37
1.7
RO
APPLICATIONS
38.
1.7.3.2 Dealcoholization ofFermented Beverage
The demand for low-alcohol and alcohol-free drinks has been con-
stantly growing. RO can be used to reduce the alcohol from wine, beer
and cider without altering their flavor and quality [96, 117, 118]. Because
this process is carried out at low temperature compared to traditional dis-
tillation, it does not involve phase change for alcohol removal [115]. Exam-
ples of RO dealcoholization are listed in Table 1.8. The dealcoholization by
RO often comprises the following steps [117]:
• Pre-concentration—the fermented beverage is separated into a
permeate stream containing water and alcohol, and a retentate stream
consisting of concentrated drinks and flavors.
• Diafiltration—addition of desalted and deoxygenized water by keeping
the feed volume constant to achieve higher removal of alcohol and
higher retention of desired aroma.
• Alcohol adjustment—fine tuning of taste and alcohol content by
addition of desalted and deoxygenized water.
1.7.4 Organic Solvent Separation
Although the RO membranes are designed for the applications related
to aqueous solution, the membrane materials are considered chemically
resistant to some organic solvent, driving the applications of RO for the
treatment of solvent-contaminated wastewater [96]. Earlier work has
shown the feasibility of separation of small solvent molecules from larger
hydrocarbons using cellulose acetate (CA) and TFC polyamide (PA) RO
membranes [96]. However, the membrane materials CA and polysulfone
are not resistant to certain solvents or hydrocarbons [96, 119]. Hence, it
was later found that some other polymers such as polyimide show good
resistance to solvent [119]. One commercial project by Mobil Oil devel-
oped a RO process to separate up to 50% solvent from the dewaxed oil
using polyimide SWMs to save the energy of conventional solvent dewax-
ing process [19, 119]. Recently, solvent resistant nanofiltration (NF) has
gained more and more interests in the field of organic solvent separation;
as the solvent resistant NF membranes show significantly better stability
during long term run and much higher solvent flux, as compared to the
conventional RO membranes [120].
1.8 CONCLUSIONS
Reverse osmosis (RO) has a significant role in water industry. It is
widely used for desalination, water reclamation and ultrapure water pro-
duction. In addition, it also has niche applications such as solute
38 1. REVERSE OSMOSIS MEMBRANE SEPARATION TECHNOLOGY
39.
concentration and selectiveseparation. Since the introduction of first thin-
film composite membranes in 1980s, TFC PA membranes have continu-
ously advanced and are still the state-of-the-art RO membranes with more
than 100 times better performance than their first generation membranes
[19]. The further improvement of membrane performance may rely on the
novel materials (e.g., emerging mixed matrix membranes and biomimetic
membranes) [4]. Besides high-performance membranes, the successful
operation of RO plants also depends on smart membrane element
design/process design, and appropriate process operating conditions,
to minimize the negative effects from concentration polarization and
membrane fouling, to meet the requirement of product water as well as
to reduce capital cost and energy consumption. For example, the optimi-
zation of membrane module design with improved hydrodynamics,
improved cleaning methods and energy recovery devices can contribute
significantly to energy and cost saving.
References
[1] Wang LK, Chen JP, Hung YT, Shammas NK, editors. Handbook of environmental engi-
neering. Membrane and desalination technologies, vol. 13. Totowa, NJ: Humana Press;
2011.
[2] Loeb S, Sourirajan S. Sea water demineralization by means of an osmotic membrane.
University of California, Department of Engineering; 1960.
[3] Cadotte JE, Peterson RJ. Thin-film composite reverse-osmosis membranes: origin,
development, and recent advances. In: Turbak AF, editor. Synthetic membranes,
vol. 1 desalination. p. 350, ACS Symposium Series, 53. Washington, DC: Am. Chemical
Soc.; 1981.
[4] Park HB, Kamcev J, Robeson LM, Elimelech M, Freeman BD. Maximizing the right
stuff: the trade-off between membrane permeability and selectivity. Science 2017;356
(6343):1138–48.
[5] Lee KP, Arnot TC, Mattia D. A review of reverse osmosis membrane materials for
desalination—development to date and future potential. J Membr Sci 2011;370(1):1–22.
[6] Rodrı́guez-Calvo A, Silva-Castro GA, Osorio F, González-López J, Calvo C. Reverse
osmosis seawater desalination: current status of membrane systems. Desalin Water
Treat 2015;56(4):849–61.
[7] Birkett J, Truby R. A figure of merit for appreciating improvements in RO membrane
performance. International Desalination Association News; 2007.
[8] Elimelech M, Phillip WA. The future of seawater desalination: Energy, technology, and
the environment. Science 2011;333(6043):712–7.
[9] Fane AG, Wang R, Tang C. Membrane technology for water: microfiltration, ultrafiltra-
tion, nanofiltration, and reverse osmosis. Treatise on water science, vol. 4. Amsterdam;
Hackensack, NJ: Elsevier Science; 2011;301.
[10] Lau WJ, Gray S, Matsuura T, Emadzadeh D, Paul Chen J, Ismail AF. A review on poly-
amide thin film nanocomposite (TFN) membranes: history, applications, challenges
and approaches. Water Res 2015;80:306–24.
[11] Giwa A, Akther N, Dufour V, Hasan SW. A critical review on recent polymeric and
nano-enhanced membranes for reverse osmosis. RSC Adv 2016;6(10):8134–63.
39
REFERENCES
40.
[12] Jeong BH,Hoek EMV, Yan Y, Subramani A, Huang X, Hurwitz G, et al. Interfacial poly-
merization of thin film nanocomposites: a new concept for reverse osmosis mem-
branes. J Membr Sci 2007;294(1–2):1–7.
[13] Sch€
afer AI, Fane AG, Waite TD. In: Sch€
afer AI, Fane AG, Waite TD, editors. Nanofil-
tration—principles and applications. UK: Elsevier Advanced Technology; 2005.
[14] Wijmans JG, Baker RW. The solution-diffusion model: a review. J Membr Sci
1995;107(1):1–21.
[15] Mulder M. Basic Principles of Membrane Technology. The Netherlands: Kluwer Aca-
demic Publishers; 1996.
[16] Yan J, Lau WWY. Effect of internal coagulant on morphology of polysulfone hollow
hiber membranes. I. Sep Sci Technol 1998;33(1):33–5.
[17] Nguyen TPN, Yun ET, Kim IC, Kwon YN. Preparation of cellulose triacetate/cellulose
acetate (CTA/CA)-based membranes for forward osmosis. J Membr Sci 2013;433:49–59.
[18] Ong RC, Chung TS, de Wit J, Helmer BJ. Novel cellulose ester substrates for high per-
formance flat-sheet thin-film composite (TFC) forward osmosis (FO) membranes.
J Membr Sci 2014;473:63–71.
[19] Baker RW. Reverse osmosis. Membrane technology and applications. John Wiley
Sons, Ltd; 2004. p. 191–235.
[20] Kumano A, Fujiwara N. Cellulose triacetate membranes for reverse osmosis.
In: Advanced membrane technology and applications. Wiley; 2008. p. 21–46.
[21] AlBatniji MS. Performance optimization of brackish water reverse osmosis desalination
plants in Gaza strip. The Islamic University of Gaza; 2016.
[22] Pageau L, Sourirajan S. Improvement of porous cellulose acetate reverse osmosis mem-
branes by change of casting conditions. J Appl Polym Sci 1972;16(12):3185–206.
[23] Idris A, Ismail AF, Noordin MY, Shilton SJ. Optimization of cellulose acetate hollow
fiber reverse osmosis membrane production using Taguchi method. J Membr Sci
2002;205(1–2):223–37.
[24] Saljoughi E, Mohammadi T. Cellulose acetate (CA)/polyvinylpyrrolidone (PVP) blend
asymmetric membranes: preparation, morphology and performance. Desalination
2009;249(2):850–4.
[25] Petersen RJ. Composite reverse osmosis and nanofiltration membranes. J Membr Sci
1993;83(1):81–150.
[26] Freger V. Kinetics of film formation by interfacial polycondensation. Langmuir
2005;21(5):1884–94.
[27] Li D, Yan Y, Wang H. Recent advances in polymer and polymer composite membranes
for reverse and forward osmosis processes. Prog Polym Sci 2016;61:104–55.
[28] Wei J, Liu X, Qiu C, Wang R, Tang CY. Influence of monomer concentrations on the
performance of polyamide-based thin film composite forward osmosis membranes.
J Membr Sci 2011;381(1–2):110–7.
[29] Xu G-R, Xu J-M, Feng H-J, Zhao H-L, Wu S-B. Tailoring structures and performance of
polyamide thin film composite (PA-TFC) desalination membranes via sublayers
adjustment-a review. Desalination 2017;417:19–35.
[30] Ghosh AK, Hoek EMV. Impacts of support membrane structure and chemistry on
polyamide–polysulfone interfacial composite membranes. J Membr Sci 2009;336
(1–2):140–8.
[31] Lee J, Jang JH, Chae HR, Lee SH, Lee CH, Park PK, et al. A facile route to enhance the
water flux of a thin-film composite reverse osmosis membrane: incorporating
thickness-controlled graphene oxide into a highly porous support layer. J Mater Chem
A 2015;3(44):22053–60.
[32] Li X, Chou S, Wang R, Shi L, Fang W, Chaitra G, et al. Nature gives the best solution for
desalination: aquaporin-based hollow fiber composite membrane with superior perfor-
mance. J Membr Sci 2015;494:68–77.
40 1. REVERSE OSMOSIS MEMBRANE SEPARATION TECHNOLOGY
41.
[33] Ahmed FE,Lalia BS, Hashaikeh R. A review on electrospinning for membrane fabri-
cation: challenges and applications. Desalination 2015;356:15–30.
[34] Bui NN, McCutcheon JR. Nanofiber supported thin-film composite membrane for
pressure-retarded osmosis. Environ Sci Technol 2014;48(7):4129–36.
[35] Malaisamy R, Talla-Nwafo A, Jones KL. Polyelectrolyte modification of nanofiltration
membrane for selective removal of monovalent anions. Sep Purif Technol
2011;77(3):367–74.
[36] Liu C, Shi L, Wang R. Crosslinked layer-by-layer polyelectrolyte nanofiltration hollow
fiber membrane for low-pressure water softening with the presence of SO4
2
in feed
water. J Membr Sci 2015;486:169–76.
[37] Xu GR, Wang SH, Zhao HL, Wu SB, Xu JM, Li L, et al. Layer-by-layer (LBL) assembly
technology as promising strategy for tailoring pressure-driven desalination mem-
branes. J Membr Sci 2015;493:428–43.
[38] Duong PHH, Zuo J, Chung T-S. Highly crosslinked layer-by-layer polyelectrolyte FO
membranes: understanding effects of salt concentration and deposition time on FO
performance. J Membr Sci 2013;427:411–21.
[39] Qiu C, Qi S, Tang CY. Synthesis of high flux forward osmosis membranes by chemically
crosslinked layer-by-layer polyelectrolytes. J Membr Sci 2011;381(1–2):74–80.
[40] Sullivan DM, Bruening ML. Ultrathin, cross-linked polyimide pervaporation mem-
branes prepared from polyelectrolyte multilayers. J Membr Sci 2005;248(1–2):161–70.
[41] Hoek EMV, Ghosh AK. Nanotechnology-based membranes for water purification.
In: Nanotechnology applications for clean water. William Andrew Publishing; 2009.
p. 47–58.
[42] Yin J, Kim ES, Yang J, Deng B. Fabrication of a novel thin-film nanocomposite (TFN)
membrane containing MCM-41 silica nanoparticles (NPs) for water purification.
J Membr Sci 2012;423-424:238–46.
[43] Wu H, Tang B, Wu P. Optimizing polyamide thin film composite membrane covalently
bonded with modified mesoporous silica nanoparticles. J Membr Sci 2013;428:341–8.
[44] Liu Y, Rosenfield E, Hu M, Mi B. Direct observation of bacterial deposition on and
detachment from nanocomposite membranes embedded with silver nanoparticles.
Water Res 2013;47(9):2949–58.
[45] Zhao H, Qiu S, Wu L, Zhang L, Chen H, Gao C. Improving the performance of poly-
amide reverse osmosis membrane by incorporation of modified multi-walled carbon
nanotubes. J Membr Sci 2014;450:249–56.
[46] Ma N, Wei J, Qi S, Zhao Y, Gao Y, Tang CY. Nanocomposite substrates for controlling
internal concentration polarization in forward osmosis membranes. J Membr Sci
2013;441:54–62.
[47] Tian M, Wang Y-N, Wang R. Synthesis and characterization of novel high-performance
thin film nanocomposite (TFN) FO membranes with nanofibrous substrate reinforced
by functionalized carbon nanotubes. Desalination 2015;370:79–86.
[48] Tang C, Wang Z, Petrini
c I, Fane AG, H
elix-Nielsen C. Biomimetic aquaporin mem-
branes coming of age. Desalination 2015;368:89–105.
[49] Hovijitra NT, Wuu JJ, Peaker B, Swartz JR. Cell-free synthesis of functional aquaporin
Z in synthetic liposomes. Biotechnol Bioeng 2009;104(1):40–9.
[50] Holt JK, Park HG, Wang Y, Stadermann M, Artyukhin AB, Grigoropoulos CP, et al. Fast
mass transport through sub-2-nanometer carbon nanotubes. Science 2006;312(5776):
1034–7.
[51] Kumar M, Grzelakowski M, Zilles J, Clark M, Meier W. Highly permeable polymeric
membranes based on the incorporation of the functional water channel protein Aqua-
porin Z. Proc Natl Acad Sci U S A 2007;104(52):20719–24.
[52] Zhao Y, Vararattanavech A, Li X, H
elixnielsen C, Vissing T, Torres J, et al. Effects of
proteoliposome composition and draw solution types on separation performance of
41
REFERENCES
42.
aquaporin-based proteoliposomes: implicationsfor seawater desalination using
aquaporin-based biomimetic membranes. Environ Sci Technol 2013;47(3):1496–503.
[53] Qi S, Wang R, Chaitra GKM, Torres J, Hu X, Fane AG. Aquaporin-based biomimetic
reverse osmosis membranes: stability and long term performance. J Membr Sci
2016;508:94–103.
[54] Barboiu M. Artificial water channels—incipient innovative developments. Chem Com-
mun 2016;52(33):5657–65.
[55] Ho W, Sirkar K. Membrane handbook. Springer US; 2012.
[56] Tang CY, Chong TH, Fane AG. Colloidal interactions and fouling of NF and RO mem-
branes: a review. Adv Colloid Interf Sci 2011;164(1–2):126–43.
[57] Zhu X, Elimelech M. Fouling of reverse osmosis membranes by aluminum oxide col-
loids. J Environ Eng 1995;121(12):884–92.
[58] Elimelech M, Zhu X, Childress AE, Hong S. Role of membrane surface morphology in
colloidal fouling of cellulose acetate and composite aromatic polyamide reverse osmo-
sis membranes. J Membr Sci 1997;127(1):101–9.
[59] Wei J, Qiu C, Wang YN, Wang R, Tang CY. Comparison of NF-like and RO-like thin
film composite osmotically-driven membranes-Implications for membrane selection
and process optimization. J Membr Sci 2013;427:460–71.
[60] Gu Y, Wang YN, Wei J, Tang CY. Organic fouling of thin-film composite polyamide
and cellulose triacetate forward osmosis membranes by oppositely charged macromol-
ecules. Water Res 2013;47(5):1867–74.
[61] Tang CY, Kwon YN, Leckie JO. Probing the nano- and micro-scales of reverse osmosis
membranes—a comprehensive characterization of physiochemical properties of
uncoated and coated membranes by XPS, TEM, ATR-FTIR, and streaming potential
measurements. J Membr Sci 2007;287(1):146–56.
[62] Tang CY, Fu QS, Robertson AP, Criddle CS, Leckie JO. Use of reverse osmosis mem-
branes to remove perfluorooctane sulfonate (PFOS) from semiconductor wastewater.
Environ Sci Technol 2006;40(23):7343–9.
[63] Childress AE, Elimelech M. Relating nanofiltration membrane performance to
membrane charge (electrokinetic) characteristics. Environ Sci Technol 2000;34
(17):3710–16.
[64] Jones KL, O’Melia CR. Protein and humic acid adsorption onto hydrophilic membrane
surfaces: effects of pH and ionic strength. J Membr Sci 2000;165(1):31–46.
[65] Wang YN, Tang CY. Protein fouling of nanofiltration, reverse osmosis, and ultrafiltra-
tion membranes—the role of hydrodynamic conditions, solution chemistry, and mem-
brane properties. J Membr Sci 2011;376(1–2):275–82.
[66] Kwon YN, Tang CY, Leckie JO. Change of membrane performance due to chlorination
of crosslinked polyamide membranes. J Appl Polym Sci 2006;102(6):5895–902.
[67] Do VT, Tang CY, Reinhard M, Leckie JO. Effects of chlorine exposure conditions on
physiochemical properties and performance of a polyamide membrane-mechanisms
and implications. Environ Sci Technol 2012;46(24):13184–92.
[68] Wang YN, Wei J, She Q, Pacheco F, Tang CY. Microscopic characterization of FO/PRO
membranes—a comparative study of CLSM, TEM and SEM. Environ Sci Technol
2012;46(18):9995–10003.
[69] Tang CY, Kwon YN, Leckie JO. Characterization of humic acid fouled reverse osmosis
and nanofiltration membranes by transmission electron microscopy and streaming
potential measurements. Environ Sci Technol 2007;41(3):942–9.
[70] Yun MA, Yeon KM, Park JS, Lee CH, Chun J, Lim DJ. Characterization of biofilm struc-
ture and its effect on membrane permeability in MBR for dye wastewater treatment.
Water Res 2006;40(1):45–52.
[71] Conchello J-A, Lichtman JW. Optical sectioning microscopy. Nat Meth 2005;2(12):
920–31.
42 1. REVERSE OSMOSIS MEMBRANE SEPARATION TECHNOLOGY
43.
[72] Chen Y,Liu C, Setiawan L, Wang Y-N, Hu X, Wang R. Enhancing pressure retarded
osmosis performance with low-pressure nanofiltration pretreatment: membrane foul-
ing analysis and mitigation. J Membr Sci 2017;543:114–22.
[73] Coster HGL, Chilcott TC, Coster ACF. Impedance spectroscopy of interfaces, mem-
branes and ultrastructures. Bioelectrochem Bioenerg 1996;40(2):79–98.
[74] Loh CH, Wang R. Effects of additives and coagulant temperature on fabrication of high
performance PVDF/Pluronic F127 blend hollow fiber membranes via nonsolvent
induced phase separation. Chin J Chem Eng 2012;20(1):71–9.
[75] Lee S, Elimelech M. Relating organic fouling of reverse osmosis membranes to intermo-
lecular adhesion forces. Environ Sci Technol 2006;40(3):980–7.
[76] Tang CY, Kwon YN, Leckie JO. The role of foulant-foulant electrostatic interaction on
limiting flux for RO and NF membranes during humic acid fouling—theoretical basis,
experimental evidence, and AFM interaction force measurement. J Membr Sci 2009;
326(2):526–32.
[77] Nikolay V. Desalination engineering: planning and design. McGraw-Hill Professional;
2012. 1 p.
[78] Fane AG, Wang R, Hu MX. Synthetic membranes for water purification: status and
future. Angew Chem Int Ed 2015;54(11):3368–86.
[79] Wang Y-N, Li W, Wang R, Tang CY. Enhancing boron rejection in FO using alkaline
draw solutions. Water Res 2017;118:20–5.
[80] G€
uler E, Kaya C, Kabay N, Arda M. Boron removal from seawater: state-of-the-art
review. Desalination 2015;356:85–93.
[81] Wang Y-N, Wang R, Li W, Tang CY. Whey recovery using forward osmosis—
evaluating the factors limiting the flux performance. J Membr Sci 2017;533:179–89.
[82] Hoek EMV, Elimelech M. Cake-enhanced concentration polarization: a new fouling
mechanism for salt-rejecting membranes. Environ Sci Technol 2003;37(24):5581–8.
[83] Vrijenhoek EM, Elimelech M, Hong S, editors. Influence of membrane properties,
solution chemistry, and hydrodynamics on colloidal fouling of reverse osmosis
and nanofiltration membranes. ACS Division of Environmental Chemistry; 2000.
Preprints.
[84] Tang CY, Fu QS, Criddle CS, Leckie JO. Effect of flux (transmembrane pressure) and
membrane properties on fouling and rejection of reverse osmosis and nanofiltration
membranes treating perfluorooctane sulfonate containing wastewater. Environ Sci
Technol 2007;41(6):2008–14.
[85] Wang YN, J€
arvel€
a E, Wei J, Zhang M, Kyll€
onen H, Wang R, et al. Gypsum scaling and
membrane integrity of osmotically driven membranes: the effect of membrane mate-
rials and operating conditions. Desalination 2016;377:1–10.
[86] Wang YN, Tang CY. Fouling of nanofiltration, reverse osmosis and ultrafiltration mem-
branes by protein mixtures: the role of inter-foulant-species interaction. Environ Sci
Technol 2011;45(15):6373–9. [Epub 2011 Jul 5].
[87] Antony A, Low JH, Gray S, Childress AE, Le-Clech P, Leslie G. Scale formation and
control in high pressure membrane water treatment systems: a review. J Membr Sci
2011;383(1–2):1–16.
[88] Stumm W, Morgan J. Aquatic chemistry: chemical equilibria and rates in natural
waters. 3rd ed. New York: Wiley-Interscience; 1996. 1040 p.
[89] Wang YN, Li X, Wang R. Silica scaling and scaling control in pressure retarded osmosis
processes. J Membr Sci 2017;541:73–84.
[90] Ang WS, Elimelech M. Protein (BSA) fouling of reverse osmosis membranes: implica-
tions for wastewater reclamation. J Membr Sci 2007;296(1–2):83–92.
[91] Tang CY, Kwon YN, Leckie JO. Fouling of reverse osmosis and nanofiltration mem-
branes by humic acid—effects of solution composition and hydrodynamic conditions.
J Membr Sci 2007;290(1–2):86–94.
43
REFERENCES
44.
[92] Zhu X,Elimelech M. Colloidal fouling of reverse osmosis membranes: measurements
and fouling mechanisms. Environ Sci Technol 1997;31(12):3654–62.
[93] Gao Y, Haavisto S, Li W, Tang CY, Salmela J, Fane AG. Novel approach to character-
izing the growth of a fouling layer during membrane filtration via optical coherence
tomography. Environ Sci Technol 2014;48(24):14273–81.
[94] Jiang S, Li Y, Ladewig BP. A review of reverse osmosis membrane fouling and control
strategies. Sci Total Environ 2017;595:567–83.
[95] Sohn J, Valavala R, Han J, Her N, Yoon Y. Pretreatment in reverse osmosis seawater
desalination: a short review. Environ Eng Res 2011;16(4):205–12.
[96] Wenten IG, Khoiruddin. Reverse osmosis applications: prospect and challenges.
Desalination 2016;391:112–25.
[97] Greenlee LF, Lawler DF, Freeman BD, Marrot B, Moulin P. Reverse osmosis desalina-
tion: water sources, technology, and today’s challenges. Water Res 2009;43(9):2317–48.
[98] Shenvi SS, Isloor AM, Ismail AF. A review on RO membrane technology: developments
and challenges. Desalination 2015;368:10–26.
[99] C^
ot
e P, Liu M, Siverns S. Water reclamation and desalination by membranes.
In: Advanced membrane technology and applications. Wiley; 2008. p. 171–87.
[100] Wang B, Guo X, Bai P. Removal technology of boron dissolved in aqueous solutions—a
review. Colloids Surf A Physicochem Eng Asp 2014;444:338–44.
[101] Jamaly S, Darwish NN, Ahmed I, Hasan SW. A short review on reverse osmosis pre-
treatment technologies. Desalination 2014;354:30–8.
[102] P
erez-González A, Urtiaga AM, Ibáñez R, Ortiz I. State of the art and review on the
treatment technologies of water reverse osmosis concentrates. Water Res 2012;
46(2):267–83.
[103] Peters TA. Purification of landfill leachate with reverse osmosis and nanofiltration.
Desalination 1998;119(1):289–93.
[104] Chai X, Chen G, Yue PL, Mi Y. Pilot scale membrane separation of electroplating waste
water by reverse osmosis. J Membr Sci 1997;123(2):235–42.
[105] Vourch M, Balannec B, Chaufer B, Dorange G. Treatment of dairy industry wastewater
by reverse osmosis for water reuse. Desalination 2008;219(1):190–202.
[106] Coskun T, Debik E, Demir NM. Treatment of olive mill wastewaters by nanofiltration
and reverse osmosis membranes. Desalination 2010;259(1):65–70.
[107] De Jager D, Sheldon MS, Edwards W. Colour removal from textile wastewater using a
pilot-scale dual-stage MBR and subsequent RO system. Sep Purif Technol
2014;135:135–44.
[108] Rautenbach R, Vossenkaul K, Linn T, Katz T. Waste water treatment by membrane
processes—new development in ultrafiltration, nanofiltration and reverse osmosis.
Desalination 1997;108(1):247–53.
[109] Alvarez V, Alvarez S, Riera FA, Alvarez R. Permeate flux prediction in apple juice con-
centration by reverse osmosis. J Membr Sci 1997;127(1):25–34.
[110] Pap N, Kert
esz S, Pongrácz E, Myllykoski L, Keiski RL, Vatai G, et al. Concentration of
blackcurrant juice by reverse osmosis. Desalination 2009;241(1):256–64.
[111] Jesus DF, Leite MF, Silva LFM, Modesta RD, Matta VM, Cabral LMC. Orange (Citrus
sinensis) juice concentration by reverse osmosis. J Food Eng 2007;81(2):287–91.
[112] Gurak PD, Cabral LMC, Rocha-Leão MHM, Matta VM, Freitas SP. Quality evaluation
of grape juice concentrated by reverse osmosis. J Food Eng 2010;96(3):421–6.
[113] Echavarrı́a AP, Falguera V, Torras C, Berdún C, Pagán J, Ibarz A. Ultrafiltration and
reverse osmosis for clarification and concentration of fruit juices at pilot plant scale.
LWT-Food Sci Technol 2012;46(1):189–95.
[114] Pilipovik MV, Riverol C. Assessing dealcoholization systems based on reverse osmosis.
J Food Eng 2005;69(4):437–41.
44 1. REVERSE OSMOSIS MEMBRANE SEPARATION TECHNOLOGY
45.
[115] Catarino M,Mendes A, Madeira LM, Ferreira A. Alcohol removal from beer by reverse
osmosis. Sep Sci Technol 2007;42(13):3011–27.
[116] Catarino M, Mendes A. Dealcoholizing wine by membrane separation processes. Inno-
vative Food Sci Emerg Technol 2011;12(3):330–7.
[117] Peinemann KV, Nunes SP, Giorno L. Membrane technology, volume 3: membranes for
food applications. Wiley; 2010.
[118] López M, Alvarez S, Riera FA, Alvarez R. Production of low alcohol content apple cider
by reverse osmosis. Ind Eng Chem Res 2002;41(25):6600–6.
[119] White LS, Nitsch AR. Solvent recovery from lube oil filtrates with a polyimide mem-
brane. J Membr Sci 2000;179(1):267–74.
[120] Vandezande P, Gevers LEM, Vankelecom IFJ. Solvent resistant nanofiltration: separat-
ing on a molecular level. Chem Soc Rev 2008;37(2):365–405.
Further Reading
[121] Weng X, Ji Y, Zhao F, An Q, Gao C. Tailoring the structure of polyamide thin film com-
posite membrane with zwitterions to achieve high water permeability and antifouling
property. RSC Adv 2015;5(120):98730–9.
[122] kobelco-eco.co. Available from: http://www.kobelco-eco.co.jp/english/product/dt_
module/genri.html.
45
REFERENCES
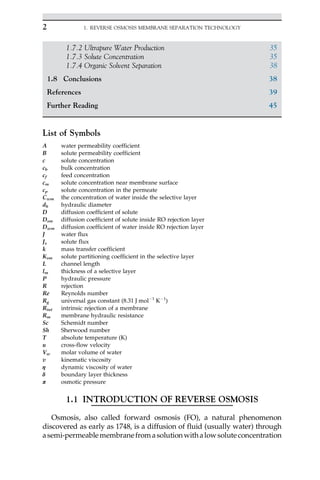
![to a solution with a higher solute concentration until an equilibrium of fluid
concentrationonbothsidesofthemembraneisreached[1].Thedrivingforce
for water transportis the chemical potential difference (i.e.,osmotic pressure
difference) across the membrane. Reverse osmosis (RO) is achieved by
applying a pressure in excess of the osmotic pressure gradient to drive the
water to flow from the high solute concentration side to the low solute con-
centration side, i.e., in an oppose direction to the automatic water flow in the
FO process. Fig. 1.1 illustrates four osmotic membrane processes including
pressure assisted osmosis (PAO), FO, pressure retarded osmosis (PRO) and
RO.Thefourprocessesaresimilarinawaythatasemi-permeablemembrane
isplacedinbetweenasolutionoflowosmoticpressureandasolutionofhigh
osmotic pressure. The first three (PAO, FO, and PRO) are the processes (par-
tially)drivenbyosmoticpressuredifference,wherewaterflowsfromthelow
osmotic pressure side to the high osmotic pressure side. They are not able to
achieve desalination by themselves. Only when the water flow direction is
reversedintheROprocess,cancleananddesaltedwaterbedirectlyobtained
by this pressure driven membrane process.
1.1.1 Historic Development of RO
The use of RO as a feasible separation process was first demonstrated in
the early 1960s. The milestones of RO membrane development are shown
in Fig. 1.2. The first practical RO membrane made of cellulose acetate (CA)
was reported by Loeb and Sourirajan in 1962 [2]. This membrane exhibited
high flux and salt rejection owing to the asymmetric structure (a thin skin
ΔP =0 p ΔP0 ΔP p
Forward osmosis
(FO)
Pressure
retarded osmosis
(PRO)
Reverse osmosis
(RO)
ΔP0
Pressure
assisted osmosis
(PAO)
Solution of low osmotic pressure
Solution of high osmotic pressure
Semi-permeable membrane
FIG. 1.1 Osmotic membrane processes including pressure assisted osmosis (PAO), for-
ward osmosis (FO), pressure retarded osmosis (PRO) and reverse osmosis (RO).
3
1.1 INTRODUCTION OF REVERSE OSMOSIS](https://image.slidesharecdn.com/wang2019-250518085119-1d7dee3c/85/wang201fdfdddddddddddddddddddddddddddddddddddddd9-pdf-3-320.jpg)
![layer on a porous substrate). Cadotte and Petersen later made the first effi-
cient thin-film composite (TFC) membrane based on the reaction of phe-
nylene diamine and trimesoyl chloride, which was a key breakthrough to
make the large-scale application of RO membranes economically feasible
[3]. Today, the state-of-art desalination RO membranes are still TFC poly-
amide (PA) RO membranes [4]. Although they are produced based on the
original chemistry discovered during the 1980s, the performance of RO
membranes have been improved significantly over the 30 years [5], by
closer monitoring of the recipes for the substrates and selective layer
and/or applying coating, etc. [6]. More than sevenfold decrease in salt
passage has expanded the range of saline feeds, while the increased life-
span (2.3 times) and increased water permeability (2.5 times) have greatly
reduced the real cost (one twelfth) [5, 7]. Currently, TFC RO membranes
are produced in flat sheet configuration and mostly supplied in spiral
wound module (SWM). With the aim of further reducing energy cost in
desalination (theoretical minimal energy required to desalinate 35 g/L
seawater at 50% recovery is 1.06 kWh/m3
, while the real energy con-
sumption is 2–5 kWh/m3
[8, 9]), extensive researches are focused on
developing more superior performing, fouling resistant and chlorine
resistant RO membranes, in addition to the optimizations of the process
and membrane module design.
Since 2007, the emerging thin-film nanocomposite (TFN) membranes/
mixed matrix membranes (MMMs), i.e., TFC membranes with incorpo-
rated nanoparticles/inorganic particles in the selective layer and/or the
support layer, have attracted great interests in fabricating high perfor-
mance RO membranes [10, 11], due to their enhanced performance as
compared with pristine TFC membranes [12].
FIG. 1.2 Milestones of RO membrane development. Adapted from Baker RW. Reverse osmo-
sis. Membrane technology and applications. John Wiley Sons, Ltd; 2004. p. 191–235.
4 1. REVERSE OSMOSIS MEMBRANE SEPARATION TECHNOLOGY](https://image.slidesharecdn.com/wang2019-250518085119-1d7dee3c/85/wang201fdfdddddddddddddddddddddddddddddddddddddd9-pdf-4-320.jpg)
![1.1.2 Basic Properties of RO Membrane
The basic properties of RO membrane are summarized in Table 1.1
along with other types of pressure driven membranes such as nanofiltra-
tion (NF), ultrafiltration (UF), and microfiltration (MF), which are catego-
rized based on the pore size or operating pressure range. MF and UF
membranes are the low-pressure membranes with relatively larger pores.
They are usually adopted in the pretreatment of RO/NF processes to pro-
tect the RO/NF membranes. They are also used as the support for fabri-
cating TFC RO and NF membranes. RO membranes have the tightest
surface “pores” (2 nm (diameter), generally considered as non-porous
membrane) and are able to retain dissolved ions (including monovalent
ions Na+
and Cl
) and small organic molecules. RO membranes can be
further divided into seawater RO (SWRO) and brackish water RO
(BWRO) membranes. SWRO membranes have high NaCl rejection
(99%) and are used for seawater desalination. The trade-off for this high
TABLE 1.1 Typical Properties of Pressure-Driven Membranes
Microfiltration Ultrafiltration Nanofiltration
Reverse
osmosis
Surface pore
size (nm)
50–10,000 1–100 2 2
Operating
pressure
(bar)
0.1–2.0 1.0–5.0 2.0–10 10–100
Water
permeability
(L/m2
h/bar)
500 20–500 5–50 0.5–10
MWCO (Da) Not applicable 1000–300,000 100 10
Targeted
contaminants
Bacteria, algae,
suspended
solids,
turbidity
Bacteria, virus,
colloids,
macromolecules
Di- and multi-
valent ions,
natural organic
matter, small
organic
molecules
Dissolved
ions, small
molecules
Membrane
materials
Polymeric,
inorganic
Polymeric,
inorganic
Thin-film
composite
polyamide,
cellulose
acetate, etc. [13]
Thin-film
composite
polyamide,
cellulose
acetate
Note: MWCO, molecular weight cut-off.
Adapted from Fane AG, Wang R, Tang C. Membrane technology for water: microfiltration, ultrafiltration,
nanofiltration, and reverse osmosis. Treatise on water science, vol. 4. Amsterdam; Hackensack, NJ: Elsevier Science;
2011. p. 301; Mulder M. Basic principles of membrane technology. The Netherlands: Kluwer Academic Publishers;
1996.
5
1.1 INTRODUCTION OF REVERSE OSMOSIS](https://image.slidesharecdn.com/wang2019-250518085119-1d7dee3c/85/wang201fdfdddddddddddddddddddddddddddddddddddddd9-pdf-5-320.jpg)
![rejection is the low water permeability (1 L/m2
h/bar). High pressure of
above 60 bar is generally required in real operation to overcome the sea-
water osmotic pressure to produce reasonably high-water flux. BWRO
membranes have relatively low NaCl rejection (95%) and higher water
permeability (1–10 L/m2
h/bar), and are used for water/wastewater
treatment where feed salt content is much lower compared to that of sea-
water. NF membranes are similar to RO membranes, but the bigger “pore”
size of NF membranes as compared with RO membranes leads to the
higher water permeability and much lower rejection to the monovalent
ions (e.g., 10%–90% rejection to Na+
depending strongly on the surface
charges of the membrane). NF membranes can effectively remove di-
and multi-valent ions, which makes them useful for water softening.
During a pressure driven membrane process, a feed stream is divided
into two streams, i.e., retentate stream (or concentrate stream) that is
retained by the membrane and permeate stream that passes through the
membrane. It is widely accepted that the transport of molecules through
the selective skin layer of a RO membrane is best described by the
solution-diffusion model [14, 15]. It assumes that both the solvent and
the solute are absorbed to the skin layer, and then diffuse through the
non-porous layer independent of each other under their respective chem-
ical potential gradient. A separation is achieved between the solvent and
the solute (or among different permeants) because of the differences in the
amount of the molecules that dissolve in the membrane (solubility) and
the rate at which the molecules diffuse through the membrane (diffusiv-
ity) [14]. RO membranes generally allow high absorption of water mole-
cules and fast diffusion of them through the selective layer, as compared
with sodium chloride [15].
1.2 RO MEMBRANE FABRICATION
RO membranes are generally categorized into integrally skinned asym-
metric membranes and TFC membranes based on the structure and mate-
rials. The common materials used for RO membrane fabrication are
summarized in Table 1.2. An integrally skinned asymmetric membrane
is made of one polymeric material, and CA membranes (made of cellulose
esters) are the most widely used examples [15]. The TFC RO membrane is
the state-of-the-art RO membrane, which comprises two or more polymer
materials. The porous membrane support is typically made of polysulfone
(PSf) or polyethersulfone (PES). The ultrathin selective layer is generally
made of polyamide (PA), which has relatively high water flux and high
solute rejection, as well as good chemical, mechanical, and thermal stabil-
ity (Table 1.2) [9].
6 1. REVERSE OSMOSIS MEMBRANE SEPARATION TECHNOLOGY](https://image.slidesharecdn.com/wang2019-250518085119-1d7dee3c/85/wang201fdfdddddddddddddddddddddddddddddddddddddd9-pdf-6-320.jpg)
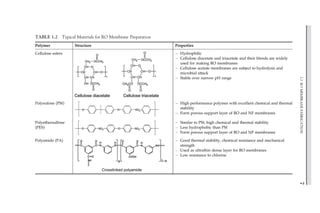
![1.2.1 Cellulose Acetate Membrane
Cellulose esters, including cellulose diacetate and cellulose triacetate,
are used to prepare the integrally skinned asymmetric RO membranes
via phase inversion. Phase inversion refers to a process whereby a poly-
mer solution (liquid form; in which the solvent system is the continuous
phase) inverts into a swollen three-dimensional macromolecular network
or gel (solid form; where the polymer is the continuous phase) [9]. In other
words, a liquid polymer solution is precipitated into two phases: a
polymer-rich phase that forms the matrix of the membrane, and a
polymer-lean phase that forms the membrane pores in an unstable nascent
membrane structure. For RO membrane/RO substrate preparation, the
precipitation is generally achieved by the immersion of a polymer solution
into a non-solvent coagulant bath, such as water (solvent containing water
coagulant bath is usually adopted for hollow fiber membrane preparation
[16]). Both flat-sheet membranes and hollow fiber membranes can be
fabricated using this method.
Despite the ease of preparation (i.e., one step casting), it is generally dif-
ficult for the integrally skinned asymmetric RO membranes to achieve
both high water permeability and high solute rejection. Formation of a
dense skin layer requires a relatively high polymer concentration, which
results in a less porous/less permeable support and therefore an increased
overall hydraulic resistance of the membrane. It has been reported that the
polymer concentration for making integrally skinned asymmetric CA
membrane is higher than that of TFC membrane with CA support [17,
18]. A common practice for increasing the solute rejection of CA mem-
brane is to adopt an annealing post-treatment, such as heating in a bath
of hot water for a few minutes [19]. This process modifies the selective
layer by eliminating the micropores and producing a denser skin, result-
ing in a decrease in water flux and an increase in salt rejection [19]. The
annealing temperature determines the final properties of the membrane
and a higher temperature generally leads to a denser skin layer. To com-
pensate the low permeability, the commercial CA RO membrane is pref-
erentially made into hollow fiber modules (e.g., Toyobo hollow fiber
membrane with a very small outer diameter of 165 μm [20]), which
can provide sufficiently high water productivity owing to the high pack-
ing density (high specific membrane area) [21]. Considerable research
efforts have been made to optimize CA membranes via changing the
compositions of polymer solution (e.g., type and concentration of poly-
mer/additives) and casting/spinning conditions (e.g., composition and
temperature of coagulant bath), and modifying the surface properties,
etc. [22–24]. However, their drawbacks of poor stability against chemicals,
bacteria, and temperature and lower water permeability make it less
competitive than the TFC polyamide membranes (see Tables 1.2 and 1.3).
8 1. REVERSE OSMOSIS MEMBRANE SEPARATION TECHNOLOGY](https://image.slidesharecdn.com/wang2019-250518085119-1d7dee3c/85/wang201fdfdddddddddddddddddddddddddddddddddddddd9-pdf-8-320.jpg)
![1.2.2 TFC Polyamide Membrane
A TFC polyamide (PA) RO membrane generally comprises three layers,
including an aromatic PA selective layer (typically 200 nm thick), a
microporous support (usually a UF membrane, 20–50 μm), and a non-
woven fabric (backing layer, 100–200 μm) [9]. A schematic of a typical
TFC RO membrane is shown in Fig. 1.3. The selective layer and the sup-
port are produced separately, enabling the optimization of each individ-
ual layer for the respective specific function, i.e., the top selective layer is
thin but dense enough to attain high solvent flux and high solute rejection;
TABLE 1.3 Comparison of CA RO Membrane and TFC RO Membrane
Cellulose acetate (CA)
RO membrane
Thin-film composite (TFC)
polyamide (PA) RO membrane
Water permeability
(L/m2
h/bar)
Low (1 L/m2
h/bar
or less)
High
NaCl rejection (%) 85–98 95–99.9
Surface hydrophilicity Very hydrophilic Less hydrophilic
Surface roughness Smooth Rough surface with ridge-and-
valley structure
Operating pH range 5–7 3–10 (2–11 for certain membranes)
Maximum operating
temperature (°C)
30 45
Resistance to
biodegradation
Low Relatively good
Resistance to chlorine Stable at low levels
(1 ppm)
Low tolerance to free chlorine
(0.1 ppm)
Adapted from Fane AG, Wang R, Tang C. Membrane technology for water: microfiltration, ultrafiltration,
nanofiltration, and reverse osmosis. Treatise on water science, vol. 4. Amsterdam; Hackensack, NJ: Elsevier Science;
2011. p. 301.
Polyamide 0.05–0.3µm
Polysulfone ~20–50µm
Backing layer ~100–200 µm
FIG. 1.3 Schematic of a thin-film composite PA membrane.
9
1.2 RO MEMBRANE FABRICATION](https://image.slidesharecdn.com/wang2019-250518085119-1d7dee3c/85/wang201fdfdddddddddddddddddddddddddddddddddddddd9-pdf-9-320.jpg)
![and the support is porous enough to provide low resistance to permeate
while maintaining high mechanical strength [25]. This approach provides
great flexibility for utilizing different materials to tailor the membrane
structure and properties.
The PA layer of a TFC RO membrane is formed on a porous membrane
support via interfacial polymerization between amines (e.g.,
m-phenylenediamine, MPD) and aromatic acyl chlorides (e.g., trimesoyl
chloride, TMC). In the process of preparation (Fig. 1.4), a membrane sup-
port (UF or MF membrane) is immersed in an aqueous solution containing
MPD. After removing the excess MPD, the membrane surface is immersed
in/contacted with a water-immiscible solvent containing dissolved TMC.
Due to the rapid hydrolysis of acyl chloride in the aqueous phase and the
asymmetric solubility, the reaction is diffusion-controlled and comprises
three stages [26]: At the incipient stage, a loose polymer film begins to
emerge in the interface between two immiscible solvents; then amines
in the aqueous phase diffuse to the organic phase and the film becomes
dense and grows perpendicularly towards the organic phase; finally the
increase in thickness and density of the film inhibits the diffusion of
the monomers and the reaction. The advantage of interfacial reaction is
the fast reaction kinetics and self-inhibiting, resulting in an extremely thin
film. Heat treatment is often applied to complete the interfacial reaction
and further cross-linking [19]. The type and concentration of mono-
mers/solvents/additives, polymerization condition, and curing process
FIG. 1.4 (A) Schematic of the formation of a thin-film composite membrane via interfacial
polymerization; (B) reaction between MPD and TMC. Adapted from Weng X, Ji Y, Zhao F, An Q,
Gao C. Tailoring the structure of polyamide thin film composite membrane with zwitterions to achieve
high water permeability and antifouling property. RSC Adv 2015;5(120):98730-9
10 1. REVERSE OSMOSIS MEMBRANE SEPARATION TECHNOLOGY](https://image.slidesharecdn.com/wang2019-250518085119-1d7dee3c/85/wang201fdfdddddddddddddddddddddddddddddddddddddd9-pdf-10-320.jpg)
![can affect the performance of the PA layer and these conditions need to be
optimized for fabricating high-performance TFC membranes [27, 28].
In addition to the control of the reaction parameters of interfacial poly-
merization, the surface properties of the support such as pore structure,
surface morphology and chemistry are also important for the PA layer for-
mation [27, 29]. For example, a relatively porous and hydrophobic support
could result in the formation of a more permeable and rougher skin layer;
whereas a smoother PA layer with lower permeability is formed on a sup-
port of hydrophilic surface [30]. The increasing surface pore size was also
found to increase the RO membrane water permeability [31]. Although it
has been found that the support surface properties play an important role
in forming PA layer, the mechanisms are yet to be systematically investi-
gated. Besides the surface properties, an ideal support of a RO membrane
shall possess good mechanical, chemical, thermal, and biological stabili-
ties and relatively low hydraulic resistance.
In the aspect of RO support preparation, phase inversion is the most
extensively used method, with which an asymmetric UF membrane is
generally formed from polymers PSf or PES (Table 1.2). Similar to the
CA RO membrane fabrication and other UF membrane preparation,
factors such as the composition of polymer solution (e.g., the type and
concentration of polymer/additive), and coagulant bath, etc. have been
shown to influence the properties of resultant supports [15, 27]. For the
commercially available TFC membranes, the TFC RO supports are pro-
duced in flat sheets; hollow fiber TFC RO membranes are only prepared
in lab scale currently due to the challenges of large-scale production.
Nevertheless, the high performance hollow fiber TFC RO membranes
have been recently developed in a few research labs with promising
applications in brackish water desalination and surface water
treatment [32].
On the other hand, the recently emerged nanofibrous membranes pro-
duced by electrospinning have attracted many interests in preparing
membranes or membrane supports [29, 33]. Electrospinning involves a
process during which polymer is stretched into nanofibers from its
solution under an applied electrostatic force. This technique is so versatile
that the produced nanofibrous membranes can be tailored with desired
pore size, porosity, and thickness by varying the polymer solution and
electrospinning conditions [29, 34]. A typical nanofibrous membrane
has interconnected pores and relatively high porosity, which is favorable
for making RO/NF membranes with high water permeability [33]. Nev-
ertheless, the surface pore size of the nanofibrous membrane support
needs to be carefully controlled within a certain range for the successful
formation of PA selective layer. The nanofibrous support with high poros-
ity may also require other treatment to enhance its stability against high
pressure, such as heat pressing [33].
11
1.2 RO MEMBRANE FABRICATION](https://image.slidesharecdn.com/wang2019-250518085119-1d7dee3c/85/wang201fdfdddddddddddddddddddddddddddddddddddddd9-pdf-11-320.jpg)
![1.2.3 Membrane With a Polyelectrolyte Multilayer Film
RO/NF membranes can be prepared by the layer-by-layer assembly of
polyelectrolytes onto a charged support (UF or NF supports), where a
polycation (e.g., polyallylamine hydrochloride, PAH) and a polyanion
(e.g., poly(sodium 4-styrene-sulfonate), PSS) are deposited alternately
[35–37]. Fig. 1.5 presents a schematic of layer-by-layer assembly cycle.
The rejection property of the membrane usually depends on several fac-
tors, such as the type and concentration of polyelectrolytes, ionic condition
of the polyelectrolyte solution, contact time, and the number of bilayers
(one positively charged layer and one negatively charged layer) [37, 38].
These conditions may influence both the tightness of the “pores” in the
membrane skin layer as well as the surface charge, thereby affecting the
passage of solutes, especially charged solutes. This method is more widely
used for NF membrane preparation, as the monovalent rejection of the
polyelectrolyte film is not very high while the divalent ions are much bet-
ter retained. To enhance the solute rejection and the film stability, cross-
linking via heat treatment and/or the use of cross-linking agents are
generally adopted [37–40].
1.2.4 Recent Advances in Membranes
1.2.4.1 Mixed Matrix Membranes
Mixed matrix membranes (MMMs) for RO applications are fabricated
by incorporating inorganic nanoparticles into membrane matrix via
blending the materials into the polymer solution for the support or the
monomer solution for the PA layer [27, 41]. The membrane with nanopar-
ticles embedded PA layer is also named thin-film nanocomposite (TFN)
membrane. The pioneering study by Hoek’s group [12] reported the fab-
rication of a TFN RO membrane via immobilizing zeolite NaA nanopar-
ticles in the PA layer at loadings of 0.004%–0.4% (w/v). The results
Polycation Polyanion
Membrane
support
FIG. 1.5 Schematic of layer-by-layer assembly for preparing polyelectrolyte multilayer
film.
12 1. REVERSE OSMOSIS MEMBRANE SEPARATION TECHNOLOGY](https://image.slidesharecdn.com/wang2019-250518085119-1d7dee3c/85/wang201fdfdddddddddddddddddddddddddddddddddddddd9-pdf-12-320.jpg)
![demonstrated dramatic increase in water permeability upon zeolite incor-
poration, while solute rejection remained comparable to the pure TFC
membrane (Fig. 1.6). The improved intrinsic properties of the TFN mem-
branes could be attributed to the unique pore structure of zeolite molec-
ular sieve particles, which provide a preferential flow path for water
molecules through its internal pore structure. In addition, the hydrophi-
licity and negative charges of zeolite nanoparticles could result in greater
affinity for water molecules and thus increase the repulsion of anions [10].
Similar to zeolites that provide size and shape selectivities, silica (SiO2) are
also available in various forms and sizes, such as nonporous silica and
mesoporous silica. The latter has pore size range of 2–50 nm, which
could make even shorter water flow path in TFN membranes [42]. How-
ever, increasing mesopore size of silica may cause sacrificed salt retention
[43]. Besides the selection of nanoparticles, the loading of nanoparticles
shall also be carefully controlled to minimally affect the crosslinking
degree of PA layer [27]. Other promising nanoparticles for MMM prepa-
ration include titanium nanotube, silver (Ag), carbon nanotube (CNT),
and grapheme oxide (GO), etc. In addition to the enhanced separation
FIG. 1.6 Zeolite nanoparticle-embedded TFN membranes. (A) Schematic of TFN mem-
branes; (B) SEM image of zeolite nanoparticles; (C) TEM image of PA layer with embedded
zeolite nanopartilces; and (D) water permeability and solute rejection performance upon zeo-
lite loading. Reproduced from Jeong BH, Hoek EMV, Yan Y, Subramani A, Huang X, Hurwitz G,
et al. Interfacial polymerization of thin film nanocomposites: a new concept for reverse osmosis mem-
branes. J Membr Sci 2007;294(1-2):1-7.
13
1.2 RO MEMBRANE FABRICATION](https://image.slidesharecdn.com/wang2019-250518085119-1d7dee3c/85/wang201fdfdddddddddddddddddddddddddddddddddddddd9-pdf-13-320.jpg)
![properties, TFN membranes may exhibit improved chemical and thermal
stability, improved reaction and sorption capacity [27]. For example, the
TFN membrane with Ag incorporated in the selective layer exhibited bet-
ter anti-biofouling property [44], and CNT embedded TFN membranes
showed improved resistance to chlorine and fouling [45].
On the other hand, MMMs with fillers in the supports have also been
extensively investigated [27]. Although TFN approach seems to be more
effective to improve RO membrane separation property, the nanoparticle
incorporation in the supports may benefit in a different way. Similar to
the effect of changing polymer solution composition (see Section 1.3.2),
a small amount of fillers in the support can significantly change the sup-
port’s properties, which may subsequently affect the selective layer forma-
tion [27]. The hydrophilic inorganic particles such as silica, zeolites, TiO2,
and CNTs could increase the hydrophilicity of the support layer.
Meanwhile, the changed pore structure (especially the surface character-
istics of the support) may contribute to the enhanced water permeability
[46]. This approach is very helpful in decreasing the structural parameter
of the support layer of FO membranes to reduce the internal concentration
polarization effect, thereby increasing FO water flux [46]. Moreover, the
fillers with superior mechanical property such as CNT can significantly
increase the tensile strength of the MMM membranes [47]. However, there
are still some challenges encountered during TFN membrane/MMM fab-
rication, such as poor dispersion of nanoparticles in the casting solution,
agglomeration of nanoparticles in the PA layer, lack of interaction
between nanoparticles and membrane matrix (leach out easily), and
unknown water and ion transport mechanisms especially for nonporous
nanoparticles [10].
1.2.4.2 Biomimetic Membranes
Different from the MMMs, the fillers used in biomimetic membranes
are aquaporin (AQP) laden vesicles. AQPs are known as water channels,
which selectively conduct water molecules while preventing the passage
of ions and other solutes (Fig. 1.7A). These characteristics make
them perfect for desalination. The single channel permeability of
AQP is 2–14 1014
cm3
water molecules/s (CNT is on the orders of
1014
–1012
cm3
/s but without perfect solute rejection) [48–50]. AQP
laden vesicles have been demonstrated to possess high water productivity
as compared to that of commercial RO membranes [51]. Among different
methods of making biomimetic membranes, TFC membrane is still the
most practical and promising approach [48]. Conceptually, the way of
immobilizing biomolecules into a PA layer is similar to the TFN mem-
brane fabrication. The fabrication of biomimetic TFC RO membrane has
been firstly successfully demonstrated by Zhao et al. [52], and the resul-
tant membrane showed 25% increase in water flux without compromising
14 1. REVERSE OSMOSIS MEMBRANE SEPARATION TECHNOLOGY](https://image.slidesharecdn.com/wang2019-250518085119-1d7dee3c/85/wang201fdfdddddddddddddddddddddddddddddddddddddd9-pdf-14-320.jpg)
![the NaCl rejection. Later Li et al. showed that the water permeability
of AQP incorporated TFC hollow fiber membrane reached 8 L/m2
h/bar, which was twice as high as those of pristine TFC membrane and
commercial BWRO membranes [32]. A cross-sectional SEM image of bio-
mimetic RO membrane is shown in Fig. 1.7B, where the AQP laden ves-
icles can be observed within the PA layer. Despite the superior
separation performances, other issues shall be taken into consideration,
such as membrane stability (very few studies looked into the long term
stability [53]), scalability, and production cost. A comprehensive review
on biomimetic membranes can be found elsewhere [48]. On the other
Water
molecules
Lipid
bilayer
Aquaporin
Self-assembled
water channel
Unimolecular
water channel
(A)
Lipid
vesicles
Polyamide
layer
PES support
layer
(B)
FIG. 1.7 Water channels and biomimetic membranes. (A) Aquaporin and synthetic water
channels (self-assembled artificial water channel and unimolecular artificial water channel);
(B) biomimetic TFC RO membranes with incorporated aquaporins (spanned in lipid vesicles)
in the PA layer. Adapted from Li X, Chou S, Wang R, Shi L, Fang W, Chaitra G, et al. Nature gives
the best solution for desalination: aquaporin-based hollow fiber composite membrane with superior per-
formance. J Membr Sci 2015;494:68–77; Barboiu M. Artificial water channels—incipient innovative
developments. Chem Commun 2016;52(33):5657–65.
15
1.2 RO MEMBRANE FABRICATION](https://image.slidesharecdn.com/wang2019-250518085119-1d7dee3c/85/wang201fdfdddddddddddddddddddddddddddddddddddddd9-pdf-15-320.jpg)
![hand, the high performance of natural water channel has inspired
researchers to synthesize artificial water channels with nanotubular struc-
tures (Fig. 1.7A), which have potential to overcome the challenges faced by
AQP based biomimetic membranes [54].
1.3 MEMBRANE PROPERTIES AND
CHARACTERIZATIONS
Membrane separation properties generally consist of water permeabil-
ity and solute rejection, which directly determines membrane productiv-
ity. In addition, other important characteristics include hydrophilicity,
surface roughness and charge, and membrane stability, which are not only
related to the separation properties, but also influence membrane fouling
significantly. Correspondingly, membrane characterization (Table 1.4)
provides the information about the important membrane properties. It
can guide the optimization of membrane fabrication to achieve excellent
separation efficiency and fouling resistance.
TABLE 1.4 Membrane Characterization Methods
Instrument Membrane characteristics
Performance test Membrane filtration
setup
Water permeability, solute rejection, pore
size distribution
Microscopic
methods
SEM Surface/cross-section features
TEM Cross-section of membrane/cake layer
CLSM Membrane structure/foulant composition
AFM Roughness, surface morphology
Spectroscopic
methods
FTIR Membrane/foulant functional groups
XPS Elements/chemical bonding
EDX Elemental mapping of membrane/foulants
EIS Structural information of sublayers
Other methods Goniometer/
tensiometer
Hydrophilicity/hydrophobicity
Streaming potential
analyzer
Surface charge
AFM force
measurement
Interaction force (membrane-foulant)
Adapted from Fane AG, Wang R, Tang C. Membrane technology for water: microfiltration, ultrafiltration,
nanofiltration, and reverse osmosis. Treatise on water science, vol. 4. Amsterdam; Hackensack, NJ: Elsevier Science;
2011. p. 301.
16 1. REVERSE OSMOSIS MEMBRANE SEPARATION TECHNOLOGY](https://image.slidesharecdn.com/wang2019-250518085119-1d7dee3c/85/wang201fdfdddddddddddddddddddddddddddddddddddddd9-pdf-16-320.jpg)
![1.3.1 Membrane Properties
1.3.1.1 Water Permeability and Solute Permeability
The solution-diffusion model assumes that the solute and solvent are
absorbed into and diffuse through the membrane selective layer, indepen-
dent of each other, under the respective chemical potential gradient.
According to the model, the water flux J and the solute flux Js are propor-
tional to the net pressure difference and the concentration difference,
respectively, across the membrane [9]:
J ¼ A ΔPΔπ
ð Þ (1.1)
Js ¼ BΔc (1.2)
where A is defined as water permeability coefficient and B is the solute
permeability coefficient. ΔP and Δπ are hydraulic pressure difference
and osmotic pressure difference across the membrane, respectively. Δ c
is the concentration difference across the membrane. The transport coef-
ficients in this model can be related to membrane properties as shown
below:
A ¼
DwmCwmVw
RgTlm
(1.3)
B ¼
DsmKsm
lm
(1.4)
where Dwm and Dsm are water diffusion coefficient and solute diffusion
coefficient inside the selective layer, respectively. Csm is the concentration
of water inside the selective layer, Vw is the molar volume of water, Ksm is
the solute partitioning coefficient in the selective layer, lm is the thickness
of the selective layer, Rg is universal gas constant, and T is absolute
temperature.
The intrinsic rejection of a RO membrane Rint is defined as [55]:
Rint ¼ 1
cp
cm
(1.5)
where cp and cm are the solute concentration in permeate and at the feed
solution/membrane interface, respectively, and Rint can be determined
using the following equation:
Rint ¼ 1 +
B
A ΔPΔπ
ð Þ
1
(1.6)
According to the above Eqs. (1.3), (1.4), and (1.6), the intrinsic rejection
can be improved by increasing the preferential absorption of water mol-
ecules to the solutes, enhancing the diffusion coefficient of water mole-
cules inside the selective layer compared with that of solutes, and
increasing the applied pressure. This intrinsic rejection is different from
17
1.3 MEMBRANE PROPERTIES AND CHARACTERIZATIONS](https://image.slidesharecdn.com/wang2019-250518085119-1d7dee3c/85/wang201fdfdddddddddddddddddddddddddddddddddddddd9-pdf-17-320.jpg)
![apparent rejection R, which is directly measured from experiments and
can be greatly affected by the concentration polarization (CP) (as dis-
cussed in Section 1.5):
R ¼ 1
cp
cf
(1.7)
where cf is the solute concentration in the feed. In general, apparent
rejection R has smaller value than intrinsic rejection Rint due to the CP
effect.
In addition to the solution diffusion model, permeate water flux J can be
also correlated to the driving force by following Darcy’s law and is com-
monly presented in terms of membrane hydraulic resistance Rm and
dynamic viscosity of the permeating water η [9]:
J ¼
ΔPΔπ
ηRm
(1.8)
Although A and B value are the intrinsic properties of a membrane, the
measured water flux and rejection are affected by different operating con-
ditions, which generally include the applied pressure, cross-flow velocity
of the feed stream, feed concentration (or recovery), and temperature
(Fig. 1.8). At a relatively low applied pressure (low water flux level),
the water flux increases linearly with applied pressure (Eq. 1.2 or
FIG. 1.8 Effect of operating conditions on RO membrane performance. Adapted from Fane
AG, Wang R, Tang C. Membrane technology for water: microfiltration, ultrafiltration, nanofiltration,
and reverse osmosis. Treatise on water science, vol. 4. Amsterdam; Hackensack, NJ: Elsevier Science;
2011. p. 301.
18 1. REVERSE OSMOSIS MEMBRANE SEPARATION TECHNOLOGY](https://image.slidesharecdn.com/wang2019-250518085119-1d7dee3c/85/wang201fdfdddddddddddddddddddddddddddddddddddddd9-pdf-18-320.jpg)
![Eq. 1.8), the solute rejection also increases with increasing pressure
based on the solution diffusion model (Eq. 1.6). However, at a higher
applied pressure, the water flux increase deviates from the linear line,
due to the increased concentration polarization (i.e., increased concen-
tration/osmotic pressure at membrane surface, see Section 1.5). The
increased concentration at membrane surface also results in a lower
apparent rejection. Increasing the cross-flow velocity tends to increase
both water flux and solute rejection, as a result of reduced concentration
polarization. Increasing the recovery or increasing the feed concentra-
tion has an effect of reducing both water flux and solute rejection,
due to the increased osmotic pressure of the bulk solution. Hence,
the recovery for a typical SWRO desalination plant is limited to 50%,
while that for a water reclamation plant is controlled below 80% [9].
Increasing the system temperature can lead to an increase in both water
flux and solute flux, due to the enhanced diffusion coefficient (Dwm and
Dsm) in the membrane selective layer. The solute flux generally
increases more drastically than the water flux, so the solute rejection
tends to decrease at a higher temperature. It is noted that the change
in temperature affects the intrinsic properties of membrane selective
layer, while the other operating conditions discussed here are related
to the solute concentration at membrane surface.
1.3.1.2 Hydrophilicity
Hydrophilicity is a characteristic of materials exhibiting an affinity to
water. The surface of a hydrophilic membrane can readily absorb water.
In contrast, a hydrophobic membrane has little or no tendency to absorb
water. The relative hydrophilicity/hydrophobicity can be determined
using contact angle measurement (see Table 1.4). In general, a hydrophilic
membrane surface is preferred in RO applications for enhancing water
permeability and reducing membrane fouling propensity [56–58]. In this
regard, CA membrane surface is preferred compared to a typical TFC
membrane surface (a comparison of the two membranes is shown in
Table 1.3).
1.3.1.3 Surface Roughness
Membrane surface roughness is an important parameter affecting RO
membrane fouling. A rougher surface is subject to more membrane foul-
ing due to the decreased shear force over the rougher surface and the
increased membrane non-homogeneity (i.e., varied flux distribution over
the membrane surface and the local high flux would promote fouling (see
Section 1.6)) [9]. TFC RO membranes consisting of PA skin layer have
ridge and valley surface morphology that contributes to the roughness.
In contrast, CA membrane as well as semi-aromatic NF membranes
19
1.3 MEMBRANE PROPERTIES AND CHARACTERIZATIONS](https://image.slidesharecdn.com/wang2019-250518085119-1d7dee3c/85/wang201fdfdddddddddddddddddddddddddddddddddddddd9-pdf-19-320.jpg)
![possess smoother surface, which is less prone to initial foulant deposi-
tion/growth [58–60]. Nevertheless, surface modification can be applied
to decrease the roughness, such as the polyvinyl alcohol (PVA) coating
on BW30 membrane (Dow Filmtec) [61].
1.3.1.4 Surface Charge
The surface charge of a membrane is generally dependent on its
charged functional groups or the preferential adsorption of some specific
ionic species [9]. Most TFC RO membranes have negatively charged active
surfaces at neutral pH, due to the presence of –COOH functional groups
on the PA layer. The surface charge can influence solute rejection. For
example, the rejection of sodium chloride by a typical RO membrane
can be partially contributed by Donnan exclusion effect [13], i.e., Cl
is
retained by the negatively charged surface due to electrostatic repulsion,
and Na+
is also retained to maintain charge neutrality [13]. The rejection of
charged trace organic solutes is also affected by the charge of membrane
[62]. Moreover, the membrane water permeability may be affected by sur-
face charge, as evidenced by the lowest water flux at pH 5 (i.e., the isoelec-
tric point of the membrane) where membrane surface is least charged [63].
On the other hand, the membrane surface charge plays an important role
in fouling. The attractive force between oppositely charged foulants and
membrane surface has a strong tendency to induce foulant deposition
[64]. Membrane-foulant interaction can greatly affect flux performance
at initial fouling stage [65].
1.3.1.5 Stability
The mechanical, chemical and thermal stabilities of a membrane are
important for it to be successfully applied in a membrane process. The
requirement of the mechanical strength of a RO membrane depends
on its application. For example, SWRO membrane shall withstand higher
pressure than the BWRO membrane. The chemical and thermal stabilities
are closely related to the type of materials used for membrane fabrica-
tion. The RO membranes made of CA have relatively poor stability
against chemicals, bacteria, and temperature. The typical operating con-
ditions for such membranes are in range of pH 5–7 to avoid the hydro-
lysis of the polymer, at temperature below 30°C to avoid the annealing
effect (see Section 1.2.1). In contrast, the most widely used TFC RO mem-
branes with PA selective layer are generally more stable, except that it
has low chlorine resistance. To prevent unacceptable membrane damage,
the chlorine level shall be carefully controlled at a level below 0.1 ppm
(Table 1.3) [66, 67].
20 1. REVERSE OSMOSIS MEMBRANE SEPARATION TECHNOLOGY](https://image.slidesharecdn.com/wang2019-250518085119-1d7dee3c/85/wang201fdfdddddddddddddddddddddddddddddddddddddd9-pdf-20-320.jpg)
![1.3.2 Membrane Characterizations
1.3.2.1 Performance Tests
Membrane filtration setup is used to test water permeability and the
rejection of the solutes of interests. NaCl rejection is the most commonly
used separation efficiency indicator for RO membranes. Molecular weight
cut-off (MWCO), defined as the molecular weight of a solute that is
rejected by membrane at 90%, is also used to represent the “pore size”
or the selectivity of RO membrane (see Table 1.1), although this concept
is more commonly used for UF/MF membranes or the support of RO/
NF membranes.
1.3.2.2 Microscopic Methods
Microscopic characterization is used for the visualization of the mor-
phology and the structure of membrane surface and cross-section. It
can be also used for the characterization of fouled membranes to provide
the details about the morphology, structure and properties of the foulant
cake layer. Scanning electron microscopy (SEM) is the most widely used
tool to visualize the surface and cross section of clean and fouled mem-
branes, attributing to its high resolution (as good as 5 nm for polymeric
samples) and relatively easy sample preparation [68]. Transmission elec-
tron microscopy (TEM) generally provides higher resolution (atomic scale
for crystalline samples), especially in detailing the structural information
of membranes and foulants [61, 69], but the sample preparation demands
more skilled hands and complicated procedures. Compared to SEM and
TEM, confocal laser scanning microscopy (CLSM) has lower resolution
(microscale), but it is a powerful tool for characterizing membrane biofoul-
ing [70] and macroporous structure [68, 71]. Atomic force microscopy
(AFM) provides the information about membrane surface topography
and is used as a standard method to measure membrane surface
roughness [58].
1.3.2.3 Spectroscopic Methods
Most spectroscopic methods are used to provide the chemistry infor-
mation of membranes, such as Fourier transform infrared spectroscopy
(FTIR), X-ray photoelectron spectroscopy (XPS), and energy dispersive
spectroscopy (EDX). FTIR identifies various chemical bonds of membrane
materials based on its adsorption of infrared irradiation [61]. XPS and EDX
are able to identify elements. The former is a highly surface-sensitive tech-
nique that measures the elemental composition and chemical bonding for
top 1–5 nm surface region [9]. It can detect all the elements with an atomic
number of 3 and above, with detection limit of parts per thousand for most
of the elements. Moreover, the depth profile with XPS can be obtained
using ion beam to etch the layers of membrane surface [72]. EDX is a less
21
1.3 MEMBRANE PROPERTIES AND CHARACTERIZATIONS](https://image.slidesharecdn.com/wang2019-250518085119-1d7dee3c/85/wang201fdfdddddddddddddddddddddddddddddddddddddd9-pdf-21-320.jpg)
![sensitive technique, but it can be coupled with SEM or TEM to analyze
specific locations with constructed elemental mapping. Different from
these chemistry analyzing techniques, electrical impedance spectroscopy
(EIS) provides the structural information of membrane supports [73].
1.3.2.4 Other Characterization Techniques
The contact angle of a flat-sheet membrane surface is measured using a
goniometer to provide the hydrophilicity/hydrophobicity information,
while the dynamic contact angle of a hollow fiber membrane is measured
using a tensiometer according to Wilhelmy method [74]. The zeta poten-
tial is measured using streaming potential analyzer for understanding
surface charge characteristics. The measurement can be performed at a
series of pHs/ionic strength to obtain the isoelectric point or comprehen-
sive information of surface charge. AFM force measurement (different
from imaging mode for obtaining topography) can be used to characterize
the interaction between the membrane surfaces (or fouled membrane sur-
faces) and foulants. Such interaction forces correlate well with membrane
fouling behavior [75, 76]. All the characterization methods are summa-
rized in Table 1.4.
1.4 MEMBRANE MODULES AND PROCESS OPERATION
1.4.1 Membrane Modules
RO membrane modules are generally classified into four groups,
including spiral wound module (SWM), hollow fiber module, plate-
and-frame module and tubular module. Although the SWM design is
dominant in the market, other types of modules can still find their niche
applications.
1.4.1.1 Spiral Wound Module (SWM)
SWM is the most widely used design for RO/NF membranes applied in
water industry. The schematic of SWM is shown in Fig. 1.9A. Flat sheet
membranes are sealed on three sides to form leaves attached to a permeate
tube along the unsealed edge. A permeate spacer is placed inside each leaf
to support the membranes and to allow permeate to flow to the permeate
tube. A net-like feed spacer fits between the leaves to define the feed chan-
nel height (1 mm). It also plays an important role in promoting mass
transfer in boundary layer to control the concentration polarization
(Section 1.5). Several leaves and feed spacers are wound around the per-
meate tube to form a SWM with outer rigid casing. There is a trade-off
between feed spacer thickness (fouling reduction) and membrane area
(productivity). Due to the presence of spacer, the packing density of
SWM is lower than that of hollow fiber module.
22 1. REVERSE OSMOSIS MEMBRANE SEPARATION TECHNOLOGY](https://image.slidesharecdn.com/wang2019-250518085119-1d7dee3c/85/wang201fdfdddddddddddddddddddddddddddddddddddddd9-pdf-22-320.jpg)
![A typical pressure vessel consists of 6–8 SWMs in series. In a real appli-
cation, the membrane modules at back are exposed to higher feed salinity
and concentration, resulting in lower water flux. The lower flux may lead
to less accumulation of particulates, organic foulants and biofilms, despite
the increased feed concentration. However, the possibility of mineral scale
formation increases, as scaling is much more sensitive to the increased
concentration of scale precursors. Therefore, in RO systems the fouling
caused by the particulates, organic matters, and biofilm formation is usu-
ally more pronounced in the first two membrane elements of the pressure
vessels, and the last two elements suffer more from mineral scaling [77].
1.4.1.2 Hollow Fiber Module
A large number of membrane fibers are potted in a “shell and tube”
arrangement to form a hollow fiber RO membrane module (Fig. 1.9B). It
is generally a shell-side feed module, where high pressure up to
1000 psi is applied externally on the shell side of the membranes. Hence,
hollow fiber membranes are self-support and have small diameters [78].
Flat-sheet
membrane
Feed
spacer
Permeate
tube
Membrane
leaf
Permeate
spacer Feed inlet
Retentate
Permeate
Feed spacer
Permeate spacer
Membrane
Feed flow
Feed
Permeate
Hollow fibers
“Shell” Membranes
(tubes)
Feed
Container
Disc
(A)
(B)
(D)
(C)
Central axis
Concentrated
water
Permeate Raw water
RO membrane
Retentate
Permeate
flow
Retentate
Permeate
Membrane
leaf
FIG. 1.9 RO membrane modules. (A) Spiral wound module; (B) hollow fiber module;
(C) plate-and-frame module; and (D) tubular module. Adapted from Baker RW. Reverse osmosis.
Membrane technology and applications. John Wiley Sons, Ltd; 2004. p. 191–235; Fane AG, Wang
R, Tang C. Membrane technology for water: microfiltration, ultrafiltration, nanofiltration, and reverse
osmosis. Treatise on water science, vol. 4. Amsterdam; Hackensack, NJ: Elsevier Science; 2011. p. 301;
kobelco-eco.co. Available from: http://www.kobelco-eco.co.jp/english/product/dt_module/genri.html.
23
1.4 MEMBRANE MODULES AND PROCESS OPERATION](https://image.slidesharecdn.com/wang2019-250518085119-1d7dee3c/85/wang201fdfdddddddddddddddddddddddddddddddddddddd9-pdf-23-320.jpg)
![Currently, the only large company that makes hollow-fiber RO membrane
elements is Toyobo, Japan. The membranes are made of cellulose triace-
tate, which has high chlorine resistance, but relatively low water perme-
ability (compared to TFC RO membranes). A high productivity per
module can be still attained due to the major advantage of high packing
density of hollow fiber module. The feed water flow regime in a hollow
fiber module is laminar, resulting in little or no “scrubbing effect” and
thus promoting membrane fouling. Therefore, it requires more enhanced
water pretreatment to remove particulate foulants from the feed.
1.4.1.3 Plate-and-Frame Module
Plate-and-frame module uses flat sheet TFC membranes. The mem-
branes and discs are installed to a pressure tight case using the central axis
only, allowing easy assembly and disassembly (Fig. 1.9C). The flat sheets
can be easily removed from the module and hand-cleaned individually
(i.e., easier maintenance and better cleaning). However, it has lower pack-
ing density, which is about half of that of SWM. As a result, the plate-and-
frame module is not ideal for municipal water RO desalination, but for
high solids applications such as food processing [77].
1.4.1.4 Tubular Module
As shown in Fig. 1.9D, tubular module employs membranes of tube
shape (similar to hollow fiber membrane, but with larger diameter of
5–15 mm), the material of which is generally cellulosic based for RO appli-
cations. Similar to the plate-and-frame module, the tubular module has
relatively low packing density and allows for robust cleaning methods,
therefore it is generally used to process difficult feed streams such as those
with high solids content and/or greases and fats. For the control of con-
centration polarization, a high flow rate is required to achieve turbulent
flow regime.
1.4.2 Process Operation
Membrane filtration can be operated in cross-flow and dead-end
modes. The cross-flow filtration is dominant in most RO and NF processes
to provide a steady production rate with a continuous cross-flow to con-
trol the concentration polarization and fouling. The dead-end mode is
used in some low pressure membrane (i.e., UF/MF) processes for energy
saving, such as the pre-treatment of RO where feed streams have rela-
tively low levels of suspended solids or turbidity [9].
Membrane modules can be connected in parallel or in series or the com-
bination of both. In a typical SWRO plant, the modules are arranged in
both parallel and series. As shown in Fig. 1.10A, the feed to each pressure
24 1. REVERSE OSMOSIS MEMBRANE SEPARATION TECHNOLOGY](https://image.slidesharecdn.com/wang2019-250518085119-1d7dee3c/85/wang201fdfdddddddddddddddddddddddddddddddddddddd9-pdf-24-320.jpg)
![vessel in Stage 1 is similar because they are connected in parallel. The con-
centrate from Stage 1 enters as the feed to Stage 2 and possibly followed by
Stage 3 to increase the total recovery. As the volume of the feed to Stage 2
and 3 decreases, there are fewer numbers of pressure vessels in parallel,
which is known as tapered cascade. Two-pass connection (Fig. 1.10B) is
adopted to attain higher removal efficiency of contaminants, such
as boron [79, 80]. In this arrangement, the permeate from the first pass
enters the second pass as the feed for further treatment. The product water
from the second pass will be improved in quality.
1.5 CONCENTRATION POLARIZATION
RO membrane process and other pressure driven membrane processes
accomplish a separation with their ability to transport one component
more readily than another. For a feed containing a solute and a solvent,
the solvent permeates through the membrane whereas the solute is
(partly) retained by the membrane under applied pressure. Hence, the
concentration of the solute in the permeate is lower than that in the bulk
of the feed solution. The retained solutes accumulate at the membrane
surface, leading to a higher solute concentration near the surface com-
pared to the bulk concentration. This phenomenon is known as concen-
tration polarization (CP) [15]. This concentration build-up leads to a
FIG. 1.10 Membrane module/pressure vessel connection in (A) tapered cascade 3:2:1
array; (B) two-pass connection. Adapted from Fane AG, Wang R, Tang C. Membrane technology
for water: microfiltration, ultrafiltration, nanofiltration, and reverse osmosis. Treatise on water sci-
ence, vol. 4. Amsterdam; Hackensack, NJ: Elsevier Science; 2011. p. 301.
25
1.5 CONCENTRATION POLARIZATION](https://image.slidesharecdn.com/wang2019-250518085119-1d7dee3c/85/wang201fdfdddddddddddddddddddddddddddddddddddddd9-pdf-25-320.jpg)
![cm
cb
¼
exp J=k
ð Þ
Rint + 1Rint
ð Þexp J=k
ð Þ
(1.13)
The ratio cm/cb is the concentration polarization modulus. It increases
with the increasing flux J, with increasing Rint and with decreasing k, when
Rint ≪ 1. When the solutes are completely retained by the membrane, i.e.,
Rint ¼ 1 and cp ¼ 0, Eq. (1.13) becomes:
cm
cb
¼ exp J=k
ð Þ (1.14)
The mass transfer coefficient k can be determined from Sherwood num-
ber Sh:
Sh ¼
kdh
D
(1.15)
Sherwood number is related to Reynolds number Re and Schmidt num-
ber Sc:
Sh ¼ a Reb
Scc
dh=L
ð Þd
(1.16)
Sc ¼
v
D
(1.17)
Re ¼
udh
ν
(1.18)
where dh is the hydraulic diameter, L is the channel length, u is the cross-
flow velocity, and v is the kinematic viscosity. In Eq. 1.16, a, b, c, and d are
the constant and their magnitudes depend on the flow regime and the
geometry of flow channel [9].
CP gives rise to an increased solute concentration at the membrane
surface, which decreases the water flux and apparent solute rejection
(see Fig. 1.8 and Section 1.3.1.1). The CP of foulants can accelerate membrane
fouling [81]. The presence of foulant cake layer on the other hand may also
enhance the CP, which is called cake-enhanced CP [82]. This phenomenon is
caused by the decreased mass transfer of solutes (e.g., ions) in the cake layer,
as a result of decreased shear flow rate within the layer. Because the CP
modulus (cm/cb) increases with increasing water flux and decreasing mass
transfer coefficient, the CP can be controlled by operating at a lower water
flux, and enhancing the mass transfer at membrane surface via increasing
the cross-flow velocity and/or the use of a well-designed spacer, etc.
1.6 MEMBRANE FOULING AND CONTROL
Membrane fouling is defined as the deposition of contaminants on a
membrane surface and/or inside membrane pores. Non-porous RO mem-
branes generally suffer from the foulant cake deposition on the membrane
27
1.6 MEMBRANE FOULING AND CONTROL](https://image.slidesharecdn.com/wang2019-250518085119-1d7dee3c/85/wang201fdfdddddddddddddddddddddddddddddddddddddd9-pdf-27-320.jpg)
![surface. According to the nature of foulants, membrane fouling can be cat-
egorized into colloidal fouling, organic fouling, inorganic scaling, and bio-
fouling (Fig. 1.12).
Similar to the CP, membrane fouling can directly lead to water flux
drop during constant pressure operation. However, the foulant layer
remains on the membrane surface when the permeate flux is reduced to
zero, while CP disappears in absence of permeate flux. The timescale
for CP to reach a stable condition or disappear is short, while the fouling
typically occurs over longer timescale (rapid fouling can occur under
unfavorable conditions). Although CP and fouling are two different phe-
nomena, CP can accelerate membrane fouling as CP causes increased fou-
lant concentration at membrane surface, while foulant deposition can
result in enhanced CP.
1.6.1 Factors Affecting Membrane Fouling
A great number of factors can affect RO membrane fouling. In general,
these factors are classified into three groups as shown in Fig. 1.13, includ-
ing membrane properties, feed water composition, and hydrodynamic
conditions.
1.6.1.1 Membrane Properties
The membrane properties such as hydrophilicity, roughness, and sur-
face charge can affect membrane fouling. Generally, a membrane with
hydrophilic and smooth surface and low surface charge is preferred to
resist fouling at initial stage [57, 58, 83, 84]. For example, a NF membrane
with a smooth and hydrophilic surface exhibited more sustainable flux
performance at the initial stage of bovine serum albumin (BSA) fouling,
as compared with other RO/NF membranes of rougher and less hydro-
philic surfaces [65]. In addition, the surface functional groups are also
important to membrane fouling. The –COO–
on the TFC PA membrane
surface may interact with specific ions such as Ca2+
, which accelerates
membrane fouling [85]. However, these effects could hardly be observed
under severe fouling conditions such as at longer fouling duration, as
FIG. 1.12 Types of membrane foulants.
28 1. REVERSE OSMOSIS MEMBRANE SEPARATION TECHNOLOGY](https://image.slidesharecdn.com/wang2019-250518085119-1d7dee3c/85/wang201fdfdddddddddddddddddddddddddddddddddddddd9-pdf-28-320.jpg)
![fouling is dominated by foulant-deposited-foulant interaction instead of
foulant-membrane interaction [76, 86].
1.6.1.2 Feed Water Composition
The type and concentration of foulants can significantly affect mem-
brane fouling. For instance, the feed water containing a high concentration
of sparingly soluble salts is susceptible to scale formation [87], while the
presence of microorganisms and nutrients may promote biofouling. On
the other hand, the solution chemistry such as pH, ionic strength, and spe-
cific ions can drastically change the physiochemical properties of foulants
(i.e., functional groups, size, charge, conformation, etc.) [88], or affect the
interaction between foulants or between foulants and membranes [89].
Unfavorable solution conditions can lead to less repulsion between fou-
lants and/or foulants and membrane, resulting in severe organic and col-
loidal fouling [65, 86, 90–92].
1.6.1.3 Hydrodynamic Conditions
Hydrodynamic conditions, including the level of water flux/pressure,
cross-flow velocity, recovery, temperature and module/spacer design, are
important to membrane fouling. The influence of some factors on mem-
brane performance (in the absence of foulants) has been discussed in
Section 1.3.1.1. Those factors affecting CP can also influence the membrane
fouling. For example, a high-water flux level leads to more severe CP of
foulants, which may promote gel formation on the membrane surface.
In addition, the greater drag force towards membrane surface may facil-
itate foulant deposition [65]. Increasing cross-flow velocity enhances mass
Feedwater composition
Foulant type, concentration
pH, ionic strength,
specific ions such as Ca2+
Hydrodynamic conditions
Flux
Cross-flow velocity
Recovery
Temperature
Module and spacer design
Membrane properties
Roughness
Charge
Hydrophobicity
Surface functional groups
FIG. 1.13 Factors affecting membrane fouling. Reprinted from Tang CY, Chong TH, Fane AG.
Colloidal interactions and fouling of NF and RO membranes: a review. Adv Colloid Interface Sci
2011;164(1–2):126–43.
29
1.6 MEMBRANE FOULING AND CONTROL](https://image.slidesharecdn.com/wang2019-250518085119-1d7dee3c/85/wang201fdfdddddddddddddddddddddddddddddddddddddd9-pdf-29-320.jpg)
![transfer at membrane surface, resulting in less CP as well as less foulant
deposition [65]. The use of spacer helps to increase turbulence of flow and
thus enhance the mass transfer, but it is noted that the poor design of
spacer (e.g., presence of hydraulic dead zones) may promote foulant
deposition [85, 93].
1.6.2 Fouling Mitigation
In addition to the control of the parameters that affect fouling (dis-
cussed in Sections 1.6.1.1–1.6.1.3), other measures are also commonly
applied to mitigate fouling, including pretreatment of feed water, enhanc-
ing membrane antifouling property, using chemicals/agents during RO
operation and frequent cleaning [94]. These methods are summarized
as follows:
• Properly designed RO system and operating conditions. For example,
selection of suitable membrane modules and operating conditions (i.e.,
recovery, cross-flow velocity, pressure or flux level, etc.) according to
the feed water composition.
• Enhancing antifouling property of the membrane. To make membrane
surface smoother and more hydrophilic is a common strategy to reduce
fouling, which can be achieved by surface modification through coating
and grafting, etc. [94]. Recently, use of novel materials such as silver
nanoparticles and graphene oxide (GO) to impart anti-biofouling
properties has become an attractive direction [27, 94].
• Pretreatment of feed solution. A good pretreatment system is essential
to achieve a long RO membrane life. Different pretreatment processes
can be chosen depending on the feed composition and the RO
membrane materials/modules. The following methods are commonly
used in pretreatment: coagulation and granular media filtration, UF/
MF, adsorption by activated carbon, chlorination [15, 95]. It is noted that
CA RO membrane demands bacteria-free feed water and the
chlorination in pretreatment is an essential step [19].
• Use of chemicals during RO process. For example, adding a complexing
agent such as ethylenediaminetetraacetic acid (EDTA) to reduce free
calcium ions is helpful in fouling control; pH adjustment is important to
alter the charge of proteins and thereby affecting the foulant-foulant or
foulant-membrane interactions.
• Cleaning. Although the above-mentioned methods are able to reduce
fouling to certain extent, various cleaning methods are always
employed in practical applications. Physical cleaning and chemical
cleaning are the common methods used for RO membranes [15, 94].
A typical cleaning regime consists of flushing membrane modules by
circulating cleaning solutions at a high flow rate, followed by soaking
30 1. REVERSE OSMOSIS MEMBRANE SEPARATION TECHNOLOGY](https://image.slidesharecdn.com/wang2019-250518085119-1d7dee3c/85/wang201fdfdddddddddddddddddddddddddddddddddddddd9-pdf-30-320.jpg)
![and then second time flush, and so on. The commonly used chemical
cleaning agents include acids, alkalis, chelatants, detergents and
sterilizers [15, 19].
1.7 RO APPLICATIONS
RO has received various applications mainly comprising water produc-
tion and solute concentration. The former produces clean water/desalted
water (solvent) from feed water while the latter focuses on the production
of concentrated solutes.
1.7.1 Desalination and Water Reclamation
1.7.1.1 Desalination
More than one-half of the RO systems currently installed are for the
desalination of seawater and brackish water [96]. Table 1.5 presents a com-
parison of the components in seawater and brackish water. The data show
TABLE 1.5 Comparison of the Components in Seawater and Brackish Water
Components Seawater (mg/L)
Brackish water 1 (mg/
L)
Brackish water 2 (mg/
L)
Ca2+
440–670 175 179
Mg2+
1400–1550 58 132
Ba2+
0.010 0.10 0.06
Sr2+
5–7.5 – 26.4
Boron 4.9–5.3 – –
Na+
12,000 170 905
Cl
21,000–23,000 72 1867
SO4
2 2400–2670 670 384
HCO3
120–142 260 146
TDS 38,000–40,000 1320 3664
DOC 2 – 1.4
Note: the seawater source is surface water from the Mediterranean Sea (Toulon, France), and both of the
brackish water sources are groundwaters (the first is from Port Hueneme, CA, USA; the second is from
Martin county, FL, USA).
Adapted from Greenlee LF, Lawler DF, Freeman BD, Marrot B, Moulin P. Reverse osmosis desalination: water
sources, technology, and today’s challenges. Water Res 2009 43(9):2317–48.
31
1.7 RO APPLICATIONS](https://image.slidesharecdn.com/wang2019-250518085119-1d7dee3c/85/wang201fdfdddddddddddddddddddddddddddddddddddddd9-pdf-31-320.jpg)
![obvious differences between the two types of water. The seawater has a
much higher total dissolved solids (TDS) concentration, mainly due to
the large amounts of Na+
and Cl
(the ratios of Na/TDS and Cl/TDS in
seawater are significantly higher than that in brackish water). The boron
content in seawater is generally higher than that in brackish water [97].
A typical RO system for water production consists of pretreatment,
membrane separation, and post treatment [9, 98]. The examples of differ-
ent RO systems are shown in Table 1.6. For seawater desalination, SWRO
membranes are used to attain high salt rejection during the membrane
process. The high osmotic pressure (high salinity) requires an operating
pressure of 60–70 bar, making SWRO more energy intensive than other
RO/water source options. Media filtration or low-pressure membrane
process (MF or UF) is adopted for the pretreatment of seawater to reduce
membrane fouling. The product water is usually conditioned by the addi-
tion of calcium ions to meet the requirement of World Health Organiza-
tion (WHO) [99]. The concentrate brine will pass through an energy
recovery device prior to the discharge to ocean or further treatment. Since
the end of the 1970s, the energy consumption of SWRO has been reduced
significantly from more than 15 kWh/m3
to 2 kWh/m3
due to continual
technological improvements (Fig. 1.14) [8]. The current energy consump-
tion is close to the thermal minimum energy of desalination (1.06 kWh/m3
for seawater of 35 g/L at 50% recovery) [8]. The actual consumption is
higher than this minimum value, as desalination plants are finite in size
and do not operate as a reversible thermodynamic process [8]. BWRO is
usually operated at modest-size plants (not a limitless source) with higher
recovery (75%–90%). The lower salinity of brackish water requires much
lower pressure (6–30 bar) [97] and thus lower energy consumption.
SWRO generally faces the fouling problem caused by particulate mat-
ter, organic compounds, and biological growth, while the high recovery in
BWRO causes severe scaling problems mainly due to the calcium sulfate
and carbonate precipitation. In addition, boron removal of RO system is
also a concern for achieving drinking water standard, due to the low rejec-
tion of boron compared to other ions at neutral pH [97]. The high boron
concentration in seawater often requires a second RO pass to further
reduce the boron content to meet the drinking water quality
(2.4 mg/L [100]). Although boron concentration in brackish water is
low, the relatively low rejection of BWRO membrane and higher recovery
still demands another boron removal strategy, such as boron-specific ion
exchange [97].
1.7.1.2 Water Reclamation/Wastewater Treatment
Wastewater sources that use RO treatment include municipal wastewa-
ter, industrial wastewater, and other contaminated water sources (e.g.,
leachate water). When the feed water is wastewater or treated wastewater,
32 1. REVERSE OSMOSIS MEMBRANE SEPARATION TECHNOLOGY](https://image.slidesharecdn.com/wang2019-250518085119-1d7dee3c/85/wang201fdfdddddddddddddddddddddddddddddddddddddd9-pdf-32-320.jpg)
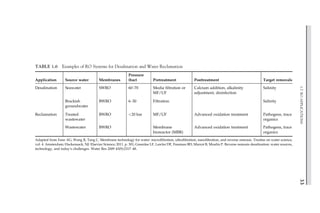
![the target removals are pathogens and trace organics, instead of salinity
(Table 1.6). In the case of municipal wastewater, the treated wastewater
(i.e., secondary effluent) as RO feed is more common, as it builds on the
existing municipal wastewater infrastructure. MF/UF pretreatment is
generally operated in the dead-end cycles to provide the feed with low
solid content to the RO unit. The low salinity content allows the RO to
operate at much lower pressure with higher recovery (75% vs. 50%) as
compared to a SWRO unit. Advanced oxidation (e.g., UV) as post treat-
ment can provide an added barrier to virus and oxidize the trace organics
present in the RO permeates. The high quality permeate water produced
by the dual membrane reclamation processes (MF/UF + RO) is generally
suitable for the demanding industrial applications (e.g., ultrapure water
for the electronics, pharmaceutical, and power generation industries)
and indirect potable reuse (IPR). A comprehensive review of membrane
reclamation plant and comparison with SWRO was given by C^
ot
e et al.
[99]. The detailed reviews on pretreatment and retentate treatment tech-
nology can be also found elsewhere [95, 101, 102].
The target for water treatment varies for different industrial wastewa-
ters and contaminated water sources. For example, the targets of RO treat-
ment for landfill leachate and electroplating wastewater are for
purification and discharge [103, 104], while the wastewaters from dairy
industry, textile industry, and olive mill are often reused after RO
FIG. 1.14 The change in energy consumption for the reverse osmosis stage in SWRO
plants from the 1970s to 2008. The horizontal dashed line corresponds to the theoretical mini-
mum energy (1.06 kWh/m3
) required for desalination of 35 g/L seawater at 50% recovery.
The energy data presented here exclude the energy required for intake, pretreatment,
post-treatment, and brine discharge. Reprinted from Elimelech M, Phillip WA. The future of sea-
water desalination: energy, technology, and the environment. Science 2011;333(6043):712–7.
34 1. REVERSE OSMOSIS MEMBRANE SEPARATION TECHNOLOGY](https://image.slidesharecdn.com/wang2019-250518085119-1d7dee3c/85/wang201fdfdddddddddddddddddddddddddddddddddddddd9-pdf-34-320.jpg)
![treatment [105–107], and some RO process is targeted for zero liquid dis-
charge [108]. The pretreatment and post-treatment processes depend on
both the wastewater sources and the final target. For high recovery or zero
liquid discharge, controlled crystallization can be used as a post treatment
[103, 108]. When treated water is recycled as process water (without the
demand of ultrapure water quality), the wastewater is generally pre-
treated by UF and no post treatment is needed after RO unit [106]. One
of the most attractive applications is to separate valuable products from
wastewater, such as the reclamation of plating wastewater and recovery
of heavy metals [19]. An example is the recovery of nickel from nickel plate
rinsing tanks. The use of RO unit produces a permeate water with low con-
centration of nickel for reuse and a retentate stream with concentrated
nickel that can be sent back to plating tank [19].
1.7.2 Ultrapure Water Production
Ultrapure water production for the electronics industry is an estab-
lished application of RO. The usual feed is the municipal drinking water,
typically containing less than 200 mg/L dissolved solids. To meet the
requirement of extraordinarily high purity (almost only water molecules
present in the ultrapure water, refer to Table 1.7 for the specifications of
drinking water and ultrapure water), the municipal drinking water
undergoes extensive treatment with a complex array of operations [19].
As the key part of the process, RO unit removes more than 98% of dis-
solved salts and particulates under high recovery (90%). In addition
to RO, carbon absorption removes dissolved organics, ion exchange step
removes trace ionic impurities, and UV sterilizers and cartridge microfil-
ters are used to maintain sterility [19].
1.7.3 Solute Concentration
1.7.3.1 Concentration of Juices and Dairy Products
The start of the interests in RO concentration of fruit juices dates back to
40 years ago, due to its advantages over conventional thermal based pro-
cesses: (1) low damage to the thermal sensitive components, (2) low
energy consumption, and (3) ability to produce high quality products
(retain the flavor of products) [96]. Prior studies have reported RO appli-
cations for various juice concentrations, including apple, pear, grape,
orange, blackcurrent, etc. [109–113] (Table 1.8). The high solid content
in the feed preferentially uses the plate-and-frame module or tubular
module which is suitable for tougher cleaning methods [96] (the descrip-
tion of different RO membrane modules can be found in Section 1.4). In an
example of the concentration of apple juice, the RO-evaporation system
35
1.7 RO APPLICATIONS](https://image.slidesharecdn.com/wang2019-250518085119-1d7dee3c/85/wang201fdfdddddddddddddddddddddddddddddddddddddd9-pdf-35-320.jpg)
![shows excellent performance [117]. RO as pre-concentration step can
remove more than 50% of the water prior to evaporation, while maintain-
ing 98%–99% of sugar and acid as well as 80%–90% of volatile flavors in
the concentrate. It achieves a sugar concentration level of 20–25°Brix,
while the subsequent evaporation can boost the level to above 75°Brix.
This combined system can save energy of 60%–75% as compared to direct
evaporation. Meanwhile, the permeate water from the RO unit can be
recycled as process water (i.e., water reuse) [117].
Similar to fruit juices, milk and whey can be also concentrated by RO,
with the advantage of low temperature operation. Pre-concentration of
milk and whey prior to transportation can reduce transportation costs
[96, 117]. The main application of RO seems to be the treatment of dairy
process waters and effluents, in order to recover milk proteins and lactose,
while obtaining a permeate that can be recycled for rinsing or cooling [105,
117]. Most of earlier work used spiral wound modules (SWM) because of
their availability and low cost [105, 117]. On the other hand, concentration
of milk by RO has great potential for ice-cream manufacturing, as 70% of
water can be removed while the solids can be well retained [117].
TABLE 1.7 Specifications for Typical Municipal Drinking Water and Ultrapure Water
Ultrapure water Drinking water
Resistivity (MΩ cm) 18.2 –
TOC (ppb) 5 5000
Particles/L by laser 0.1 μm 100 –
Bacteria/100 mL by culture 0.1 30
Silica, dissolved (ppb) 3 3000
Boron (ppb) 1 40
Ions (ppb)
Na+
0.01 3000
K+
0.02 2000
Cl
0.02 10,000
Br
0.02 –
NO3
0.02 –
SO4
2 0.02 15,000
Total ions 0.1 100,000
Adapted from Baker RW. Reverse osmosis. Membrane technology and applications. John Wiley Sons, Ltd; 2004.
p. 191–235.
36 1. REVERSE OSMOSIS MEMBRANE SEPARATION TECHNOLOGY](https://image.slidesharecdn.com/wang2019-250518085119-1d7dee3c/85/wang201fdfdddddddddddddddddddddddddddddddddddddd9-pdf-36-320.jpg)
![TABLE 1.8 Performance of RO Membrane in Juice Concentration and Dealcoholization
Feed Membrane Initial
concentration
Final
concentration
Operating conditions Ref.
Juices Apple juice Tubular PA membrane 11°Brix 26°Brix P ¼ 55 bar, T ¼ 35°C [109]
Blackcurrent juice Tubular PA membrane 16.5°Brix 28.6°Brix P ¼ 60 bar, T ¼ 25°C [110]
Orange juice Plate-and-frame PA
membrane
8°Brix 36°Brix P ¼ 60 bar, T ¼ 25°C [111]
Grape juice Plate-and-frame PA
membrane
14.7°Brix 28.2°Brix P ¼ 60 bar, T ¼ 40°C [112]
Pear juice PA membrane (pilot
plant)
11.9°Brix 28.9°Brix P ¼ 40 bar, T ¼ 25–27°
C
[113]
Fermented
beverage
Home-made alcoholic
beveragea
Spiral wound
membrane
5.5%v/v 0.5%v/v P ¼ 35 bar, T ¼ 0°C [114]
Beerb
CA membrane 5.28%v/v – P ¼ 35 bar, T ¼ 0°C,
RE ¼ 3.6%
[115]
Red winec
CA membrane 12%v/v 8.4%v/v P ¼ 16 bar, T ¼ 30°C,
RE ¼ 2.5%
[116]
Note: P, feed pressure (bar); T, temperature (°C); RE, ethanol rejection (%); initial and final concentrations for juices are in the unit of °Brix (sugar content) and those for
fermented beverages are in the unit of %v/v (alcohol concentration).
a
Operated in continuous mode.
b
Operated in diafiltration mode.
c
Operated in semi-continuous mode.
37
1.7
RO
APPLICATIONS](https://image.slidesharecdn.com/wang2019-250518085119-1d7dee3c/85/wang201fdfdddddddddddddddddddddddddddddddddddddd9-pdf-37-320.jpg)
![1.7.3.2 Dealcoholization of Fermented Beverage
The demand for low-alcohol and alcohol-free drinks has been con-
stantly growing. RO can be used to reduce the alcohol from wine, beer
and cider without altering their flavor and quality [96, 117, 118]. Because
this process is carried out at low temperature compared to traditional dis-
tillation, it does not involve phase change for alcohol removal [115]. Exam-
ples of RO dealcoholization are listed in Table 1.8. The dealcoholization by
RO often comprises the following steps [117]:
• Pre-concentration—the fermented beverage is separated into a
permeate stream containing water and alcohol, and a retentate stream
consisting of concentrated drinks and flavors.
• Diafiltration—addition of desalted and deoxygenized water by keeping
the feed volume constant to achieve higher removal of alcohol and
higher retention of desired aroma.
• Alcohol adjustment—fine tuning of taste and alcohol content by
addition of desalted and deoxygenized water.
1.7.4 Organic Solvent Separation
Although the RO membranes are designed for the applications related
to aqueous solution, the membrane materials are considered chemically
resistant to some organic solvent, driving the applications of RO for the
treatment of solvent-contaminated wastewater [96]. Earlier work has
shown the feasibility of separation of small solvent molecules from larger
hydrocarbons using cellulose acetate (CA) and TFC polyamide (PA) RO
membranes [96]. However, the membrane materials CA and polysulfone
are not resistant to certain solvents or hydrocarbons [96, 119]. Hence, it
was later found that some other polymers such as polyimide show good
resistance to solvent [119]. One commercial project by Mobil Oil devel-
oped a RO process to separate up to 50% solvent from the dewaxed oil
using polyimide SWMs to save the energy of conventional solvent dewax-
ing process [19, 119]. Recently, solvent resistant nanofiltration (NF) has
gained more and more interests in the field of organic solvent separation;
as the solvent resistant NF membranes show significantly better stability
during long term run and much higher solvent flux, as compared to the
conventional RO membranes [120].
1.8 CONCLUSIONS
Reverse osmosis (RO) has a significant role in water industry. It is
widely used for desalination, water reclamation and ultrapure water pro-
duction. In addition, it also has niche applications such as solute
38 1. REVERSE OSMOSIS MEMBRANE SEPARATION TECHNOLOGY](https://image.slidesharecdn.com/wang2019-250518085119-1d7dee3c/85/wang201fdfdddddddddddddddddddddddddddddddddddddd9-pdf-38-320.jpg)
![concentration and selective separation. Since the introduction of first thin-
film composite membranes in 1980s, TFC PA membranes have continu-
ously advanced and are still the state-of-the-art RO membranes with more
than 100 times better performance than their first generation membranes
[19]. The further improvement of membrane performance may rely on the
novel materials (e.g., emerging mixed matrix membranes and biomimetic
membranes) [4]. Besides high-performance membranes, the successful
operation of RO plants also depends on smart membrane element
design/process design, and appropriate process operating conditions,
to minimize the negative effects from concentration polarization and
membrane fouling, to meet the requirement of product water as well as
to reduce capital cost and energy consumption. For example, the optimi-
zation of membrane module design with improved hydrodynamics,
improved cleaning methods and energy recovery devices can contribute
significantly to energy and cost saving.
References
[1] Wang LK, Chen JP, Hung YT, Shammas NK, editors. Handbook of environmental engi-
neering. Membrane and desalination technologies, vol. 13. Totowa, NJ: Humana Press;
2011.
[2] Loeb S, Sourirajan S. Sea water demineralization by means of an osmotic membrane.
University of California, Department of Engineering; 1960.
[3] Cadotte JE, Peterson RJ. Thin-film composite reverse-osmosis membranes: origin,
development, and recent advances. In: Turbak AF, editor. Synthetic membranes,
vol. 1 desalination. p. 350, ACS Symposium Series, 53. Washington, DC: Am. Chemical
Soc.; 1981.
[4] Park HB, Kamcev J, Robeson LM, Elimelech M, Freeman BD. Maximizing the right
stuff: the trade-off between membrane permeability and selectivity. Science 2017;356
(6343):1138–48.
[5] Lee KP, Arnot TC, Mattia D. A review of reverse osmosis membrane materials for
desalination—development to date and future potential. J Membr Sci 2011;370(1):1–22.
[6] Rodrı́guez-Calvo A, Silva-Castro GA, Osorio F, González-López J, Calvo C. Reverse
osmosis seawater desalination: current status of membrane systems. Desalin Water
Treat 2015;56(4):849–61.
[7] Birkett J, Truby R. A figure of merit for appreciating improvements in RO membrane
performance. International Desalination Association News; 2007.
[8] Elimelech M, Phillip WA. The future of seawater desalination: Energy, technology, and
the environment. Science 2011;333(6043):712–7.
[9] Fane AG, Wang R, Tang C. Membrane technology for water: microfiltration, ultrafiltra-
tion, nanofiltration, and reverse osmosis. Treatise on water science, vol. 4. Amsterdam;
Hackensack, NJ: Elsevier Science; 2011;301.
[10] Lau WJ, Gray S, Matsuura T, Emadzadeh D, Paul Chen J, Ismail AF. A review on poly-
amide thin film nanocomposite (TFN) membranes: history, applications, challenges
and approaches. Water Res 2015;80:306–24.
[11] Giwa A, Akther N, Dufour V, Hasan SW. A critical review on recent polymeric and
nano-enhanced membranes for reverse osmosis. RSC Adv 2016;6(10):8134–63.
39
REFERENCES](https://image.slidesharecdn.com/wang2019-250518085119-1d7dee3c/85/wang201fdfdddddddddddddddddddddddddddddddddddddd9-pdf-39-320.jpg)
![[12] Jeong BH, Hoek EMV, Yan Y, Subramani A, Huang X, Hurwitz G, et al. Interfacial poly-
merization of thin film nanocomposites: a new concept for reverse osmosis mem-
branes. J Membr Sci 2007;294(1–2):1–7.
[13] Sch€
afer AI, Fane AG, Waite TD. In: Sch€
afer AI, Fane AG, Waite TD, editors. Nanofil-
tration—principles and applications. UK: Elsevier Advanced Technology; 2005.
[14] Wijmans JG, Baker RW. The solution-diffusion model: a review. J Membr Sci
1995;107(1):1–21.
[15] Mulder M. Basic Principles of Membrane Technology. The Netherlands: Kluwer Aca-
demic Publishers; 1996.
[16] Yan J, Lau WWY. Effect of internal coagulant on morphology of polysulfone hollow
hiber membranes. I. Sep Sci Technol 1998;33(1):33–5.
[17] Nguyen TPN, Yun ET, Kim IC, Kwon YN. Preparation of cellulose triacetate/cellulose
acetate (CTA/CA)-based membranes for forward osmosis. J Membr Sci 2013;433:49–59.
[18] Ong RC, Chung TS, de Wit J, Helmer BJ. Novel cellulose ester substrates for high per-
formance flat-sheet thin-film composite (TFC) forward osmosis (FO) membranes.
J Membr Sci 2014;473:63–71.
[19] Baker RW. Reverse osmosis. Membrane technology and applications. John Wiley
Sons, Ltd; 2004. p. 191–235.
[20] Kumano A, Fujiwara N. Cellulose triacetate membranes for reverse osmosis.
In: Advanced membrane technology and applications. Wiley; 2008. p. 21–46.
[21] AlBatniji MS. Performance optimization of brackish water reverse osmosis desalination
plants in Gaza strip. The Islamic University of Gaza; 2016.
[22] Pageau L, Sourirajan S. Improvement of porous cellulose acetate reverse osmosis mem-
branes by change of casting conditions. J Appl Polym Sci 1972;16(12):3185–206.
[23] Idris A, Ismail AF, Noordin MY, Shilton SJ. Optimization of cellulose acetate hollow
fiber reverse osmosis membrane production using Taguchi method. J Membr Sci
2002;205(1–2):223–37.
[24] Saljoughi E, Mohammadi T. Cellulose acetate (CA)/polyvinylpyrrolidone (PVP) blend
asymmetric membranes: preparation, morphology and performance. Desalination
2009;249(2):850–4.
[25] Petersen RJ. Composite reverse osmosis and nanofiltration membranes. J Membr Sci
1993;83(1):81–150.
[26] Freger V. Kinetics of film formation by interfacial polycondensation. Langmuir
2005;21(5):1884–94.
[27] Li D, Yan Y, Wang H. Recent advances in polymer and polymer composite membranes
for reverse and forward osmosis processes. Prog Polym Sci 2016;61:104–55.
[28] Wei J, Liu X, Qiu C, Wang R, Tang CY. Influence of monomer concentrations on the
performance of polyamide-based thin film composite forward osmosis membranes.
J Membr Sci 2011;381(1–2):110–7.
[29] Xu G-R, Xu J-M, Feng H-J, Zhao H-L, Wu S-B. Tailoring structures and performance of
polyamide thin film composite (PA-TFC) desalination membranes via sublayers
adjustment-a review. Desalination 2017;417:19–35.
[30] Ghosh AK, Hoek EMV. Impacts of support membrane structure and chemistry on
polyamide–polysulfone interfacial composite membranes. J Membr Sci 2009;336
(1–2):140–8.
[31] Lee J, Jang JH, Chae HR, Lee SH, Lee CH, Park PK, et al. A facile route to enhance the
water flux of a thin-film composite reverse osmosis membrane: incorporating
thickness-controlled graphene oxide into a highly porous support layer. J Mater Chem
A 2015;3(44):22053–60.
[32] Li X, Chou S, Wang R, Shi L, Fang W, Chaitra G, et al. Nature gives the best solution for
desalination: aquaporin-based hollow fiber composite membrane with superior perfor-
mance. J Membr Sci 2015;494:68–77.
40 1. REVERSE OSMOSIS MEMBRANE SEPARATION TECHNOLOGY](https://image.slidesharecdn.com/wang2019-250518085119-1d7dee3c/85/wang201fdfdddddddddddddddddddddddddddddddddddddd9-pdf-40-320.jpg)
![[33] Ahmed FE, Lalia BS, Hashaikeh R. A review on electrospinning for membrane fabri-
cation: challenges and applications. Desalination 2015;356:15–30.
[34] Bui NN, McCutcheon JR. Nanofiber supported thin-film composite membrane for
pressure-retarded osmosis. Environ Sci Technol 2014;48(7):4129–36.
[35] Malaisamy R, Talla-Nwafo A, Jones KL. Polyelectrolyte modification of nanofiltration
membrane for selective removal of monovalent anions. Sep Purif Technol
2011;77(3):367–74.
[36] Liu C, Shi L, Wang R. Crosslinked layer-by-layer polyelectrolyte nanofiltration hollow
fiber membrane for low-pressure water softening with the presence of SO4
2
in feed
water. J Membr Sci 2015;486:169–76.
[37] Xu GR, Wang SH, Zhao HL, Wu SB, Xu JM, Li L, et al. Layer-by-layer (LBL) assembly
technology as promising strategy for tailoring pressure-driven desalination mem-
branes. J Membr Sci 2015;493:428–43.
[38] Duong PHH, Zuo J, Chung T-S. Highly crosslinked layer-by-layer polyelectrolyte FO
membranes: understanding effects of salt concentration and deposition time on FO
performance. J Membr Sci 2013;427:411–21.
[39] Qiu C, Qi S, Tang CY. Synthesis of high flux forward osmosis membranes by chemically
crosslinked layer-by-layer polyelectrolytes. J Membr Sci 2011;381(1–2):74–80.
[40] Sullivan DM, Bruening ML. Ultrathin, cross-linked polyimide pervaporation mem-
branes prepared from polyelectrolyte multilayers. J Membr Sci 2005;248(1–2):161–70.
[41] Hoek EMV, Ghosh AK. Nanotechnology-based membranes for water purification.
In: Nanotechnology applications for clean water. William Andrew Publishing; 2009.
p. 47–58.
[42] Yin J, Kim ES, Yang J, Deng B. Fabrication of a novel thin-film nanocomposite (TFN)
membrane containing MCM-41 silica nanoparticles (NPs) for water purification.
J Membr Sci 2012;423-424:238–46.
[43] Wu H, Tang B, Wu P. Optimizing polyamide thin film composite membrane covalently
bonded with modified mesoporous silica nanoparticles. J Membr Sci 2013;428:341–8.
[44] Liu Y, Rosenfield E, Hu M, Mi B. Direct observation of bacterial deposition on and
detachment from nanocomposite membranes embedded with silver nanoparticles.
Water Res 2013;47(9):2949–58.
[45] Zhao H, Qiu S, Wu L, Zhang L, Chen H, Gao C. Improving the performance of poly-
amide reverse osmosis membrane by incorporation of modified multi-walled carbon
nanotubes. J Membr Sci 2014;450:249–56.
[46] Ma N, Wei J, Qi S, Zhao Y, Gao Y, Tang CY. Nanocomposite substrates for controlling
internal concentration polarization in forward osmosis membranes. J Membr Sci
2013;441:54–62.
[47] Tian M, Wang Y-N, Wang R. Synthesis and characterization of novel high-performance
thin film nanocomposite (TFN) FO membranes with nanofibrous substrate reinforced
by functionalized carbon nanotubes. Desalination 2015;370:79–86.
[48] Tang C, Wang Z, Petrini
c I, Fane AG, H
elix-Nielsen C. Biomimetic aquaporin mem-
branes coming of age. Desalination 2015;368:89–105.
[49] Hovijitra NT, Wuu JJ, Peaker B, Swartz JR. Cell-free synthesis of functional aquaporin
Z in synthetic liposomes. Biotechnol Bioeng 2009;104(1):40–9.
[50] Holt JK, Park HG, Wang Y, Stadermann M, Artyukhin AB, Grigoropoulos CP, et al. Fast
mass transport through sub-2-nanometer carbon nanotubes. Science 2006;312(5776):
1034–7.
[51] Kumar M, Grzelakowski M, Zilles J, Clark M, Meier W. Highly permeable polymeric
membranes based on the incorporation of the functional water channel protein Aqua-
porin Z. Proc Natl Acad Sci U S A 2007;104(52):20719–24.
[52] Zhao Y, Vararattanavech A, Li X, H
elixnielsen C, Vissing T, Torres J, et al. Effects of
proteoliposome composition and draw solution types on separation performance of
41
REFERENCES](https://image.slidesharecdn.com/wang2019-250518085119-1d7dee3c/85/wang201fdfdddddddddddddddddddddddddddddddddddddd9-pdf-41-320.jpg)
![aquaporin-based proteoliposomes: implications for seawater desalination using
aquaporin-based biomimetic membranes. Environ Sci Technol 2013;47(3):1496–503.
[53] Qi S, Wang R, Chaitra GKM, Torres J, Hu X, Fane AG. Aquaporin-based biomimetic
reverse osmosis membranes: stability and long term performance. J Membr Sci
2016;508:94–103.
[54] Barboiu M. Artificial water channels—incipient innovative developments. Chem Com-
mun 2016;52(33):5657–65.
[55] Ho W, Sirkar K. Membrane handbook. Springer US; 2012.
[56] Tang CY, Chong TH, Fane AG. Colloidal interactions and fouling of NF and RO mem-
branes: a review. Adv Colloid Interf Sci 2011;164(1–2):126–43.
[57] Zhu X, Elimelech M. Fouling of reverse osmosis membranes by aluminum oxide col-
loids. J Environ Eng 1995;121(12):884–92.
[58] Elimelech M, Zhu X, Childress AE, Hong S. Role of membrane surface morphology in
colloidal fouling of cellulose acetate and composite aromatic polyamide reverse osmo-
sis membranes. J Membr Sci 1997;127(1):101–9.
[59] Wei J, Qiu C, Wang YN, Wang R, Tang CY. Comparison of NF-like and RO-like thin
film composite osmotically-driven membranes-Implications for membrane selection
and process optimization. J Membr Sci 2013;427:460–71.
[60] Gu Y, Wang YN, Wei J, Tang CY. Organic fouling of thin-film composite polyamide
and cellulose triacetate forward osmosis membranes by oppositely charged macromol-
ecules. Water Res 2013;47(5):1867–74.
[61] Tang CY, Kwon YN, Leckie JO. Probing the nano- and micro-scales of reverse osmosis
membranes—a comprehensive characterization of physiochemical properties of
uncoated and coated membranes by XPS, TEM, ATR-FTIR, and streaming potential
measurements. J Membr Sci 2007;287(1):146–56.
[62] Tang CY, Fu QS, Robertson AP, Criddle CS, Leckie JO. Use of reverse osmosis mem-
branes to remove perfluorooctane sulfonate (PFOS) from semiconductor wastewater.
Environ Sci Technol 2006;40(23):7343–9.
[63] Childress AE, Elimelech M. Relating nanofiltration membrane performance to
membrane charge (electrokinetic) characteristics. Environ Sci Technol 2000;34
(17):3710–16.
[64] Jones KL, O’Melia CR. Protein and humic acid adsorption onto hydrophilic membrane
surfaces: effects of pH and ionic strength. J Membr Sci 2000;165(1):31–46.
[65] Wang YN, Tang CY. Protein fouling of nanofiltration, reverse osmosis, and ultrafiltra-
tion membranes—the role of hydrodynamic conditions, solution chemistry, and mem-
brane properties. J Membr Sci 2011;376(1–2):275–82.
[66] Kwon YN, Tang CY, Leckie JO. Change of membrane performance due to chlorination
of crosslinked polyamide membranes. J Appl Polym Sci 2006;102(6):5895–902.
[67] Do VT, Tang CY, Reinhard M, Leckie JO. Effects of chlorine exposure conditions on
physiochemical properties and performance of a polyamide membrane-mechanisms
and implications. Environ Sci Technol 2012;46(24):13184–92.
[68] Wang YN, Wei J, She Q, Pacheco F, Tang CY. Microscopic characterization of FO/PRO
membranes—a comparative study of CLSM, TEM and SEM. Environ Sci Technol
2012;46(18):9995–10003.
[69] Tang CY, Kwon YN, Leckie JO. Characterization of humic acid fouled reverse osmosis
and nanofiltration membranes by transmission electron microscopy and streaming
potential measurements. Environ Sci Technol 2007;41(3):942–9.
[70] Yun MA, Yeon KM, Park JS, Lee CH, Chun J, Lim DJ. Characterization of biofilm struc-
ture and its effect on membrane permeability in MBR for dye wastewater treatment.
Water Res 2006;40(1):45–52.
[71] Conchello J-A, Lichtman JW. Optical sectioning microscopy. Nat Meth 2005;2(12):
920–31.
42 1. REVERSE OSMOSIS MEMBRANE SEPARATION TECHNOLOGY](https://image.slidesharecdn.com/wang2019-250518085119-1d7dee3c/85/wang201fdfdddddddddddddddddddddddddddddddddddddd9-pdf-42-320.jpg)
![[72] Chen Y, Liu C, Setiawan L, Wang Y-N, Hu X, Wang R. Enhancing pressure retarded
osmosis performance with low-pressure nanofiltration pretreatment: membrane foul-
ing analysis and mitigation. J Membr Sci 2017;543:114–22.
[73] Coster HGL, Chilcott TC, Coster ACF. Impedance spectroscopy of interfaces, mem-
branes and ultrastructures. Bioelectrochem Bioenerg 1996;40(2):79–98.
[74] Loh CH, Wang R. Effects of additives and coagulant temperature on fabrication of high
performance PVDF/Pluronic F127 blend hollow fiber membranes via nonsolvent
induced phase separation. Chin J Chem Eng 2012;20(1):71–9.
[75] Lee S, Elimelech M. Relating organic fouling of reverse osmosis membranes to intermo-
lecular adhesion forces. Environ Sci Technol 2006;40(3):980–7.
[76] Tang CY, Kwon YN, Leckie JO. The role of foulant-foulant electrostatic interaction on
limiting flux for RO and NF membranes during humic acid fouling—theoretical basis,
experimental evidence, and AFM interaction force measurement. J Membr Sci 2009;
326(2):526–32.
[77] Nikolay V. Desalination engineering: planning and design. McGraw-Hill Professional;
2012. 1 p.
[78] Fane AG, Wang R, Hu MX. Synthetic membranes for water purification: status and
future. Angew Chem Int Ed 2015;54(11):3368–86.
[79] Wang Y-N, Li W, Wang R, Tang CY. Enhancing boron rejection in FO using alkaline
draw solutions. Water Res 2017;118:20–5.
[80] G€
uler E, Kaya C, Kabay N, Arda M. Boron removal from seawater: state-of-the-art
review. Desalination 2015;356:85–93.
[81] Wang Y-N, Wang R, Li W, Tang CY. Whey recovery using forward osmosis—
evaluating the factors limiting the flux performance. J Membr Sci 2017;533:179–89.
[82] Hoek EMV, Elimelech M. Cake-enhanced concentration polarization: a new fouling
mechanism for salt-rejecting membranes. Environ Sci Technol 2003;37(24):5581–8.
[83] Vrijenhoek EM, Elimelech M, Hong S, editors. Influence of membrane properties,
solution chemistry, and hydrodynamics on colloidal fouling of reverse osmosis
and nanofiltration membranes. ACS Division of Environmental Chemistry; 2000.
Preprints.
[84] Tang CY, Fu QS, Criddle CS, Leckie JO. Effect of flux (transmembrane pressure) and
membrane properties on fouling and rejection of reverse osmosis and nanofiltration
membranes treating perfluorooctane sulfonate containing wastewater. Environ Sci
Technol 2007;41(6):2008–14.
[85] Wang YN, J€
arvel€
a E, Wei J, Zhang M, Kyll€
onen H, Wang R, et al. Gypsum scaling and
membrane integrity of osmotically driven membranes: the effect of membrane mate-
rials and operating conditions. Desalination 2016;377:1–10.
[86] Wang YN, Tang CY. Fouling of nanofiltration, reverse osmosis and ultrafiltration mem-
branes by protein mixtures: the role of inter-foulant-species interaction. Environ Sci
Technol 2011;45(15):6373–9. [Epub 2011 Jul 5].
[87] Antony A, Low JH, Gray S, Childress AE, Le-Clech P, Leslie G. Scale formation and
control in high pressure membrane water treatment systems: a review. J Membr Sci
2011;383(1–2):1–16.
[88] Stumm W, Morgan J. Aquatic chemistry: chemical equilibria and rates in natural
waters. 3rd ed. New York: Wiley-Interscience; 1996. 1040 p.
[89] Wang YN, Li X, Wang R. Silica scaling and scaling control in pressure retarded osmosis
processes. J Membr Sci 2017;541:73–84.
[90] Ang WS, Elimelech M. Protein (BSA) fouling of reverse osmosis membranes: implica-
tions for wastewater reclamation. J Membr Sci 2007;296(1–2):83–92.
[91] Tang CY, Kwon YN, Leckie JO. Fouling of reverse osmosis and nanofiltration mem-
branes by humic acid—effects of solution composition and hydrodynamic conditions.
J Membr Sci 2007;290(1–2):86–94.
43
REFERENCES](https://image.slidesharecdn.com/wang2019-250518085119-1d7dee3c/85/wang201fdfdddddddddddddddddddddddddddddddddddddd9-pdf-43-320.jpg)
![[92] Zhu X, Elimelech M. Colloidal fouling of reverse osmosis membranes: measurements
and fouling mechanisms. Environ Sci Technol 1997;31(12):3654–62.
[93] Gao Y, Haavisto S, Li W, Tang CY, Salmela J, Fane AG. Novel approach to character-
izing the growth of a fouling layer during membrane filtration via optical coherence
tomography. Environ Sci Technol 2014;48(24):14273–81.
[94] Jiang S, Li Y, Ladewig BP. A review of reverse osmosis membrane fouling and control
strategies. Sci Total Environ 2017;595:567–83.
[95] Sohn J, Valavala R, Han J, Her N, Yoon Y. Pretreatment in reverse osmosis seawater
desalination: a short review. Environ Eng Res 2011;16(4):205–12.
[96] Wenten IG, Khoiruddin. Reverse osmosis applications: prospect and challenges.
Desalination 2016;391:112–25.
[97] Greenlee LF, Lawler DF, Freeman BD, Marrot B, Moulin P. Reverse osmosis desalina-
tion: water sources, technology, and today’s challenges. Water Res 2009;43(9):2317–48.
[98] Shenvi SS, Isloor AM, Ismail AF. A review on RO membrane technology: developments
and challenges. Desalination 2015;368:10–26.
[99] C^
ot
e P, Liu M, Siverns S. Water reclamation and desalination by membranes.
In: Advanced membrane technology and applications. Wiley; 2008. p. 171–87.
[100] Wang B, Guo X, Bai P. Removal technology of boron dissolved in aqueous solutions—a
review. Colloids Surf A Physicochem Eng Asp 2014;444:338–44.
[101] Jamaly S, Darwish NN, Ahmed I, Hasan SW. A short review on reverse osmosis pre-
treatment technologies. Desalination 2014;354:30–8.
[102] P
erez-González A, Urtiaga AM, Ibáñez R, Ortiz I. State of the art and review on the
treatment technologies of water reverse osmosis concentrates. Water Res 2012;
46(2):267–83.
[103] Peters TA. Purification of landfill leachate with reverse osmosis and nanofiltration.
Desalination 1998;119(1):289–93.
[104] Chai X, Chen G, Yue PL, Mi Y. Pilot scale membrane separation of electroplating waste
water by reverse osmosis. J Membr Sci 1997;123(2):235–42.
[105] Vourch M, Balannec B, Chaufer B, Dorange G. Treatment of dairy industry wastewater
by reverse osmosis for water reuse. Desalination 2008;219(1):190–202.
[106] Coskun T, Debik E, Demir NM. Treatment of olive mill wastewaters by nanofiltration
and reverse osmosis membranes. Desalination 2010;259(1):65–70.
[107] De Jager D, Sheldon MS, Edwards W. Colour removal from textile wastewater using a
pilot-scale dual-stage MBR and subsequent RO system. Sep Purif Technol
2014;135:135–44.
[108] Rautenbach R, Vossenkaul K, Linn T, Katz T. Waste water treatment by membrane
processes—new development in ultrafiltration, nanofiltration and reverse osmosis.
Desalination 1997;108(1):247–53.
[109] Alvarez V, Alvarez S, Riera FA, Alvarez R. Permeate flux prediction in apple juice con-
centration by reverse osmosis. J Membr Sci 1997;127(1):25–34.
[110] Pap N, Kert
esz S, Pongrácz E, Myllykoski L, Keiski RL, Vatai G, et al. Concentration of
blackcurrant juice by reverse osmosis. Desalination 2009;241(1):256–64.
[111] Jesus DF, Leite MF, Silva LFM, Modesta RD, Matta VM, Cabral LMC. Orange (Citrus
sinensis) juice concentration by reverse osmosis. J Food Eng 2007;81(2):287–91.
[112] Gurak PD, Cabral LMC, Rocha-Leão MHM, Matta VM, Freitas SP. Quality evaluation
of grape juice concentrated by reverse osmosis. J Food Eng 2010;96(3):421–6.
[113] Echavarrı́a AP, Falguera V, Torras C, Berdún C, Pagán J, Ibarz A. Ultrafiltration and
reverse osmosis for clarification and concentration of fruit juices at pilot plant scale.
LWT-Food Sci Technol 2012;46(1):189–95.
[114] Pilipovik MV, Riverol C. Assessing dealcoholization systems based on reverse osmosis.
J Food Eng 2005;69(4):437–41.
44 1. REVERSE OSMOSIS MEMBRANE SEPARATION TECHNOLOGY](https://image.slidesharecdn.com/wang2019-250518085119-1d7dee3c/85/wang201fdfdddddddddddddddddddddddddddddddddddddd9-pdf-44-320.jpg)
![[115] Catarino M, Mendes A, Madeira LM, Ferreira A. Alcohol removal from beer by reverse
osmosis. Sep Sci Technol 2007;42(13):3011–27.
[116] Catarino M, Mendes A. Dealcoholizing wine by membrane separation processes. Inno-
vative Food Sci Emerg Technol 2011;12(3):330–7.
[117] Peinemann KV, Nunes SP, Giorno L. Membrane technology, volume 3: membranes for
food applications. Wiley; 2010.
[118] López M, Alvarez S, Riera FA, Alvarez R. Production of low alcohol content apple cider
by reverse osmosis. Ind Eng Chem Res 2002;41(25):6600–6.
[119] White LS, Nitsch AR. Solvent recovery from lube oil filtrates with a polyimide mem-
brane. J Membr Sci 2000;179(1):267–74.
[120] Vandezande P, Gevers LEM, Vankelecom IFJ. Solvent resistant nanofiltration: separat-
ing on a molecular level. Chem Soc Rev 2008;37(2):365–405.
Further Reading
[121] Weng X, Ji Y, Zhao F, An Q, Gao C. Tailoring the structure of polyamide thin film com-
posite membrane with zwitterions to achieve high water permeability and antifouling
property. RSC Adv 2015;5(120):98730–9.
[122] kobelco-eco.co. Available from: http://www.kobelco-eco.co.jp/english/product/dt_
module/genri.html.
45
REFERENCES](https://image.slidesharecdn.com/wang2019-250518085119-1d7dee3c/85/wang201fdfdddddddddddddddddddddddddddddddddddddd9-pdf-45-320.jpg)


