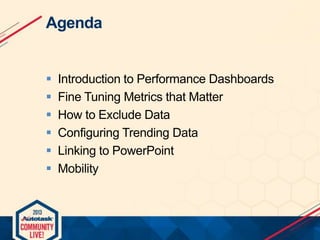
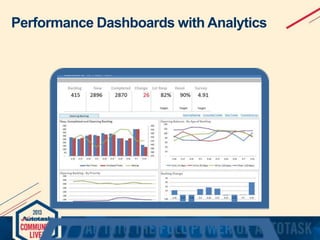
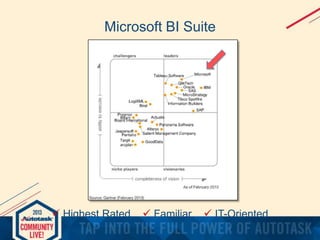
Metrics that Matter: Autotask Performance
Dashboards
Tom Teta
Manager of Services - International
Tom Teta
Manager of Services - International

 Managing International Sales Engineering and Implementation
 6.5 years at Autotask with Sales Engineering and Client
Services
Agenda








Introduction to Performance Dashboards
Fine Tuning Metrics that Matter
How to Exclude Data
Configuring Trending Data
Linking to PowerPoint
Mobility
Introduction to Performance Dashboards
Performance Dashboards with Analytics

with Analytics
Microsoft BI Suite

 Highest Rated

 Familiar

 IT-Oriented
Performance Dashboards Demo
Agenda

 Introduction to Performance Dashboards
 Fine Tuning Metrics that Matter
Fine Tuning Metrics that Matter
This Week

2 Wks Ago

5/12/2013

Opening Balance
Backlog Over 30 days
Tickets Opened
Tickets Completed
Added to Backlog
% of First Response Met
Avg Elapsed Time to Respond
% of Resolution Met
Avg Elapsed Time to Resolve
Avg Survey Score

Last Week
5/5/2013

4/28/2013

428
108
556
534
22
99%
1.0
83%
5.7
4.6

300
100
599
471
128
97%
1.3
80%
5.2
4.7

220
96
589
509
80
98%
0.9
85%
6.1
4.5

10 Week
Trend

10 Week Target
Met Plan
< 220
< 110
< 600
> 400
< 100
> 0.9
< 1.5
> 0.8
<6
> 4.5
Agenda

 Introduction to Performance Dashboards
 Fine Tuning Metrics that Matter
 How to Exclude Data
How to Exclude Data
 Our Service workbooks include all active tickets
in the last 10 weeks….

You may want to exclude tickets not
related to the help desk: queues of
recurring tickets, ticket type of sales, etc
How to Exclude Data with Advanced Where Clause
Agenda






Introduction to Performance Dashboards
Fine Tuning Metrics that Matter
How to Exclude Data
Configuring Trending Data
Configurable: Ways to Filter Tickets
Configuring your Trending Data
Agenda







Introduction to Performance Dashboards
Fine Tuning Metrics that Matter
How to Exclude Data
Configuring Trending Data
Linking to PowerPoint

This Week

Opening Balance
Backlog Over 30 days
Tickets Opened
Tickets Completed
Added to Backlog
% of First Response Met
Avg Elapsed Time to Respond
% of Resolution Met
Avg Elapsed Time to Resolve
Avg Survey Score

Last Week

2 Wks Ago

5/12/2013

5/5/2013

4/28/2013

428
108
556
534
22
99%
1.0
83%
5.7
4.6

300
100
599
471
128
97%
1.3
80%
5.2
4.7

220
96
589
509
80
98%
0.9
85%
6.1
4.5

10 Week
Trend

10 Week Target
Met Plan
< 220
< 110
< 600
> 400
< 100
> 0.9
< 1.5
> 0.8
<6
> 4.5
Agenda








Introduction to Performance Dashboards
Fine Tuning Metrics that Matter
How to Exclude Data
Configuring Trending Data
Linking to PowerPoint
Mobility
Mobility
 Access workbooks from your tablet
 Workbooks on Skydrive, Sharepoint or Office 365 are
accessible via Excel Web App
Sales
Service Desk
Client Facing Service Report
Finance
Projects

Metrics that Matter: New Autotask Performance Dashboards