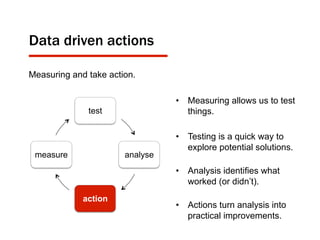
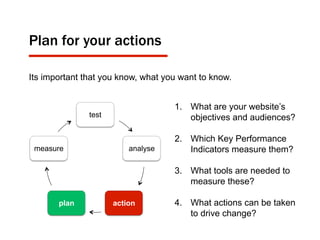
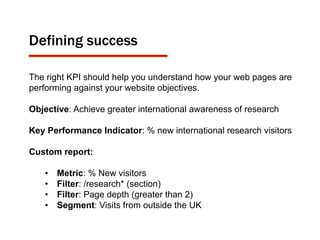
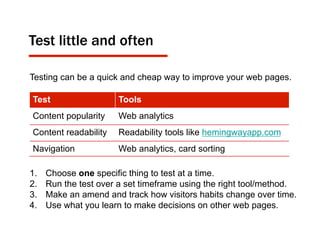
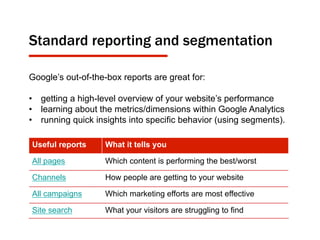
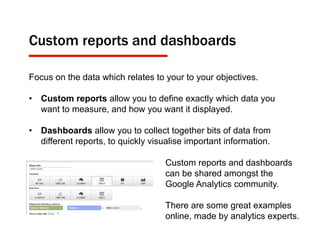
Web Analytics
Core principles
James Hourihan
Web Producer
•  Why web analytics are important
•  How to approach web analytics
•  What reports you should use (and why)
This presentation will cover
Why
web analytics are important
Improving visitor experience
How can you respond to something you don’t know about?
Google Analytics in real life: Site search
Data driven actions
test
analyse
action
measure
Measuring and take action.
•  Measuring allows us to test
things.
•  Testing is a quick way to
explore potential solutions.
•  Analysis identifies what
worked (or didn’t).
•  Actions turn analysis into
practical improvements.
Analytics are available
Do you measure and more importantly, is it helping?
Reporting vs analysis
Reporting just gives you numbers and more questions.
Analysis gives you the insight.
How
you should approach web analytics
Not everything that can be counted counts, and
not everything that counts can be counted.”
Albert Einstein, Physicist
Plan for your actions
1.  What are your website’s
objectives and audiences?
2.  Which Key Performance
Indicators measure them?
3.  What tools are needed to
measure these?
4.  What actions can be taken
to drive change?
test
analyse
actionplan
measure
Its important that you know, what you want to know.
Choosing the right KPIs
A key performance indicator is a metric that helps you understand
actual performance against your business objectives.
Metric What’s measured
Session The number of active users on your site
Page view The number of times a page is viewed
Time on page The average amount of time spent viewing a
page
Bounce rate How frequently visitors exit the site from the
page they land on
Entrances How often visitors enter from a specific page
Defining success
The right KPI should help you understand how your web pages are
performing against your website objectives.
Objective: Achieve greater international awareness of research
Key Performance Indicator: % new international research visitors
Custom report:
•  Metric: % New visitors
•  Filter: /research* (section)
•  Filter: Page depth (greater than 2)
•  Segment: Visits from outside the UK
Test little and often
Testing can be a quick and cheap way to improve your web pages.
1.  Choose one specific thing to test at a time.
2.  Run the test over a set timeframe using the right tool/method.
3.  Make an amend and track how visitors habits change over time.
4.  Use what you learn to make decisions on other web pages.
Test Tools
Content popularity Web analytics
Content readability Readability tools like hemingwayapp.com
Navigation Web analytics, card sorting
What
reports you should use?
“We have so much data on the web,
almost all of it available for free,
that we dive into the data ocean hoping that
magically awesome things will follow.”
Avinash Kaushik, Web Analytics Evangelist
Standard reporting and segmentation
Useful reports What it tells you
All pages Which content is performing the best/worst
Channels How people are getting to your website
All campaigns Which marketing efforts are most effective
Site search What your visitors are struggling to find
Google’s out-of-the-box reports are great for:
•  getting a high-level overview of your website’s performance
•  learning about the metrics/dimensions within Google Analytics
•  running quick insights into specific behavior (using segments).
Custom reports and dashboards
Focus on the data which relates to your to your objectives.
•  Custom reports allow you to define exactly which data you
want to measure, and how you want it displayed.
•  Dashboards allow you to collect together bits of data from
different reports, to quickly visualise important information.
Custom reports and dashboards
can be shared amongst the
Google Analytics community.
There are some great examples
online, made by analytics experts.
Events and goals
Track the things that are important to you.
•  Events allow you track additional interactions that a user may
make, such as watching a video or clicking a button.
•  Goals allow you to define successful actions and measure how
often visitors complete them, such as joining a mailing list.
Intelligence and alerts
Keeping a watchful eye on the general performance of your site.
• Intelligence events can be set up to automatically monitor
variations of important metrics on your website.
• Alerts allow you to set a threshold for your intelligence events, so
you can be notified if a certain trend drops or rises dramatically.
Add annotations
to your timeline, to
keep a record of
important events.
•  Be objective about the things you want to find out.
•  Set up custom reports and dashboards so you can easily
access this data.
•  Use intelligence events to keep an eye on variations in
data/trends.
•  Ensure your analysis gives you data driven actions.
Time saving tips
Get inspired
kaushik.net
cutroni.com
blog.kissmetrics.com
Get the knowledge
analyticsacademy.withgoogle.com
youtube.com/user/googleanalytics
google.com/analytics/gallery
Get support
web@cardiff.ac.uk
Getting into Google Analytics
This is the last slide
Questions?

Web analytics core principles

  • 1.
  • 2.
    •  Why webanalytics are important •  How to approach web analytics •  What reports you should use (and why) This presentation will cover
  • 3.
  • 4.
    Improving visitor experience Howcan you respond to something you don’t know about? Google Analytics in real life: Site search
  • 5.
    Data driven actions test analyse action measure Measuringand take action. •  Measuring allows us to test things. •  Testing is a quick way to explore potential solutions. •  Analysis identifies what worked (or didn’t). •  Actions turn analysis into practical improvements.
  • 6.
    Analytics are available Doyou measure and more importantly, is it helping?
  • 7.
    Reporting vs analysis Reportingjust gives you numbers and more questions. Analysis gives you the insight.
  • 8.
  • 9.
    Not everything thatcan be counted counts, and not everything that counts can be counted.” Albert Einstein, Physicist
  • 10.
    Plan for youractions 1.  What are your website’s objectives and audiences? 2.  Which Key Performance Indicators measure them? 3.  What tools are needed to measure these? 4.  What actions can be taken to drive change? test analyse actionplan measure Its important that you know, what you want to know.
  • 11.
    Choosing the rightKPIs A key performance indicator is a metric that helps you understand actual performance against your business objectives. Metric What’s measured Session The number of active users on your site Page view The number of times a page is viewed Time on page The average amount of time spent viewing a page Bounce rate How frequently visitors exit the site from the page they land on Entrances How often visitors enter from a specific page
  • 12.
    Defining success The rightKPI should help you understand how your web pages are performing against your website objectives. Objective: Achieve greater international awareness of research Key Performance Indicator: % new international research visitors Custom report: •  Metric: % New visitors •  Filter: /research* (section) •  Filter: Page depth (greater than 2) •  Segment: Visits from outside the UK
  • 13.
    Test little andoften Testing can be a quick and cheap way to improve your web pages. 1.  Choose one specific thing to test at a time. 2.  Run the test over a set timeframe using the right tool/method. 3.  Make an amend and track how visitors habits change over time. 4.  Use what you learn to make decisions on other web pages. Test Tools Content popularity Web analytics Content readability Readability tools like hemingwayapp.com Navigation Web analytics, card sorting
  • 14.
  • 15.
    “We have somuch data on the web, almost all of it available for free, that we dive into the data ocean hoping that magically awesome things will follow.” Avinash Kaushik, Web Analytics Evangelist
  • 16.
    Standard reporting andsegmentation Useful reports What it tells you All pages Which content is performing the best/worst Channels How people are getting to your website All campaigns Which marketing efforts are most effective Site search What your visitors are struggling to find Google’s out-of-the-box reports are great for: •  getting a high-level overview of your website’s performance •  learning about the metrics/dimensions within Google Analytics •  running quick insights into specific behavior (using segments).
  • 17.
    Custom reports anddashboards Focus on the data which relates to your to your objectives. •  Custom reports allow you to define exactly which data you want to measure, and how you want it displayed. •  Dashboards allow you to collect together bits of data from different reports, to quickly visualise important information. Custom reports and dashboards can be shared amongst the Google Analytics community. There are some great examples online, made by analytics experts.
  • 18.
    Events and goals Trackthe things that are important to you. •  Events allow you track additional interactions that a user may make, such as watching a video or clicking a button. •  Goals allow you to define successful actions and measure how often visitors complete them, such as joining a mailing list.
  • 19.
    Intelligence and alerts Keepinga watchful eye on the general performance of your site. • Intelligence events can be set up to automatically monitor variations of important metrics on your website. • Alerts allow you to set a threshold for your intelligence events, so you can be notified if a certain trend drops or rises dramatically. Add annotations to your timeline, to keep a record of important events.
  • 20.
    •  Be objectiveabout the things you want to find out. •  Set up custom reports and dashboards so you can easily access this data. •  Use intelligence events to keep an eye on variations in data/trends. •  Ensure your analysis gives you data driven actions. Time saving tips
  • 21.
    Get inspired kaushik.net cutroni.com blog.kissmetrics.com Get theknowledge analyticsacademy.withgoogle.com youtube.com/user/googleanalytics google.com/analytics/gallery Get support web@cardiff.ac.uk Getting into Google Analytics
  • 22.
    This is thelast slide Questions?