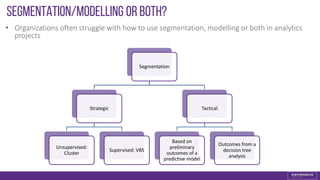
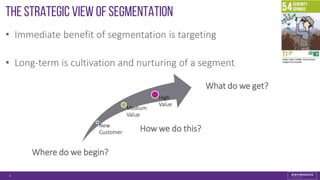
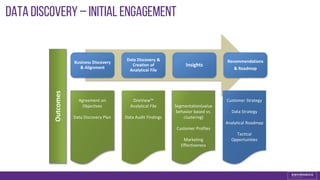
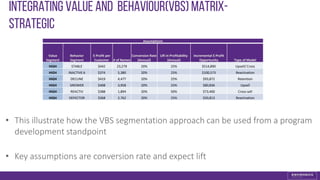
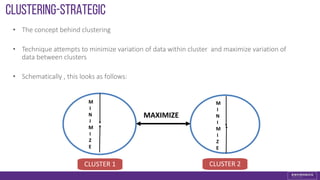
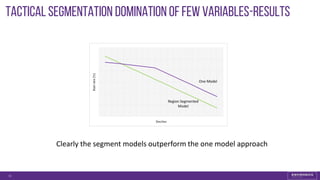
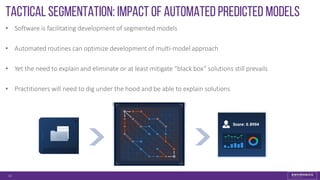
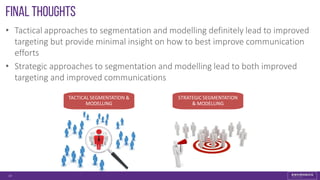
This document discusses strategies for integrating segmentation and predictive modeling. It begins by outlining a typical agenda, including whether to use segmentation, modeling, or both. It then covers strategic approaches like value-based behavioral segmentation and clustering to define customer segments. Tactical segmentation involves using outcomes from predictive models to segment customers. The document provides examples of integrating segmentation with different modeling techniques and discusses how segmented models can outperform single models. It emphasizes that both strategic and tactical approaches are useful but strategic provides more insights for improving communications.
- Why customer analytics is complex now?
- One metric answers all the question
- Predictive customer lifetime value prediction
- Campaign analytics and DiD methods
IBM Healthcare Business Analytics solutions including Cognos, TM1 and SPSS. How healthcare challenges are met and costs are optimized through the use of Data Visualizations, Performance Management, and Predictive Analytics.
Business analytics in healthcare & life scienceSanjay Choubey
Business analytics for Healthcare, Life Science businesses. Trends, Issues, Challenges, process & steps, Business drivers, Market & compliance, Big data and approach to overcome
The Business Analytics Value PropositionEric Stephens
Presentation made to the Nashville Technology Council Analytics Peer Network meeting on May 30, 2013. Discussion of the impact of analytics to an organization, along with use cases that can help convey the value of the practice to executives and other managers.
Predictive analytics are increasingly a must-have competitive tool. A well-defined workflow and effective decision modeling approach ensures that the right predictive analytic models get built and deployed.
Predictive analytics and models explained, how to develop them and how to apply them within a customer management framework to create measurable ROI. View the webinar video recording and download this deck: http://www.senturus.com/resources/predictive-analytics-demystified/.
Senturus, a business analytics consulting firm, has a resource library with hundreds of free recorded webinars, trainings, demos and unbiased product reviews. Take a look and share them with your colleagues and friends: http://www.senturus.com/resources/.
In the field of business and management, data science is transforming how companies organize, operate, manage talent, and create value. In this talk, David will share his experience as a data scientist and consultant on data science in business – from business experimentation to planning process optimization. He will also reflect on the career progress as a data scientist and provide suggestions to young data scientists
Data Analytics 201: Adding Value with Modeling TechniquesNICSA
Take a deeper dive into Data Analytics and better understand what it takes to develop useful algorithms.
This webinar will cover demonstrated use cases and applications for three different data analysis approaches. Panelists will discuss different customer segmentation approaches, as well as the development of scoring models. Participants will benefit from engaging discussion surrounding the value of analytics, incremental data acquisition, and the development of simple modeling techniques that can help financial firms succeed.
Rapid Optimization Application Development Using Excel and SolverMichael Mina
Marketing optimization is the process of determining how to allocate marketing dollars in order to achieve specific goals (e.g., maximize profit), subject to certain constraints (e.g., a fixed marketing budget). This often takes the form of using mathematical techniques to determine who to target, through which channel, and with what message or offer.
A number of optimization applications are commercially available. However, many of them require changes to data and computational infrastructure that are labor-intensive and cost-prohibitive. This presentation will demonstrate how optimization applications can be developed easily and quickly using Excel combined with Excel Solver, even for large marketing campaigns.
This presentation will discuss how segmentation can be used to reduce the complexity of large optimization problems, and how to quickly develop a simple but effective optimization application using Excel combined with Excel Solver.
This presentation will be of interest to those seeking to optimize marketing campaigns of any size while managing operational and computational complexity.
An electronic copy of the Excel worksheet used for optimization is this presentation is available at tinyurl.com/mina2018artforum.
Presentation at annual IASA Conference on optimizing insurance operations with case study participation from Nick Intrieri of AXA Equitable and Thomas Noh of Farmers Insurance.
This document proposes advanced data analytics as the key solution for building intimate knowledge about our customers’ behaviour, preferences and aspirations; an essential requirement for maximizing revenue in our current competitive environment.
Game Changing Quality Strategies that Drive Organizational Excellencekushshah
Quality in the past was more related conforming to requirements, in lot of cases as it relates to engineering requirements and not necessarily enthusiastic customer experience. It was a very narrow definition of quality and focused more on Things Gone Wrong. Goal was to reach a level of customer accepted.
Quality definition today is much broader and winning in quality in this highly competitive environment requires deployment game changing quality strategies.
We will discuss how to infuse the voice of the customer into the way we design our products and services so that they exceed customer expectations. Organizations that engage all functions within enterprise and are customer centric will differentiate themselves from the rest of the competition. This presentation will provide an integrated roadmap on how to integrate proactive quality strategies such as Design for Six Sigma (DFSS), Advanced Product Quality Planning (APQP), Design Failure Modes and Effects Analysis (DFMEA), Process Failure Modes and Effects Analysis (PFMEA) along with reactive strategies such as Six Sigma and control plans to achieve organizational excellence.
In this prescriptive breakout session learn what successful Solution Providers are doing to build their Cloud/Mobility business. This workshop is designed for Solution Provider new to cloud/mobility marketplace or have not yet seen success. Success in the new marketplace starts with a Practice Statement, entails new ideas on building marketing savvy and better sales execution. We will cover a variety of tools, tips and techniques partners are using to drive Cloud /Mobility success.
Topics:
• Why you need to create a Practice Statement
• Aligning your marketing message to fit your Cloud strategy
• Building your Cloud marketing program that is unique and is active
• Creating a sales mentality and compensation program that works
• Developing a Business Guidance sales mentality
http://www.ingrammicrocloud.com
Budgets, Boardrooms and Branch Optimization_ Backed-by-Science Strategies for...Emily Sweillam
Wondering how you can win in the boardroom and secure budget for branch optimization projects in 2017? Curious to see how your peers are doing in their efforts? Want research-based advice on what strategies, designs, and technologies best align to where the branch is headed?
Whether you’re already testing concepts or just starting to gather information for developing a game plan, this is a must-watch webinar for anyone who has branch transformation plans for 2017. Featuring Bob Meara, a senior analyst with Celent’s Branch Transformation research team, and John W. Smith, CEO of DBSI, you’ll hear the latest industry research on branch optimization strategies.
Organization and Management Guide,Chapter 8 Strategic Management by Stephen Robbins and Mary Coulter Management Book 12th Edition, Pearson Publication.
Show drafts
volume_up
Empowering the Data Analytics Ecosystem: A Laser Focus on Value
The data analytics ecosystem thrives when every component functions at its peak, unlocking the true potential of data. Here's a laser focus on key areas for an empowered ecosystem:
1. Democratize Access, Not Data:
Granular Access Controls: Provide users with self-service tools tailored to their specific needs, preventing data overload and misuse.
Data Catalogs: Implement robust data catalogs for easy discovery and understanding of available data sources.
2. Foster Collaboration with Clear Roles:
Data Mesh Architecture: Break down data silos by creating a distributed data ownership model with clear ownership and responsibilities.
Collaborative Workspaces: Utilize interactive platforms where data scientists, analysts, and domain experts can work seamlessly together.
3. Leverage Advanced Analytics Strategically:
AI-powered Automation: Automate repetitive tasks like data cleaning and feature engineering, freeing up data talent for higher-level analysis.
Right-Tool Selection: Strategically choose the most effective advanced analytics techniques (e.g., AI, ML) based on specific business problems.
4. Prioritize Data Quality with Automation:
Automated Data Validation: Implement automated data quality checks to identify and rectify errors at the source, minimizing downstream issues.
Data Lineage Tracking: Track the flow of data throughout the ecosystem, ensuring transparency and facilitating root cause analysis for errors.
5. Cultivate a Data-Driven Mindset:
Metrics-Driven Performance Management: Align KPIs and performance metrics with data-driven insights to ensure actionable decision making.
Data Storytelling Workshops: Equip stakeholders with the skills to translate complex data findings into compelling narratives that drive action.
Benefits of a Precise Ecosystem:
Sharpened Focus: Precise access and clear roles ensure everyone works with the most relevant data, maximizing efficiency.
Actionable Insights: Strategic analytics and automated quality checks lead to more reliable and actionable data insights.
Continuous Improvement: Data-driven performance management fosters a culture of learning and continuous improvement.
Sustainable Growth: Empowered by data, organizations can make informed decisions to drive sustainable growth and innovation.
By focusing on these precise actions, organizations can create an empowered data analytics ecosystem that delivers real value by driving data-driven decisions and maximizing the return on their data investment.
Chatty Kathy - UNC Bootcamp Final Project Presentation - Final Version - 5.23...John Andrews
SlideShare Description for "Chatty Kathy - UNC Bootcamp Final Project Presentation"
Title: Chatty Kathy: Enhancing Physical Activity Among Older Adults
Description:
Discover how Chatty Kathy, an innovative project developed at the UNC Bootcamp, aims to tackle the challenge of low physical activity among older adults. Our AI-driven solution uses peer interaction to boost and sustain exercise levels, significantly improving health outcomes. This presentation covers our problem statement, the rationale behind Chatty Kathy, synthetic data and persona creation, model performance metrics, a visual demonstration of the project, and potential future developments. Join us for an insightful Q&A session to explore the potential of this groundbreaking project.
Project Team: Jay Requarth, Jana Avery, John Andrews, Dr. Dick Davis II, Nee Buntoum, Nam Yeongjin & Mat Nicholas
Data Centers - Striving Within A Narrow Range - Research Report - MCG - May 2...pchutichetpong
M Capital Group (“MCG”) expects to see demand and the changing evolution of supply, facilitated through institutional investment rotation out of offices and into work from home (“WFH”), while the ever-expanding need for data storage as global internet usage expands, with experts predicting 5.3 billion users by 2023. These market factors will be underpinned by technological changes, such as progressing cloud services and edge sites, allowing the industry to see strong expected annual growth of 13% over the next 4 years.
Whilst competitive headwinds remain, represented through the recent second bankruptcy filing of Sungard, which blames “COVID-19 and other macroeconomic trends including delayed customer spending decisions, insourcing and reductions in IT spending, energy inflation and reduction in demand for certain services”, the industry has seen key adjustments, where MCG believes that engineering cost management and technological innovation will be paramount to success.
MCG reports that the more favorable market conditions expected over the next few years, helped by the winding down of pandemic restrictions and a hybrid working environment will be driving market momentum forward. The continuous injection of capital by alternative investment firms, as well as the growing infrastructural investment from cloud service providers and social media companies, whose revenues are expected to grow over 3.6x larger by value in 2026, will likely help propel center provision and innovation. These factors paint a promising picture for the industry players that offset rising input costs and adapt to new technologies.
According to M Capital Group: “Specifically, the long-term cost-saving opportunities available from the rise of remote managing will likely aid value growth for the industry. Through margin optimization and further availability of capital for reinvestment, strong players will maintain their competitive foothold, while weaker players exit the market to balance supply and demand.”
Explore our comprehensive data analysis project presentation on predicting product ad campaign performance. Learn how data-driven insights can optimize your marketing strategies and enhance campaign effectiveness. Perfect for professionals and students looking to understand the power of data analysis in advertising. for more details visit: https://bostoninstituteofanalytics.org/data-science-and-artificial-intelligence/
2. AGENDA AND CONCEPTS
2
• Segmentation/Modelling or both?
• The strategic view of segmentation
• Data Discovery- Initial engagement
• Value Based Behaviour- Strategic
• Clustering-Strategic
• Tactical Segmentation
• The impact of automated predictive models
• Final thoughts
4. The strategic View of Segmentation
• Immediate benefit of segmentation is targeting
• Long-term is cultivation and nurturing of a segment
4
New
Customer
Medium
Value
High
Value
How we do this?
Where do we begin?
What do we get?
5. Data Discovery – Initial Engagement
Agreement on
Objectives
Data Discovery Plan
OneView™
Analytical File
Data Audit Findings
Segmentation(value
behavior based vs.
clustering)
Customer Profiles
Marketing
Effectiveness
Customer Strategy
Data Strategy
Analytical Roadmap
Tactical
Opportunities
Outcomes
6. Value-behaviour based(VBS)-Strategic
• First define value
– Profits determine the value for each segment in the example below:
6
Decile Value Segment # of Customers Avg. Profit
1 High 22,317 $592
2 High 22,317 $248
3 Medium 22,317 $156
4 Medium 22,317 $107
5 Medium 22,317 $69
6 Medium 22,317 $39
7 Low 22,317 $16
8 Low 22,317 $2
9 Low 22,317 $0
10 Low 22,317 -$11
Total 223,170 $122
Who are the most
valuable?
7. • Notion here is to encapsulate longitudinal behavior of customer
• Segmenting customers based on changing behavior (i.e. how does value
change overtime)
Behavioural – Based Segmentation-Strategic
PRE PERIOD POST PERIOD
JAN-JUN 2016 JUL- AUG 2016
REACTIVATORS
DEFECTORS
No activity Activity
Activity No Activity
8. VBS
8
STABLESDECLINERS GROWERS
• Growers, stables, and decliners identifies those
individuals whose behavior is close to the
mean(stables), behaviour is well under the
mean(decliners:-2SD) and behavior is well above the
mean(growers:+2SD)
9. Example of Behavioural Segment creation- Growers,Decliners,
Stables-Strategic
• One Bank: 94,080 customers were active in the both the current and previous 3
month periods
– We looked at some diagnostics around this group particularly how the % change numbers varied (i.e. standard deviation)
– Mean % change for entire segment (active in current 3 months and active in previous 3 months) is 0.2%
– Standard deviation is 44%
Decile # of Customers % Change Behaviour Segment
# of Statistical
Standard deviations
1 9,408 154% Growers
> 2 STD
2 9,408 97% Growers
3 9,408 60% Stables
Within 2 STD
4 9,408 33% Stables
5 9,408 10% Stables
6 9,408 -9% Stables
7 9,408 -32% Stables
8 9,408 -60% Stables
9 9,408 -99% Decliners
> 2 STD
10 9,408 -155% Decliners
10. Integrating Value and Behaviour(VBS) Matrix-
Strategic
• This illustrate how the VBS segmentation approach can be used from a program
development standpoint
• Key assumptions are conversion rate and expect lift
Assumptions
Value
Segment
Behavior
Segment
$ Profit per
Customer # of Names
Conversion Rate
(Annual)
Lift in Profitability
(Annual)
Incremental $ Profit
Opportunity Type of Model
HIGH STABLE $442 23,279 20% 25% $514,890 Upsell/ Cross
HIGH INACTIVE 6 $374 5,380 20% 25% $100,573 Reactivation
HIGH DECLINE $419 4,477 20% 25% $93,872 Retention
HIGH GROWER $408 3,958 20% 25% $80,836 Upsell
HIGH REACTIV $388 1,894 20% 50% $73,400 Cross-sell
HIGH DEFECTOR $368 2,762 20% 25% $50,813 Reactivation
11. Case Study – Wealth Management company
• Small investment company for high net worth individuals
• Key imperative: reduce attrition of high value investors
• First challenge: define attrition
– Customers who redeemed all funds in their portfolio in the last
year
– Look at the customer behaviour prior to redemption
• Second challenge: define high value
11
Value Segment # of Investors
% of All Assets in
Portfolio
1 2506 30.28%
2 2506 21.52%
3 2506 15.84%
4 2506 11.60%
5 2506 8.35%
6 2506 5.80%
7 2506 3.71%
8 2506 2.07%
9 2506 0.77%
10 2506 0.06%
BEHAVIOUR PRIOR
TOREDEMPTION
CUSTOMERS WHO REDEEMED
ALL FUNDS IN PORTFOLIO
POST
(12 months)
High
value
group
Net worth HighValue: $283K
Net worth LOW Value: $59K
PRE
12. Integration of Defectionmodel to highvalue clients Case Study – Wealth
Managementcompany
12
Creating
the
analytical
file
(12 MONTHS)
13. Wealth Management company
• Defection model was deployed to high value customers as a trigger
tool for sales advisors
13
0.00%
5.00%
10.00%
15.00%
20.00%
25.00%
30.00%
1 2 3 4 5 6 7 8 9 10
DefectionRate
Model Deciles
Decile Defection Rate Results of Model
Model was deployed to trigger high risk high value clients to salespeople.
14. • The concept behind clustering
• Technique attempts to minimize variation of data within cluster and maximize variation of
data between clusters
• Schematically , this looks as follows:
MAXIMIZE
M
I
N
I
M
I
Z
E
M
I
N
I
M
I
Z
E
Clustering-strategic
CLUSTER 1 CLUSTER 2
15. Clustering-strategic-FACTOR ANALYSIS
• What are key analytical tasks that need to be undertaken here vs.
building predictive models?
– Need to reduce hundreds of variables to manageable number(40-50)
– Use factor analysis as key data reduction tool
15
16. Let’s take a look at an example
• The following list of variables are used in a factor analysis
– Income
– Education
– Wealth
– Product A
– Product B
– Product C
– Product D
– Product E
– Product F
Factor 1 Factor 2 Factor 3
Eigenvalue 3.4 2.2 1
% of Explained Variation 53% 35% 12%
FACTOR
ANALYSIS FOR
DATA
REDUCTION
Clustering-strategic-FACTOR ANALYSIS
17. • Factor Loading Results for Variables within Each Factor
Clustering-strategic-FACTOR ANALYSIS
Variable Factor 1 Factor 2 Factor 3
Income 0.905 0.255 0.255
Education 0.855 0.373 0.212
Wealth 0.956 0.303 0.185
Product A 0.303 0.855 0.205
Product B 0.295 0.805 0.245
Product C 0.323 0.755 0.285
Product D -0.105 -0.355 0.755
Product E -0.155 -0.405 0.705
Product F -0.085 -0.304 0.725
18. Clustering-strategic-STANDARDIZATION
• What are key analytical tasks that need to be undertaken here vs.
building predictive models?
– Need to scale or standardize all variables
– Let’s see what this looks like
18
Customer Record Income Mean Income
Mean Difference in
Income
Age Average Age
Mean Difference in
Age
1 $ 25,000 $ 55,000 $ 30,000 25 41 16
2 $ 60,000 $ 55,000 $ 5,000 45 41 4
3 $ 20,000 $ 55,000 $ 35,000 55 41 14
4 $ 57,000 $ 55,000 $ 2,000 30 41 11
5 $ 45,000 $ 55,000 $ 10,000 35 41 6
Average difference $ 16,400 10.2
21. Explained
Variation
1 2 3 4 5
Number of Clusters
X
Explained Variance Curve
Clustering-strategic
using the elbowtheory to determine optimum # of clusters
A number of diagnostics can be used to estimate explained variation- cubic clustering
criterion and/or Pseudo-F static
22. 22
Clustering-strategic
• Multitude of techniques and options within techniques can be employed
– Fast Clustering-K Means Clustering
– Hierarchical Clustering
• What does it practically mean?
Below example looks at 6 cluster solution from another wealth management client. See below results of Cluster
One
23. 23
Clustering-strategic
HIGH LEVEL OF RISK TOLERANCE UNENGAGED
HIGH CANADIAN GROWTH FUNDPORTFOLIO MIX
TODD, CLUSTER 1
32 years
$ 70,000
Male
Downtown, MTL
Very active
“I enjoy staying up-to
speed on tech
developments”
ENTHUSIASM FOR
TECHNOLOGY (HIGH)
Values
“I hold a diversified portfolio of small &
medium organizations. I enjoy
investing but don’t do it as often as I
should”
OUTLOOK ON INVESTING (MEDIUM)
24. But what about the models?
24
CLUSTER 2: BUILDERS
• Strategy to implement models within segments
Cross-sell models
CLUSTER 1: ACCUMULATORS
High value defection model
Large Deposit model
Upsell model
Risk takers, likely to
reinvest in high growth
funds but “unengaged”
Lives in Montreal and
has a medium appetite
for financial risk
CLUSTER 3: YOUNG
Cross-sell models
Lives outside Montreal,
single, has RRSP and is
internet-savvy
25. But what about the models?
25
CLUSTER 4: RETIRED CLUSTER 5: PROTECTOR
• Strategy to implement models within segments
High value defection model
Upsell model
Low risk takers, fund not
diversified
Family oriented,
investment savvy,
mature investors, long
standing customer, HNI
26. What about Tactical Segmentation?
• Different from Strategic Segmentation
• Initial Analytics are Predictive Models which then leads to
development of multi-segment approach. Why?
– The Hockey Stick Model
– Domination of Few Variables
26
27. Tactical Segmentation:
Thehockey stick model-lottery example
• Old model(response) has been in use for three years
• Old model(response) still provides lift and ranking for top 60% of list, but seeing
some flattening of results in bottom 40% of list
27
Rank (W2) # of Prospects
Interval Response
Rate
# of
Responders
1 80,000 48.72% 38,974
2 80,000 27.10% 21,679
3 80,000 18.74% 14,994
4 80,000 13.35% 10,679
5 80,000 11.12% 8,899
6 80,000 12.90% 10,318
7 80,000 3.50% 2,803
8 80,000 2.56% 2,048
9 80,000 2.20% 1,763
10 80,000 2.13% 1,707
80,000 14.23% 113,864
28. The hockey stick model-what did we do?
• Build two models
– One for top 60% and one for bottom 40%.
• Key differences between 2 models are:
– Top 60% contains primarily donation activity type variables
– Bottom 40% contains primarily demographic and more non-behavioural type
variables
28
29. Smoothing out the Hockey Stick model
• Analyzed impact on bottom 40% in order to observe if new model
could improve performance.
29
New model clearly provides increased
rank-ordering capability on bottom 40%.
30. Tactical segmentation-Domination of Few variables
• Again modelling results lead to the following insights:
30
Variable
Credit risk
correlation
Confidence
interval
Quebec 0.1 99%
Alberta -0.09 99%
all other variables under .05
Claim Risk Model
CHAID and correlation results lead to the
following insights that separate models should be
developed by region
All Variables
100% of sample
0.02 bad rate
Quebec Alberta Rest of Canada
20% of sample 12% of sample 68% of sample
0.04 bad rate 0.008 bad rate 0.0162 bad rate
31. Tactical segmentation Domination of few variables-results
31
Clearly the segment models outperform the one model approach
Region Segmented
Model
One Model
32. Tactical segmentation: Impact of automated predicted models
• Software is facilitating development of segmented models
• Automated routines can optimize development of multi-model approach
• Yet the need to explain and eliminate or at least mitigate “black box” solutions still prevails
• Practitioners will need to dig under the hood and be able to explain solutions
32
33. Final Thoughts
• Tactical approaches to segmentation and modelling definitely lead to improved
targeting but provide minimal insight on how to best improve communication
efforts
• Strategic approaches to segmentation and modelling lead to both improved
targeting and improved communications
33
TACTICAL SEGMENTATION &
MODELLING
STRATEGIC SEGMENTATION
& MODELLING
Editor's Notes
This represented one form of segmentation(VBS)-value Behaviour Based. Might this apply within your organization?