Presentation by Troy Hearn and Carol Brent, Kentucky Transportation Cabinet, at the National Rural Transportation Conference, December 3 - 5, 2014 in Cincinnati, OH.
The Miami Valley Regional Planning Commission (MVRPC) provides GIS resources and services to local governments and organizations in the Miami Valley region. MVRPC's GIS coordinator oversees regional geospatial coordination efforts including maintaining shared GIS datasets, developing web mapping applications, and conducting needs assessments to help partners improve their GIS capabilities. MVRPC supports partners' GIS needs through professional services such as training, assistance updating data layers, and publishing layers online for public access.
The survey results identified current GIS usage in the Miami Valley region of Ohio. 94% of respondents currently use GIS, with ESRI/ArcGIS being the most popular software. Common needs included more data like utilities, transportation, land use and census data. Respondents were interested in mobile, web and additional training. Suggested projects included developing inventories of parcels, assets, utilities and socioeconomic data, as well as standardizing data and creating a catalog of available resources.
Title: Safer People, Safer Streets, and Safer Policies at USDOT
Track: Connect
Format: 90 minute moderated discussion
Abstract: This USDOT panel will provide details on the Department’s new bicycle and pedestrian safety initiative, including information on the Ped-Bike Safety Action Agenda, Road Safety for Transit Patrons initiative, bike-walk assessments, Road Diet Guide, an aggressive research agenda, and local partnerships, including how community members can get involved.
Presenters:
Presenter: Barbara McCann Office of Secretary, USDOT
Co-Presenter: Heidi Coleman National Highway Traffic Safety Administration
Co-Presenter: Dan Goodman Office of Human Environment, Livability Team, FHWA
Co-Presenter: Joanne Waszczak Special Assistant, FTA Office of Budget and Policy
This document summarizes the Miami Valley Regional Planning Commission's (MVRPC) use of GIS. It discusses a 2015 GIS needs assessment survey of local jurisdictions, the development of a recreational assets map and inventory, updates to regional GIS layers like zoning and land use, new online mapping applications, GIS trainings provided, and plans for future GIS services and trainings. The overall purpose of MVRPC's GIS program is to provide data and expertise to support regional planning and local needs.
This document outlines Wynn Everett's transportation plan, including:
1) A comprehensive transportation analysis was conducted and all impacts were found to be mitigated through improvements.
2) A holistic, multi-modal strategy is proposed that includes improvements to rail, buses, bikes, cars, boats, and walking infrastructure.
3) Over $50 million will be invested in transportation improvements such as road widening, intersection upgrades, and public transportation connections to ensure minimal traffic impacts from the development.
The document provides an overview of mobility in Genoa, Italy. It details the city's population density, road network, vehicle fleet, and key challenges related to its hilly terrain and limited space. Public transportation accounts for 43% of trips, consisting of buses, a metro line, ferries, and trains. The city's Sustainable Urban Mobility Plan, approved in 2010, aims to improve pollution, safety, travel times through investments in public transit, cycling infrastructure, parking policies, and restricted traffic zones through 2024. The mobility department also leads innovation projects to promote sustainable transportation.
Complete Streets in New Jersey - Sheree Davisnjbikeped
This document summarizes a presentation given at the Complete Streets Summit on funding Complete Streets projects in New Jersey. It outlines that New Jersey is a leader in Complete Streets because it has strong top-down leadership and policy from NJDOT, including a built-in implementation process. It also discusses specific funding programs under MAP-21, such as Transportation Alternatives, Safe Routes to School, and Highway Safety Improvement Program funds. New Jersey is committed to planning, designing, constructing, and maintaining its highways for all users.
BKK, Cycling developments in Budapest, 2013 FebruaryKovács Virág
Cycling developments in Budapest, 2013 February
Virág Bencze-Kovács
coordinator for cycling policy
Directorate of Strategy, Development and InvestmentBudapesti Közlekedési Központ /
Centre for Budapest Transport
bicikli@bkk.hu
Keep it moving - construction phase transport planningJumpingJaq
Mark Stone discusses construction phase transport planning in 3 key areas:
1) The primary goal is to minimize impacts on existing transport users and maintain safe access during construction projects.
2) Case studies in Melbourne show how stakeholder engagement, adaptive infrastructure changes, and communication plans can deliver projects on time and under budget with minimal complaints.
3) Emerging opportunities like travel demand modeling and route optimization can further reduce disruption through innovative planning and monitoring tools.
Cheshire Development Update: Robin Miller-Stott - Transport for the NorthPlace North West
This document outlines a strategic transport plan for the North of England with the goals of transforming the region's economic performance, improving opportunities, and promoting a sustainable built and natural environment. The plan proposes strategic development corridors and investments like Northern Powerhouse Rail, integrated smart travel, and road improvements to connect cities. It estimates that the required transport funding is between £39-43 billion, with an additional £21-27 billion needed to fully realize the plan's transformational objectives.
BCS Geospatial SG - Usability of GIS and GIMuki Haklay
Maps and GIS have historically been difficult for users due to their complexity, requiring technical knowledge and exposing internal structures rather than using intuitive interfaces. While web mapping has improved usability with features like responsive design and simplified interfaces, issues remain around communicating uncertainty, adjusting to different platforms, and ensuring data is fit for various uses and users, from administrators to developers to general audiences. Continued focus on user-centered design principles is needed to make geographic information and systems truly usable.
2013 Mission First Track, How GIS Supports USAFA's Civil Engineer Squadron by...GIS in the Rockies
USAFA’s Civil Engineer Squadron’s GIS is used by many at the US Air Force Academy, both technical and non-technical users. Learn how GIS is used to help the Civil Engineer Squadron fulfill its mission to manage the US Air Force Academy's built and natural environments through respect for heritage, sustained facility excellence and a focus on the future infrastructure of the Academy. During the presentation, you will see that GIS is used to support many mission elements such as Engineering, Operations, Natural Resources, Emergency Management, GeoBase, and more, through map requests, surveys, special projects, and project deliverables. It is accomplished using DoD standards, custom codes, and custom intranet websites. You will also see some of the troubles of the job that can hinder our performance of duties. In the end, you will have received an overall summary of the tasks that we see at the US Air Force Academy to help ensure the success of the mission.
Dulles Metrorail Silver Line Phase 2 Status and FundingFairfax County
This document provides a status update on Phase 1 and Phase 2 of the Silver Line project in three parts:
1) Phase 1 is nearing completion with some punchlist items still open and closeout anticipated by the end of 2015. The final budget was $76M higher than planned.
2) Phase 2 is currently 16.5% complete overall with design at 81% and construction at 4.5%. Key work includes the aerial guideway at Dulles Airport and the rail yard. The schedule has been extended 13 months.
3) Fairfax County is coordinating design reviews and with project partners. Garage design is complete for Herndon and Innovation Center stations and value engineering is underway. Completion is
Ahmed Al Nammourh is a Palestinian civil engineer and GIS expert with over 15 years of experience in surveying, GIS, photogrammetry, and remote sensing projects. He holds a Master's degree in Engineering Management and Bachelor's degree in Civil Engineering. He has worked on numerous projects for municipalities, NGOs, and private companies in the West Bank and abroad. Currently, he is the founder and manager of AL-IHTERAF Company for Surveying and Geomatics, and teaches part-time at An-Najah National University.
Pedestrian infrastructure audits for the City of Sydney’s Liveable Green Ne...JumpingJaq
The City of Sydney commissioned pedestrian infrastructure audits along its Liveable Green Network to identify gaps and areas for improvement. A team audited the pedestrian facilities over eight weeks, recording the location, issues, and widths of paths and other infrastructure using GPS and GIS tools on tablets. They collected extensive data on over 14,000 assets. This included identifying over 6,900 kerb ramps. The results were prioritized and presented to the City in a detailed geodatabase and maps to inform planning improvements to pedestrian access.
Portland has developed sustainable transportation planning at the federal, state, and city levels. At the federal level, agencies provide funding for transportation projects, while at the state level an agency focuses on land use and development goals. At the city level, Portland has created plans focused on sustainability, pedestrians, and balancing transportation needs. The Metro regional government also contributes to these efforts through initiatives that aim to increase access to transit, walking, and biking while reducing emissions. Non-government organizations further advocate for biking and walking in the community.
Session 34: Rec Trails California (Haynes)-PWPBSharon Roerty
The Federal Highway Administration’s Transportation Enhancement Activities and Recreational Trails Program
provide funds to the States to develop transportation and recreation infrastructure for walking and bicycling, connecting communities and promoting active living. Attendees will learn how to apply for funds: what works,
what doesn’t.
The document provides an overview of Chapel Hill Transit, the second largest transit system in North Carolina, which serves Chapel Hill, Carrboro and UNC-Chapel Hill with 31 bus routes. It discusses plans for a proposed North-South Bus Rapid Transit system to connect the region and support growth by providing a long-term scalable transit solution. The BRT project is currently in the 60% design phase to finalize running ways and station placements along the corridor.
Regional Bicycle and Pedestrian Planning FrameworkRPO America
During the 2017 National Regional Transportation Conference, Matthew Day shared the Triangle Area Rural Planning Organization's approach to developing a regional framework for bicycle and pedestrian infrastructure.
This document summarizes a presentation given at the Miami Valley Planning & Zoning Workshop on GIS in the Miami Valley region. It discusses the results of a 2015 GIS needs assessment survey, including what data and software are currently used. It also outlines several GIS projects undertaken by MVRPC, including a recreational asset inventory map, updated regional data layers, and new online mapping applications. Lastly, it discusses future GIS training opportunities and plans to continue providing GIS services and expertise to member organizations.
This document summarizes a presentation given at the Miami Valley Planning & Zoning Workshop on GIS in the Miami Valley region. It discusses the results of a 2015 GIS needs assessment survey, including what data and software are currently used. It also outlines several GIS projects undertaken by MVRPC, including a recreational asset inventory map, updated regional data layers, and new online mapping applications. MVRPC aims to continue providing GIS services, training, and collaborative regional mapping applications to share data and expertise with local jurisdictions.
The document provides updates from various transportation research centers at the Upper Great Plains Transportation Institute. The Advanced Traffic Analysis Center discussed ongoing work related to traffic data collection, modeling, and operations. The Small Urban and Rural Center on Mobility discussed recent reports and current research projects focused on rural and tribal transportation issues. The Rural Transportation Safety and Security Center discussed emphasis areas and current team projects. The North Dakota Local Technical Assistance Program provided an update on programs and services for local agencies. Finally, a study on county, township, and tribal road and bridge infrastructure needs estimated a total funding need of $10.5 billion over the next 20 years to maintain the existing system.
The document discusses Virginia's rural transportation planning program and the development of rural long-range transportation plans (RLRPs). It provides background on the program and funding for rural planning districts. It outlines the objectives, process, benefits and keys to success of developing RLRPs. RLRPs are developed through public outreach and aim to identify priorities and improvements to enhance safety, mobility and economic opportunities in rural areas of Virginia.
Coding for Community - Team (Bike View)Jiahuan Kang
Code For Princeton created a website called bikeview.org to help the Princeton Bicycle Advisory Committee with bike safety and infrastructure planning. Bikeview.org visualizes bike crash data on interactive maps to help identify unsafe routes and prioritize road improvements. It also includes tools for reporting non-crash incidents and finding low-traffic bike routes. The project uses open source technologies like R and CartoDB to analyze and map Mercer County bike crash data provided by the municipality. Bikeview.org makes this data freely available to the public online and through a mobile app in order to raise awareness and spark discussion around bike safety issues.
Dynamic Fleet Sizing Problem for an E-Scooter Valet ServiceJoseph Chow
This document proposes a dynamic fleet sizing algorithm for an e-scooter valet service. It outlines using Citi Bike trip data to analyze demand trends and prepare the data spatially. It then describes using Clarke-Wright's method to determine the optimal fleet size based on hourly demand. Route generation is done using Google OR-Tools' CVRP algorithm. Results show the dynamic fleet model accurately predicts vehicle needs and has comparable mileage to static fleets. A cost-benefit analysis finds the proposed model has lower costs than Citi Bike. Additional areas for exploration are also identified.
The document provides an annual review of initiatives to implement the Comprehensive Plan for College Station. It summarizes progress made in 2013 on neighborhood, district, and corridor plans; master plans for areas like the Medical District and parks; special projects like the BioCorridor development and Demographic Profile; and updates to the Unified Development Ordinance. It describes challenges faced and priorities for 2014 to ensure the Comprehensive Plan guides future growth.
CycleStreets: Our Story - presentation to Net2Camb eventCycleStreets
CycleStreets is a UK-wide cycle journey planner and photomap created by cyclists for cyclists. It uses OpenStreetMap data to plan bike routes and allows users to add photos. The website includes a journey planner, photomap, and mobile apps. CycleStreets aims to promote cycling by making it easier to find safe and enjoyable bike routes anywhere in the UK. It was originally created for Cambridge but has expanded nationwide due to public demand.
The document summarizes a regional bikeway, walkway, and blueway plan for Virginia's New River Valley. It outlines challenges in the region like incomplete bike and pedestrian infrastructure and a growing elderly population. A committee developed the plan by identifying regional assets, establishing goals, and collecting local data. The resulting plan includes maps, tables, and an executive summary that divides the region into five areas. It is intended to be used as a planning resource, help pursue funding, and support tourism by integrating multijurisdictional connections in the region.
Fayetteville Arkansas - Neighborhood Planning AreasThomas L Brown
This document outlines a process to establish Neighborhood Planning Areas for the city of Fayetteville by mapping neighborhood focal elements, boundary elements, and obtaining citizen input to finalize boundaries. Once boundaries are established, a neighborhood planning database would be created to store relevant data and support development and updating of neighborhood master plans on a scheduled basis. This proposed process aims to streamline and reinvigorate neighborhood planning, as only one corridor plan and no neighborhood plans have been completed since adoption of the 2030 Comprehensive Plan.
Visualize 2045: Highlights from the Draft PlanFairfax County
The document provides an overview of the draft Visualize 2045 transportation plan for the Washington D.C. region. It summarizes the plan's key elements including projected population and job growth, current and planned transportation infrastructure, funding assumptions and revenues, and performance metrics. It also outlines the plan's aspirational elements which illustrate ambitious transportation improvements if more funding was available, as well as public engagement efforts to gather input on the draft plan.
20140506-NCAMPO-GIS - NC Pedestrian and Bicycle Infrastructure NetworkKristy Jackson
The document summarizes the development of the Pedestrian and Bicycle Infrastructure Network (PBIN), a statewide GIS inventory of existing and planned bicycling and walking facilities in North Carolina. It details the background and need for the PBIN, outlines the process used to develop the PBIN including defining feature data, designing a geodatabase, and collecting spatial data from agencies. It also discusses next steps such as making the PBIN data and format available to agencies to submit updates and discusses potential uses of the PBIN data.
This document provides information about data sources and datasets that may be useful for GovHack 2014. It begins with an introduction to Melbourne City Council and Victorian government open data portals. It then lists and describes several datasets related to infrastructure locations, building information, events, urban environment performance, and more. Contact details are provided for Melbourne City Council open data representatives. The document encourages exploration of additional datasets on transport, events, communities, and traffic before concluding with contacts at VicRoads and Transport Safety Victoria.
This document discusses performance measures for bicycle and pedestrian transportation. It outlines goals like mobility, safety, health, economy and environment. Sample metrics are proposed to measure these goals, like the percentage of roads including complete street features or miles of greenways built. Data needs are identified to track these metrics, like project descriptions, enforcement events, and physical inactivity rates from surveys. The document provides an example of how the metrics could be used to prioritize transportation projects based on safety, access to destinations, population density, and other criteria. Outcomes will be evaluated to see if funding is shifted to more bike and ped projects and how the metrics and process can be improved.
This Seminar presentation is made by Shrikrishna Kesharwani
1ST YEAR, Transportation engineering student
NIT WARANGAL
FOLLOW ME ON INSTAGRAM
@SHRIKRISHNAKESHARWANI
This document provides a conceptual multi-modal network master plan for Columbia County, GA. It includes an introduction describing the project background, approach, and goals. A community assessment analyzes the benefits of bicycling facilities and surveys community needs. The plan proposes corridor types, inventories existing facilities, and reviews current projects. It identifies priority connections and recommends collaboration and funding strategies for implementation. The goal is to create a safe, connected system of trails and lanes to accommodate the county's growing population and make it less car-dependent.
Board of Supervisors Transportation Committee-Next Steps for Urban Street Sta...Fairfax County
The Fairfax County Department of Transportation presented next steps for developing urban street standards. The standards will focus on creating walkable, low-speed urban environments within activity centers and accommodate all transportation modes. Fairfax County is working with VDOT and DRPT to develop the standards for use statewide. Fairfax will designate activity centers and priority transportation modes on a multimodal system map. It will then develop recommended road cross sections for approval over the next year. The new standards aim to implement the County's comprehensive plan with fewer design exceptions.
Similar to Planning for Bicycling and Pedestrian Accommodations (20)
RPO America Peer Exchange: Rural Transportation Planning ProgramsRPO America
On May 16, the National Association of Development Organizations (NADO) and its program affiliate RPO America held a virtual peer exchange focused on rural transportation planning programs. Speakers included Krishna Kunapareddy (NADO), Chris Whitaker (Region XII Council of Governments), and Jennifer O'Connor (Northern Arizona Council of Governments). Learning objectives included:
* Understanding how RPOs work across the country, including common planning and program responsibilities and unique tasks customized for local conditions
* Identify common regional planning organization roles to support local transportation planning and implementation needs.
* Identify common regional organization roles conducted in support of statewide transportation planning, such as long-range plans, short-range capital programs, and modal plans.
CARTS Microtransit—Innovation in Rural MobilityRPO America
Dana Platt and Dave Marsh, Capitol Area Regional Transit System, shared their agency's experience deploying microtransit (on-demand transportation) across multiple rural counties outside of the Austin, TX, region during a virtual roundtable on June 29, 2023.
BCGo: Microtransit System Operating throughout Calhoun County, MIRPO America
Mallory Avis and Kristy Grestini, Battle Creek Transit, shared their agency's experience with a microtransit pilot program serving a large rural area and small urban area in Michigan during a virtual roundtable on June 29, 2023.
Microtransit Planning & Implementation Lessons from the North Carolina Experi...RPO America
Eleni Bardaka shared research conducted on North Carolina agencies deploying different models of microtransit throughout the state during a virtual roundtable on June 29, 2023.
Microtransit Overview: A Research PerspectiveRPO America
Andrea Hamre, Western Transportation Institute, recapped current trends and research in rural approaches to microtransit, or on-demand public transit, during a virtual roundtable on June 29, 2023.
On April 20, Southern Georgia Regional Commission stakeholders met for a virtual roundtable discussion on employment and transportation issues. During the event, Courtney Cherry, Berkeley-Charleston-Dorchester Council of Governments (SC), shared information about administering a regional vanpool program to provide regional residents with an affordable commute option.
Employment & Transportation in the Southern Georgia RegionRPO America
On April 20, Southern Georgia Regional Commission stakeholders met for a virtual roundtable discussion on employment and transportation issues. Bret Allphin, NADO, provided an introduction on commuting patterns and options.
EDDs and States: Collaborating for SuccessRPO America
This document discusses how state agencies and Economic Development Districts (EDDs) can collaborate through the Comprehensive Economic Development Strategy (CEDS) process. It provides examples of states leveraging regional CEDS plans to inform statewide goals and programs. States can support regional CEDS planning by providing data, information, and resources. Statewide associations of EDDs are well-positioned to lead statewide CEDS/planning efforts in collaboration with states. EDDs should be key partners in developing and implementing statewide CEDS plans, even if not led by EDDs.
Strengthening Partnerships Between States and Economic Development DistrictsRPO America
This technical assistance hands-on session will focus on state-EDD alignment best practices and how to build a collaborative
relationship with state economic development departments – from planning to program implementation.
Brownfields Tour: A Visit to Hazelwood Green & RIDC Mill 19RPO America
The RIDC is a private economic development organization in southwest Pennsylvania that develops industrial and technology sites. It focuses on growing key industry clusters like advanced manufacturing, biotech, and autonomy. Some of RIDC's past projects include redeveloping former steel and manufacturing sites, removing contamination, and attracting new companies. These redevelopment projects have created thousands of jobs and millions in annual tax revenue while transforming formerly blighted areas.
An increasing rate of change makes the already challenging work of doing good even more difficult. We are all trying to make the world a better place but are often using yesterday’s information to do so. What if we could predict the future and prepare for the coming realities that will impact our clients and our communities? Join philanthropic futurist Trista Harris as she takes us on an interactive journey where she’ll uncover tools to create the future.
Brownfields for Redeveloping ResilienceRPO America
This session, led by the Technical Assistance for Brownfields (TAB) team, will highlight how communities are viewing their brownfields redevelopment through the lens of resilience. It will discuss case studies on brownfields redevelopment in response to negative climate change impacts, how to leverage resources for a successful project, as
well as tips from a successful US EPA brownfields grant recipient.
Food safety, prepare for the unexpected - So what can be done in order to be ready to address food safety, food Consumers, food producers and manufacturers, food transporters, food businesses, food retailers can ...
About Potato, The scientific name of the plant is Solanum tuberosum (L).Christina Parmionova
The potato is a starchy root vegetable native to the Americas that is consumed as a staple food in many parts of the world. Potatoes are tubers of the plant Solanum tuberosum, a perennial in the nightshade family Solanaceae. Wild potato species can be found from the southern United States to southern Chile
Synopsis (short abstract) In December 2023, the UN General Assembly proclaimed 30 May as the International Day of Potato.
Combined Illegal, Unregulated and Unreported (IUU) Vessel List.Christina Parmionova
The best available, up-to-date information on all fishing and related vessels that appear on the illegal, unregulated, and unreported (IUU) fishing vessel lists published by Regional Fisheries Management Organisations (RFMOs) and related organisations. The aim of the site is to improve the effectiveness of the original IUU lists as a tool for a wide variety of stakeholders to better understand and combat illegal fishing and broader fisheries crime.
To date, the following regional organisations maintain or share lists of vessels that have been found to carry out or support IUU fishing within their own or adjacent convention areas and/or species of competence:
Commission for the Conservation of Antarctic Marine Living Resources (CCAMLR)
Commission for the Conservation of Southern Bluefin Tuna (CCSBT)
General Fisheries Commission for the Mediterranean (GFCM)
Inter-American Tropical Tuna Commission (IATTC)
International Commission for the Conservation of Atlantic Tunas (ICCAT)
Indian Ocean Tuna Commission (IOTC)
Northwest Atlantic Fisheries Organisation (NAFO)
North East Atlantic Fisheries Commission (NEAFC)
North Pacific Fisheries Commission (NPFC)
South East Atlantic Fisheries Organisation (SEAFO)
South Pacific Regional Fisheries Management Organisation (SPRFMO)
Southern Indian Ocean Fisheries Agreement (SIOFA)
Western and Central Pacific Fisheries Commission (WCPFC)
The Combined IUU Fishing Vessel List merges all these sources into one list that provides a single reference point to identify whether a vessel is currently IUU listed. Vessels that have been IUU listed in the past and subsequently delisted (for example because of a change in ownership, or because the vessel is no longer in service) are also retained on the site, so that the site contains a full historic record of IUU listed fishing vessels.
Unlike the IUU lists published on individual RFMO websites, which may update vessel details infrequently or not at all, the Combined IUU Fishing Vessel List is kept up to date with the best available information regarding changes to vessel identity, flag state, ownership, location, and operations.
Preliminary findings _OECD field visits to ten regions in the TSI EU mining r...OECDregions
Preliminary findings from OECD field visits for the project: Enhancing EU Mining Regional Ecosystems to Support the Green Transition and Secure Mineral Raw Materials Supply.
Working with data is a challenge for many organizations. Nonprofits in particular may need to collect and analyze sensitive, incomplete, and/or biased historical data about people. In this talk, Dr. Cori Faklaris of UNC Charlotte provides an overview of current AI capabilities and weaknesses to consider when integrating current AI technologies into the data workflow. The talk is organized around three takeaways: (1) For better or sometimes worse, AI provides you with “infinite interns.” (2) Give people permission & guardrails to learn what works with these “interns” and what doesn’t. (3) Create a roadmap for adding in more AI to assist nonprofit work, along with strategies for bias mitigation.
Jennifer Schaus and Associates hosts a complimentary webinar series on The FAR in 2024. Join the webinars on Wednesdays and Fridays at noon, eastern.
Recordings are on YouTube and the company website.
https://www.youtube.com/@jenniferschaus/videos
2. KYTC Pedestrian and Bicycle
Travel Policy
Adopted 2002
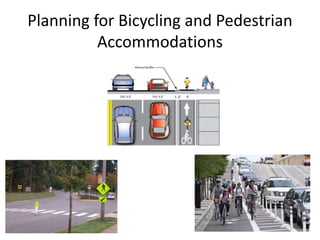
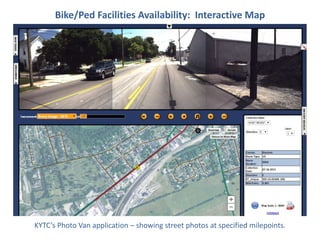
• The Kentucky Transportation Cabinet
(KYTC) shall consider the
accommodation of bicycles and
pedestrians on all new or reconstructed
state-maintained roadways.
3. The Goal (KYTC Policy)
1. Plans for connecting people via all modes of
transportation
2. Providing access for all modes of transportation
3. Connecting people to the places they want/need to
go
4. The Plan
1. Assessing the walkability and bikeability
for a community (focus areas)
2. Develop a master plan or projects for
the community
3. Prioritizing projects, improvements,
education programs, enforcement
programs, and
encouragement/marketing ideas,
5. Creating Plans & Projects
The KYTC Bicycle & Pedestrian program team is working
with 28 cities and or counties to improve or develop a
master plan or individual project (2014)
9. ADD Data Collection
• Area Development Districts
– Kentucky Regional planning
organizations
– Annual KYTC work program contract
– Various multimodal data
• Freight generators
• Rail yards
• Truck parking
11. Phase I:
Plan Data Collection
• Provided a database for structured data entry
– Cities with 1,500 or more population
– Links to any plan information we know
• Asked ADDs to contact every city & county for:
– Master and bike/ped plan info
– Any identified projects
– Existing B/P facilities and events
12.
13. Plan Information Availability
http://maps.kytc.ky.gov/photolog/?config=BikePedPlan
Versailles, Paris, Danville, Richmond,& Berea have city plans
Powell County has a countywide plan
Lexington has a Metropolitan Planning Organization plan
and indicate facilities data collection efforts
14. Phase II:
Facilities Data Collection
– Each ADD was assigned 2 cities
– KYTC provided a structured database
– Basic Data Rules:
1. Collect only facilities that are highway-adjacent
2. All facilities must be associated with the
highway centerline
3. Data may be collected by viewing aerials but
must be field verified
18. ArcMap Tools to Assist Collection
• Linear Referencing
Tool to ID route and
location
• Plot the collected
data
– Display Route
Events
– Generate field for
errors
19. We’ve Got Data -
Now We Want Everybody to Have It!
• Internal KYTC
• Public data
– Interactive map for both plans & facilities
– Downloadable data
20. Bike/Ped Facilities Availability:
Internal KYTC
The State Highway Engineer’s (SHE) ArcGIS map template. Bicycle and Pedestrian
Facilities (sidewalks, crosswalks, bike lanes, etc.) is a layer that may be added to
the template map for review and analysis.
23. Bike/Ped Facilities Availability:
Downloadable Data
• Table/Spreadsheet format from:
– KYTC Data Mart
• GIS Shapefile format from:
– KYTC Data Mart
– Division of Planning web page
– Kentucky GeoNet
24. Bike/Ped Facilities Availability:
Downloadable Data
KYTC Data Mart may be accessed from the Cabinet home page:
http://transportation.ky.gov/Pages/default.aspx
28. What’s Next?
• Publicize data availability
• Continue to collect at least 2
cities per ADD per year
• Capture new plans/facilities
• Collect other data (Share the
Road signs, non-roadway
adjacent facilities, etc.)
• Investigate other technologies
• Incorporate donated data
29.
30. Contact Us
Troy Hearn,
Bicycle & Pedestrian Program Coordinator
KYTC Division of Planning, MultiModal Branch
Troy.Hearn@ky.gov
(502) 782-5060
Carol Brent
Data Specialist-GURU
KYTC Division of Planning, MultiModal Branch
Carol.Brent@ky.gov
(502) 782-5048
Editor's Notes
KY has a very well written Bike/Ped Transportation Policy. KYTC will also consider accommodating bicycle transportation when resurfacing of roadways, including shoulders.
Check list for consideration:
* A pedestrian facility already exists on the current roadway
* A state locally, or regionally adopted pedestrian or bicycle network or policy has designated pedestrian/ bike
improvements in the area of the specific roadway project or for that classification of roadway.
* Pedestrian traffic exists along the current roadway: This may be determined by the
observation of pedestrian traffic or by the public-involvement process.
* Public interest in and demand for pedestrian facilities are determined at the planning and
preliminary engineering public-involvement stages
* KYTC project-level decisions will complement local pedestrian plans to the maximum
reasonable extent
* KYTC project-level decisions will evaluate future connections to close gaps in parallel
connectivity between projects and developed areas/community destinations or existing
pedestrian facilities within 300 feet beyond normal project limits within existing publicly
owned rights of way.
· KYTC project-level decisions will evaluate future connections to close gaps in
perpendicular connectivity to developed areas/community destinations or existing
pedestrian facilities within 100 feet of the roadway edge of pavement within existing
publicly owned rights of way.
· KYTC project-level decisions will consider pedestrian access to existing and planned
transit stops.
Included in early planning work
Many times is difficult to consider or justify a transportation mode that is not present when doing the field surveys/reviews. Cyclists and pedestrians are often the silent/ unseen users of the roadways. It is the responsibility of the local government to choose the priority areas that need sidewalks, bike lanes, bike paths, and all other transportation facilities/projects. Many times the local government will rely on an outside/private organization to provide the associated information on the cyclists and pedestrian needs.
Assess Develop Build
rank new projects or improvements and much more are included in the plan
Winchester, Shelbyville, City of Franklin, Richmond, Frankfort & Franklin County, Campbellsville, Paris, Georgetown, Morehead, Princeton, Big Sandy Area, Bowling Green, Glasgow, Carroll County, Raceland, Paintsville, Lebanon, Salyersville, Middlesboro, Elizabethtown, Somerset, Greensburg, Mayfield, Maysville, Meade County, Hardford, Manchester, and Clay County
Why?
Starts with knowing what you have now
find missing links
List the connections between these places
Data collection in Carrollton, KY for all sidewalks, bike lanes, multiuse paths, and cross walks.
Knowledge is Power
Easy to add layers of the projects, needs, priorities
Information for local government, bike clubs, citizens, and tourist
The pedestrian planning maps are usually in smaller focus area
Bicycle planning maps can cover a larger area (county wide or regional)
Great place to start your ADA Transition Plans
The work you do to develop the vision can now be displayed via GIS mapping
There is a lot more work that goes into this “master plan” vision, but being able to accurately map and show this information in this way is very helpful
The local community must share the desired projects and plans with the Transportation planners (KYTC, ADDs, and MPOs)
ADDs seemed the most logical and efficient means of obtaining the needed data.
ADDS are rural planning organizations, 15 in Kentucky, similar to Councils of Governments in other states
Deal with Health Care and ADA, Kentucky Infrastructure Authority, economic development among others
Among the current ADD AGIS activities that I am familiar with are:
collect GIS/GPS data on water and sewer infrastructure,
highway centerlines,
HIS roadway data
Never know where GIS people will show up: Adam in ride sharing public announcement
ADDs the Rural Transportation Planning Organizations recommended in MAP-21
Each has a transportation planner who deals with both the local officials and the Transportation Cabinet
Since they already collect some data for us, B/P data was a logical addition in the annual contract
The old way to access plan info – web links to the site for a city, county or regional plan, no visual representation of their location. For those who want it, we still have these plans listed on the Planning web page.
Comp plan? Bike and/or ped plan therein? Electronic – if so, link?
Bike/ped master plan, sponsoring org with contact and link to plan,
Does the community desire to develop or improve a bike/ped plan – created list of people for Troy to contact
Notes of any locations already identified
Any bike/ped shops and the amount of business – no responses
Used Access to structure the data entry so could compile into single file and map the data (and reduce post-processing time by me!)
New format – visual ID of those with data, combines all bike/ped data in one interactive map
Only those plans that are hosted on a local authority web site – city government, local tourism agency, local development agency
First year was a pilot project and therefore a lot of trial and error
2 cities chosen based on perceived demand based on the number of email or phone contacts to Troy
Not MPOs because they have their own staffs to do this
Data structure of B/P facilities:
Link the facilities to the highway using HIS route ID and milepoints (Have the backbone tree, now add the branches)
Only roadway-adjacent facilities
Trial and error first year pilot project
Collecting sidewalks, crosswalks, bike lanes, shared bike lanes, separated bike lanes, multi-use paths
How hard can this be?
Guidance document is 2 pages long, 27 fields we wanted data on: surface, facility user, ADA transition facilities
Just as bad, some route IDs make right-angle turns onto another road, how do you code the crosswalks at that intersection?
The final guidance document is 23 pages, only 9 fields of data to collect!
GIS staffing varies among the ADDs, so collection process varied by ADD from GIS staff doing all work to Transportation Planner doing all work (after their GIS staff provided good tools.) One benefit of the data collection effort was the working relationships developed between the planners and the GIS people.
Required: Route ID, milepoints, side of route, facility type, (need to change to add the shared use paths for bikes/motor vehicles – sharrows – painted symbol in driving lane. Asked for begin and end locations to aid in QC and description of the facility segment
Combined all data collected into a single excel sheet, imported into highways GIS
Inventory sheet useful for those without GIS experience to know what to collect and how to attribute each section. Some ADDs used it religiously, especially for QC of their data, others not at all.
Since Access is not as user-friendly for mass data entry, for FY 2015, switched from Access to Excel, with auto-complete route ID
The main issue with submitted data was that route ID was wrong (not within the network) or that the milepoints were incorrect (directionality of the centerlines, route ID changed at an intersection)
Linear Referencing Tool could be used to click on the route in the measured shapefile to find the route ID and milepoint at a specific location. Plot, Plot, Plot before submitting, using the option to generate a field for errors.
Errors that could not be helped were the one section of new highway which was not “officially” open but for which the ADD had the route ID and milepoints. Had to wait several months for the route to be added before entering the new facilities into the HIS database.
ADDs have a head start on most people. Randall Embry and Jessica Blankenship have both been proactive in using the results of the data collection with their local officials and programs.
Others may not be using it so we have provided it in as many places as we can think of.
KYTC has very active GIS core group who have created an amazing ArcMap template for the Cabinet. As best I could tell, there are 33 categories of GIS data that can be added to the map. Within those categories, the Bike/Ped data is one of 47 possible layers in the Asset Group (also includes shoulder type and width, traffic counts, number of lanes, access control, ferry boats and permits!) Available layers also include imagery and other backgrounds, natural resources and on and on and on….
This is the map Troy showed you earlier: the Info available varies by scale. BTW, this has been a challenge and wake up call for some cities: why is their information not on this map. It gives Troy the opportunity to work with them on developing plans.
Plans:
Red dots for each city bike ped plan,
Green polygons for counties with approved plans,
Gray polygons for MPOs with plans,
Facilities:
Pink dots for cities already inventoried for facilities
Blue dots for cities assigned to be inventoried for facilities,
Interactive map zoomed to the city of Paris showing bicycle and pedestrian facilities. Note the dark blue line indicating Shared Bike Lanes. Dark brown lines indicate sidewalks, lighter brown lines indicate crosswalks. There are buttons at top right to switch between base map, aerial photography and, as in next slide, the photo van “street view” images.
Used for viewing/collecting bike/ped data
Also used for showing data that has been collected
Measure distance or assets?
Cabinet very proud of all of the enterprise data available on this site from highway funding and performance measures, to design plans to Bridge and traffic data. Accessed from the Cabinet home page
From the Advanced Query button, you click to the HIVEi to download the Bike/Ped data in tabular format
From the Spatial button, you may download a zipped shapefile (including table that can be opened with Excel)
Another place to download the zipped GIS shapefile is the Division of Planning page for Highway System extracts
If you are searching the GeoNet for GIS data, you may search for bike ped and find the zipped GIS shapefile along with its metadata.
OK – now we have data on bike/ped plans around the state, we have some data on bike/ped facility locations in specified locations around the state, NOW WHAT?
Troy keeps finding folks both in KYTC and in the communities who don’t know about the data available for their use.
Over 400 incorporated areas in Kentucky but many are small so ADDs may collect more than 2 per year
Collect sign type and location data or painted symbols on the highway
Structure or data connection for collecting non-roadway adjacent facilities for system continuity
Other technologies such as 1) obtaining/harvesting data from photo van images, 2) using Bentley’s spatial capture application to keep route info and spatial location
Challenges with fitting donated data into our architecture (polygons vs lines, linear referencing systems, route IDs or names)
Have received or been offered Kenton County, Louisville, Woodford County