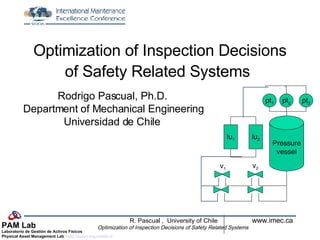
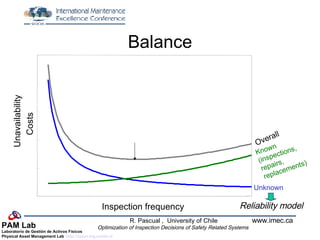
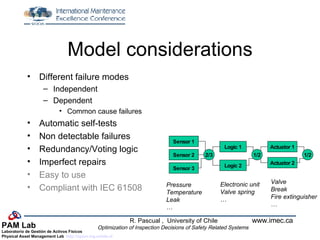
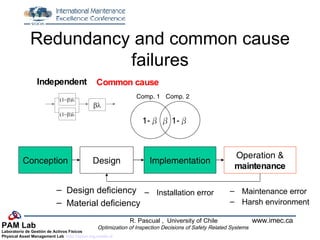
Optimization of Inspection Decisions of Safety Related Systems   Rodrigo Pascual, Ph.D. Department of Mechanical Engineering Universidad de Chile Pressure vessel lu 1 lu 2 pt 1 pt 2 pt 3 v 1 v 2
Motivation Safety Humans Environment Downstream equipment Dormant systems Systems in storage Spares Weapons Standby equipment Safety systems
Moubray (1997) “ If RCM is correctly applied… it is not unusual to find that up to  40% of failure modes fall into the hidden category … up to  80% of these failure modes require failure finding , so up to  one third  of the tasks generated by comprehensive, correctly applied maintenance strategy development programs are  failure finding tasks …”
Motivation Medical Expose dose  control  in radiotherapy systems Air transport Flight-by-wire  control systems Automotive Airbags Antilock brake systems Process Emergency shutdown systems Military/Law  enforcement Gas detectors Railway Automatic train  stop systems Applications
Motivation Safety Systems in Process Industry (34 incidents) Source: Bell (2003) http://www.iee.org/Oncomms/pn/emc/Paper03.pdf Conception Design Implementation Operation & maintenance
Balance Unavailability Inspection frequency Overall  Unknown Known (inspections, repairs,  replacements)  Costs Reliability model
IEC 61508 (2004)   Functional safety of electrical/electronic/programmable electronic safety-related systems Life-cycle centered Umbrella for other standards 4 3 1 1,E-05 1,E-04 1,E-03 1,E-02 1,E-01 2 Probability of failure on demand Safety integrity level IEC 61508 (2004) Nuclear IEC 61513 (2001) Machinery 62061 (2005) API 670 (2000) Generic ISO 14224 (2004) Railway EN 50126 (1999) EN 50128 (2001) Process IEC 61511 (2003) ANSI 84.01 (2004 )
Aim at the in-service phase Quantify the reliability of safety systems Estimate Optimal inspection and overhaul intervals Assess  Safety systems architecture and component selection Overhaul and repair actions Conception Design Implementation Operation & maintenance
Model considerations Different failure modes Independent Dependent Common cause failures Automatic self-tests Non detectable failures Redundancy/Voting logic Imperfect repairs Easy to use Compliant with IEC 61508 Sensor 1 Sensor 2 Sensor 3 Logic 1 Logic 2 2/3 1/2 1/2 Actuator 1 Actuator 2 Pressure Temperature Leak … Valve Break Fire extinguisher … Electronic unit Valve spring …
Epochs for functional assessment Manual Random detection Automatic On demand
Failures of safety systems IEC 61508 Detected at  inspections Not detected at  inspections Failure “ Random” Systematic Aging (component) Stress (subsystem) Design (specification) Interaction (human error)
Imperfect inspections “… many assume these tests (inspections) to be perfect, 100% test coverage... the best tests are probably more like 90% effective. Many are more like 60% effective…” Goble, W.M., Periodic inspection and test: requirements and benefits, Hydrocarbon Processing, 81(6), 117, 2002.
Partial and full inspections instantaneous
Overall availability & safety availability * ✔ ✔ ? ? ? ✔
Simplified model Overall availability Partial inspections Full inspections Probability of failure on demand Safety availability overall safety
Practical consideration Component failure rate (standard databases) Safety system level failure rate (plant information system) Complex System model One component model Conception Design Implementation Operation & maintenance
Scheme
Redundancy and common cause failures Design deficiency Material deficiency Common cause Independent Installation error Maintenance error Harsh environment 1- β 1- β β Comp. 1 Comp. 2    Conception Design Implementation Operation & maintenance
Example  2 out of 3 Pressure vessel lu 1 lu 2 pt 1 pt 2 pt 3 v 1 v 2
Example single component safety system Full inspection 5% MTBF Inspection coverage  50% Sensitivity analysis   =partial inspection time/full inspection time  Time Instantaneous availability Partial insp. Partial insp. Full inspection Overall Availability 0 2 4 6 8 10 No. of partial inspections before renewal
Complex system Failure rate (  10 6  hours) Common  Cause Factor From:Hauge, S., et al., Reliability Prediction Method for safety Instrumented Systems; PDS Method Handbook, 2006 Edition.,SINTEF, Trondheim, Norway, 2006
Reliability blocks  diagram
Results Safety availability Partial coverage Full coverage  =0.7  =1.0
Number of partial inspections in a renewal cycle N
Sensitivity analysis Nr of partial  inspections Period between Partial inspections Optimal overall availability  Attained safety  availability
Review Estimate maintenance optimal partial/full inspection intervals Assess  Design safety systems architecture and component selection Maintenance Replacement and repair actions Conception Design Implementation Operation & maintenance

Pascual Imec06

  • 1.
    Optimization of InspectionDecisions of Safety Related Systems Rodrigo Pascual, Ph.D. Department of Mechanical Engineering Universidad de Chile Pressure vessel lu 1 lu 2 pt 1 pt 2 pt 3 v 1 v 2
  • 2.
    Motivation Safety HumansEnvironment Downstream equipment Dormant systems Systems in storage Spares Weapons Standby equipment Safety systems
  • 3.
    Moubray (1997) “If RCM is correctly applied… it is not unusual to find that up to 40% of failure modes fall into the hidden category … up to 80% of these failure modes require failure finding , so up to one third of the tasks generated by comprehensive, correctly applied maintenance strategy development programs are failure finding tasks …”
  • 4.
    Motivation Medical Exposedose control in radiotherapy systems Air transport Flight-by-wire control systems Automotive Airbags Antilock brake systems Process Emergency shutdown systems Military/Law enforcement Gas detectors Railway Automatic train stop systems Applications
  • 5.
    Motivation Safety Systemsin Process Industry (34 incidents) Source: Bell (2003) http://www.iee.org/Oncomms/pn/emc/Paper03.pdf Conception Design Implementation Operation & maintenance
  • 6.
    Balance Unavailability Inspectionfrequency Overall Unknown Known (inspections, repairs, replacements) Costs Reliability model
  • 7.
    IEC 61508 (2004) Functional safety of electrical/electronic/programmable electronic safety-related systems Life-cycle centered Umbrella for other standards 4 3 1 1,E-05 1,E-04 1,E-03 1,E-02 1,E-01 2 Probability of failure on demand Safety integrity level IEC 61508 (2004) Nuclear IEC 61513 (2001) Machinery 62061 (2005) API 670 (2000) Generic ISO 14224 (2004) Railway EN 50126 (1999) EN 50128 (2001) Process IEC 61511 (2003) ANSI 84.01 (2004 )
  • 8.
    Aim at thein-service phase Quantify the reliability of safety systems Estimate Optimal inspection and overhaul intervals Assess Safety systems architecture and component selection Overhaul and repair actions Conception Design Implementation Operation & maintenance
  • 9.
    Model considerations Differentfailure modes Independent Dependent Common cause failures Automatic self-tests Non detectable failures Redundancy/Voting logic Imperfect repairs Easy to use Compliant with IEC 61508 Sensor 1 Sensor 2 Sensor 3 Logic 1 Logic 2 2/3 1/2 1/2 Actuator 1 Actuator 2 Pressure Temperature Leak … Valve Break Fire extinguisher … Electronic unit Valve spring …
  • 10.
    Epochs for functionalassessment Manual Random detection Automatic On demand
  • 11.
    Failures of safetysystems IEC 61508 Detected at inspections Not detected at inspections Failure “ Random” Systematic Aging (component) Stress (subsystem) Design (specification) Interaction (human error)
  • 12.
    Imperfect inspections “…many assume these tests (inspections) to be perfect, 100% test coverage... the best tests are probably more like 90% effective. Many are more like 60% effective…” Goble, W.M., Periodic inspection and test: requirements and benefits, Hydrocarbon Processing, 81(6), 117, 2002.
  • 13.
    Partial and fullinspections instantaneous
  • 14.
    Overall availability &safety availability * ✔ ✔ ? ? ? ✔
  • 15.
    Simplified model Overallavailability Partial inspections Full inspections Probability of failure on demand Safety availability overall safety
  • 16.
    Practical consideration Componentfailure rate (standard databases) Safety system level failure rate (plant information system) Complex System model One component model Conception Design Implementation Operation & maintenance
  • 17.
  • 18.
    Redundancy and commoncause failures Design deficiency Material deficiency Common cause Independent Installation error Maintenance error Harsh environment 1- β 1- β β Comp. 1 Comp. 2    Conception Design Implementation Operation & maintenance
  • 19.
    Example 2out of 3 Pressure vessel lu 1 lu 2 pt 1 pt 2 pt 3 v 1 v 2
  • 20.
    Example single componentsafety system Full inspection 5% MTBF Inspection coverage 50% Sensitivity analysis   =partial inspection time/full inspection time  Time Instantaneous availability Partial insp. Partial insp. Full inspection Overall Availability 0 2 4 6 8 10 No. of partial inspections before renewal
  • 21.
    Complex system Failurerate (  10 6 hours) Common Cause Factor From:Hauge, S., et al., Reliability Prediction Method for safety Instrumented Systems; PDS Method Handbook, 2006 Edition.,SINTEF, Trondheim, Norway, 2006
  • 22.
  • 23.
    Results Safety availabilityPartial coverage Full coverage  =0.7  =1.0
  • 24.
    Number of partialinspections in a renewal cycle N
  • 25.
    Sensitivity analysis Nrof partial inspections Period between Partial inspections Optimal overall availability Attained safety availability
  • 26.
    Review Estimate maintenanceoptimal partial/full inspection intervals Assess Design safety systems architecture and component selection Maintenance Replacement and repair actions Conception Design Implementation Operation & maintenance