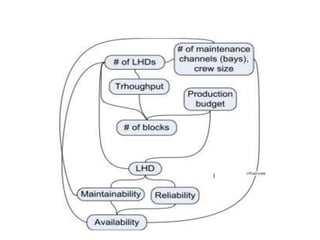
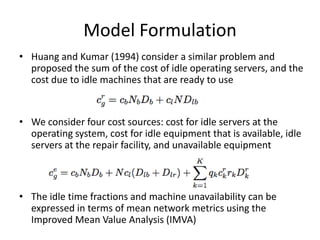
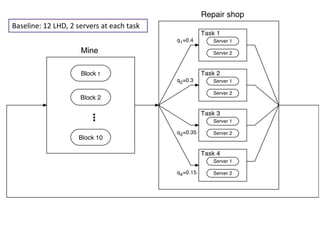
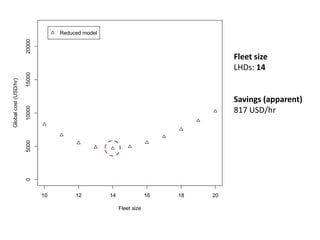
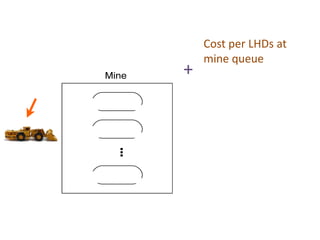
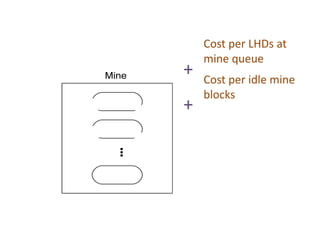
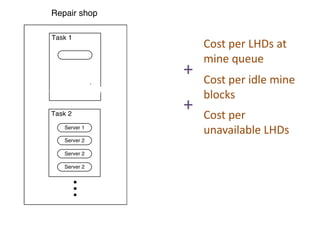
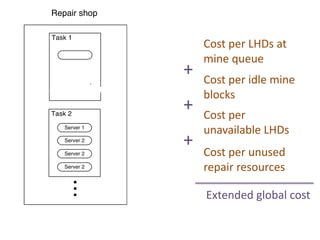
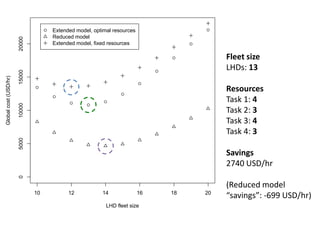
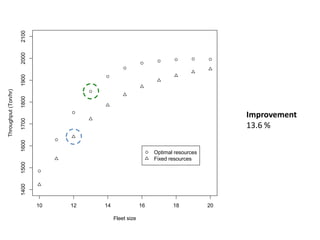
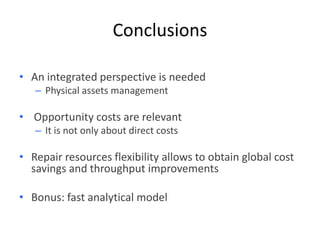
Mining Center - Department of Transport Engineering and Logistics
    Engineering School
    Pontificia Universidad Católica


A Joint optimization Approach for Determining
     Fleet Size and Maintenance Capacity


       Rodrigo Pascual, Alejandro Martínez,
                 Ricardo Giesen

      Workshop LAND TRANSLOG II, Puerto Varas, Chile, December, 2011
Outline

• Motivation

• Model Formulation

• Case Study

• Conclusions
Load-Haul-Dump
KPI Considered
Model Formulation
• Huang and Kumar (1994) consider a similar problem and
  proposed the sum of the cost of idle operating servers, and the
  cost due to idle machines that are ready to use


• We consider four cost sources: cost for idle servers at the
  operating system, cost for idle equipment that is available, idle
  servers at the repair facility, and unavailable equipment


• The idle time fractions and machine unavailability can be
  expressed in terms of mean network metrics using the
  Improved Mean Value Analysis (IMVA)
LHD cycle normalized times
Mine normalized times
Maintenance resources normalized times
Baseline: 12 LHD, 2 servers at each task
Case I
Mine centered analysis
Cost per LHDs at
    mine queue
+
Cost per LHDs at
    mine queue
+
    Cost per idle mine
    blocks

    Reduced global cost
Reduced model
                       20000


                                                                                     Fleet size
                                                                                     LHDs: 14
                       15000
Global cost (USD/hr)


                                                                                     Savings (apparent)
                       10000


                                                                                     817 USD/hr
                       5000
                       0


                               10        12         14                16   18   20

                                                         Fleet size
Case II
Production and repair: joint analysis
Cost per LHDs at
    mine queue
+
Cost per LHDs at
    mine queue
+   Cost per idle mine
    blocks
+
Cost per LHDs at
    mine queue
+   Cost per idle mine
    blocks
+   Cost per
    unavailable LHDs
Cost per LHDs at
    mine queue
+   Cost per idle mine
    blocks
+   Cost per
    unavailable LHDs
+
    Cost per unused
    repair resources

    Extended global cost
Extended model, optimal resources
                                    Reduced model
                       20000


                                    Extended model, fixed resources

                                                                                       Fleet size
                                                                                       LHDs: 13
                       15000
Global cost (USD/hr)


                                                                                       Resources
                                                                                       Task 1: 4
                       10000


                                                                                       Task 2: 3
                                                                                       Task 3: 4
                                                                                       Task 4: 3
                       5000


                                                                                       Savings
                                                                                       2740 USD/hr
                       0


                                                                                       (Reduced model
                               10         12           14               16   18   20
                                                                                       “savings”: -699 USD/hr)
                                                         LHD fleet size
2100
                      2000
                      1900
Throughput (Ton/hr)

                      1800


                                                                                       Improvement
                      1700


                                                                                       13.6 %
                      1600


                                                              Optimal resources
                                                              Fixed resources
                      1500
                      1400


                             10   12   14                16          18           20

                                            Fleet size
Conclusions

• An integrated perspective is needed
   – Physical assets management

• Opportunity costs are relevant
   – It is not only about direct costs

• Repair resources flexibility allows to obtain global cost
  savings and throughput improvements

• Bonus: fast analytical model
Mining Center - Department of Transport Engineering and Logistics
   Engineering School
   Pontificia Universidad Católica


                              Thanks!

A Joint optimization Approach for Determining
     Fleet Size and Maintenance Capacity

                Alejandro Martínez – amartin7@puc.cl
                Rodrigo Pascual – rpascual@ing.puc.cl
                  Ricardo Giesen– giesen@ing.puc.cl


     Workshop LAND TRANSLOG II, Puerto Varas, Chile, December, 2011

Pascual Martinez Giesen

  • 1.
    Mining Center -Department of Transport Engineering and Logistics Engineering School Pontificia Universidad Católica A Joint optimization Approach for Determining Fleet Size and Maintenance Capacity Rodrigo Pascual, Alejandro Martínez, Ricardo Giesen Workshop LAND TRANSLOG II, Puerto Varas, Chile, December, 2011
  • 2.
    Outline • Motivation • ModelFormulation • Case Study • Conclusions
  • 3.
  • 5.
  • 7.
    Model Formulation • Huangand Kumar (1994) consider a similar problem and proposed the sum of the cost of idle operating servers, and the cost due to idle machines that are ready to use • We consider four cost sources: cost for idle servers at the operating system, cost for idle equipment that is available, idle servers at the repair facility, and unavailable equipment • The idle time fractions and machine unavailability can be expressed in terms of mean network metrics using the Improved Mean Value Analysis (IMVA)
  • 8.
  • 9.
  • 10.
  • 11.
    Baseline: 12 LHD,2 servers at each task
  • 12.
  • 13.
    Cost per LHDsat mine queue +
  • 14.
    Cost per LHDsat mine queue + Cost per idle mine blocks Reduced global cost
  • 15.
    Reduced model 20000 Fleet size LHDs: 14 15000 Global cost (USD/hr) Savings (apparent) 10000 817 USD/hr 5000 0 10 12 14 16 18 20 Fleet size
  • 16.
    Case II Production andrepair: joint analysis
  • 18.
    Cost per LHDsat mine queue +
  • 19.
    Cost per LHDsat mine queue + Cost per idle mine blocks +
  • 20.
    Cost per LHDsat mine queue + Cost per idle mine blocks + Cost per unavailable LHDs
  • 21.
    Cost per LHDsat mine queue + Cost per idle mine blocks + Cost per unavailable LHDs + Cost per unused repair resources Extended global cost
  • 22.
    Extended model, optimalresources Reduced model 20000 Extended model, fixed resources Fleet size LHDs: 13 15000 Global cost (USD/hr) Resources Task 1: 4 10000 Task 2: 3 Task 3: 4 Task 4: 3 5000 Savings 2740 USD/hr 0 (Reduced model 10 12 14 16 18 20 “savings”: -699 USD/hr) LHD fleet size
  • 23.
    2100 2000 1900 Throughput (Ton/hr) 1800 Improvement 1700 13.6 % 1600 Optimal resources Fixed resources 1500 1400 10 12 14 16 18 20 Fleet size
  • 24.
    Conclusions • An integratedperspective is needed – Physical assets management • Opportunity costs are relevant – It is not only about direct costs • Repair resources flexibility allows to obtain global cost savings and throughput improvements • Bonus: fast analytical model
  • 25.
    Mining Center -Department of Transport Engineering and Logistics Engineering School Pontificia Universidad Católica Thanks! A Joint optimization Approach for Determining Fleet Size and Maintenance Capacity Alejandro Martínez – amartin7@puc.cl Rodrigo Pascual – rpascual@ing.puc.cl Ricardo Giesen– giesen@ing.puc.cl Workshop LAND TRANSLOG II, Puerto Varas, Chile, December, 2011

Editor's Notes

  • #3 A helpful extension for this work are fork-join networks. When multiple concurrent activities are performed in a station, in such a way that a customer leaves when all the activities are finished, the network is no longer of product form. These nodes are known as fork-join nodes. Dietz and Jenkins [13] extend the MVA to approximate the mean performance measures of these networks, to which we refer as IMVA.
  • #6 The goal of this work is to improve a cyclic transportation system performance by judicious joint resource assignment for fleet and maintenance capacity. We adopt a business centered multi-criteria analysis, considering production and maintenance areas in an integrated optimization methodology
  • #7 Three KPIs are considered under a balanced scorecard framework: global cost rate, machine availability and system throughput.The system’s KPI are obtained using an improved version of the Mean Value Analysis (IMVA) presented in D.C. Dietz, R.C. Jenkins , Analysis of Aircraft Sortie Generation with the Use of a Fork-Join Queueing Network Model, Naval Research Logistics, 44(2), pp. 153-164, 1997. Du and Hall [14] study the fleet size and distribution of transport equipment in complex networks.
  • #8 Fork-Join Queueing Network ModelA fork-join station offers several kinds of jobs (sub- stations) to an arriving machine. Each job has its own resources and waiting queue. When a machine enters a fork-join station i, it may enter each of the Ki sub-stations with fixed probabilities qik. This defines a set S of required jobs each time a machine enters. A machine leaves the fork-join station j when it has completed all the required jobs.
  • #9 We consider four cost sources: cost for idle servers at the operating system, cost for idle equipment that is available, idle servers at the repair facility, and unavailable equipmentWhere cb is the idle production servers cost rate (per server), cl the idle equipment cost rate, Nb is the number of production servers, N the number of machines, Db the idle time fraction of production blocks, and Dlb the idle time fraction of available machines due to queues at the production servers. Dlr the machine unavailability. For a job k, crk is the idle resource cost rate, rk are the resource units, and Dkr the idle resource fractionThe mean value analysis is an analytical method that allows an efficient estimation of steady-state expected performance measures of a closed or capacitated queuing network [13, 30]. It is suitable for product-form networks, with symmetric service disciplines (first come, first served exponential, processor sharing, infinite server, or last come, first served preemptive) [13]. The main principle of this method is to calculate the mean queue lengths, and other indicators such as service times, throughput and utilization rates. It does so recursively on the number of customer in the network.
  • #13 To illustrate the application of the model, we present a case study adapted from Huang et al. [5]. Let us consider an underground mining operation, with sub- level caving mining method (figure 4). There are 10 mining blocks producing fragmented ore. A fleet of 12 LHD has been assigned to the operation. At any given time, a LHD can be in any of the following four states: operating, idle at the block queue, idle at the maintenance queue, and being repaired. We as- sume the time between maintenance and repair actions λ follows an exponential distribution [3, 5, 29].