Download to read offline
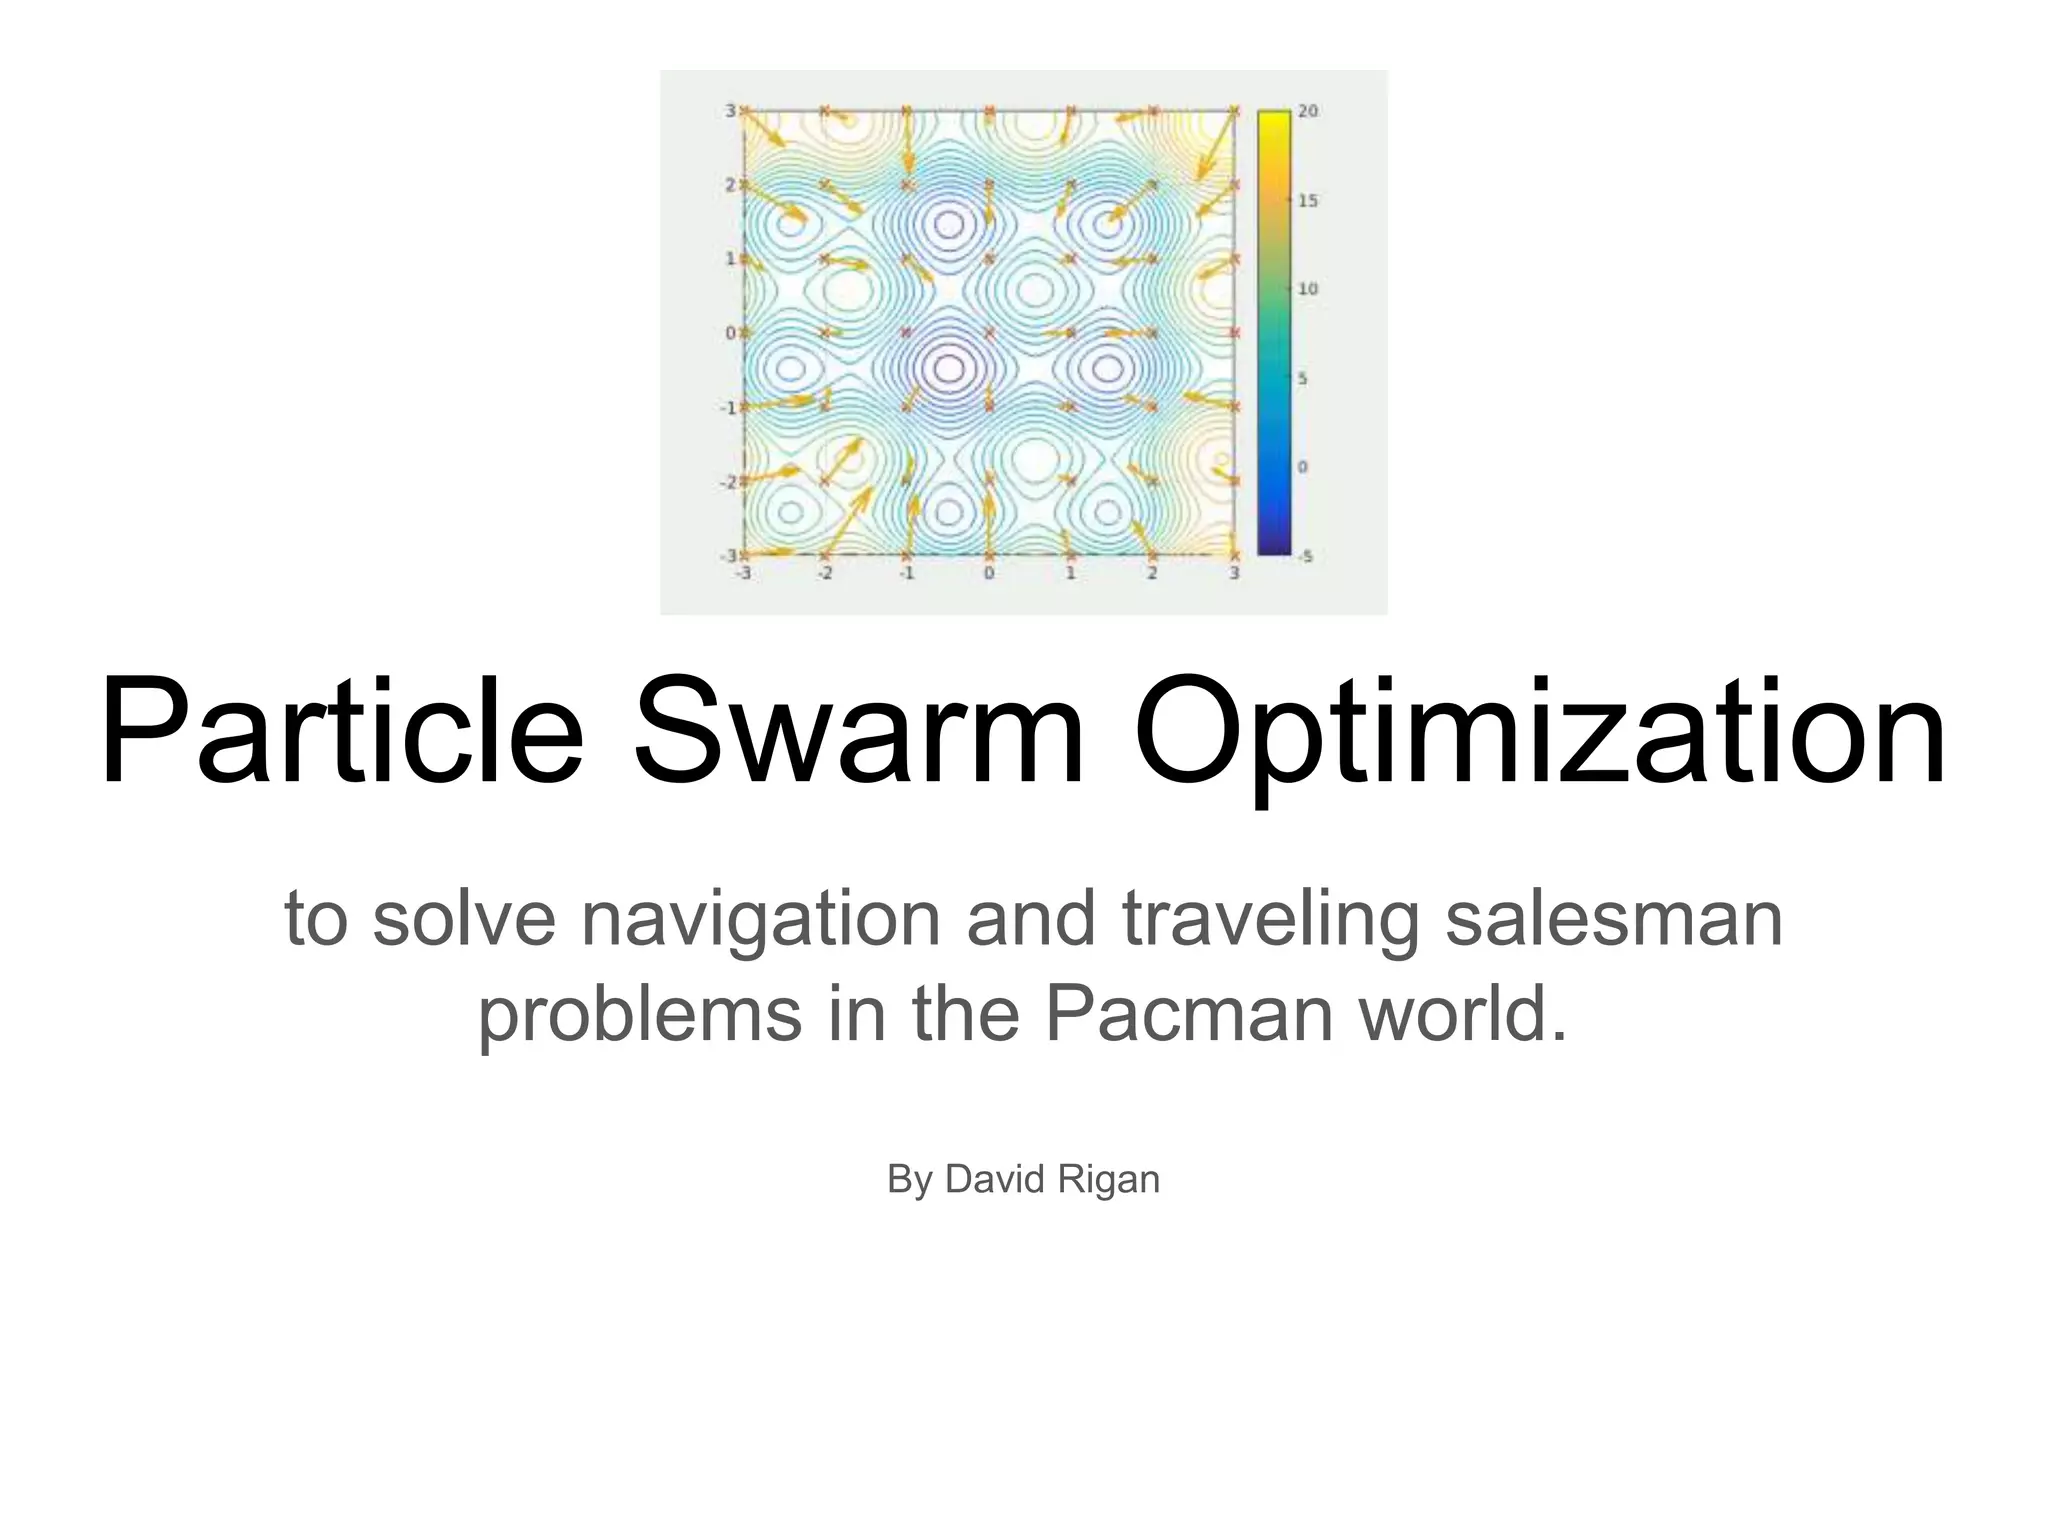
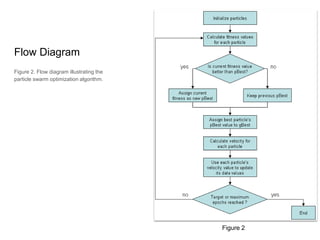
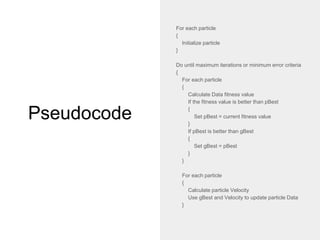
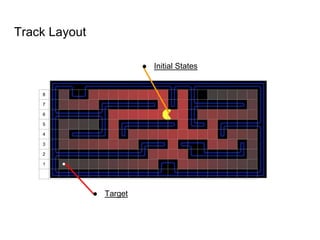
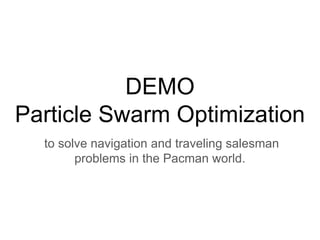

Particle Swarm Optimization (PSO) is an algorithm inspired by flocking behavior that was created in 1995 to solve optimization problems. It keeps track of the target value, the global best value of the particle closest to the target (gBest), and a stopping value. Each particle represents a possible solution and has a velocity, data, and personal best value (pBest) of how close it has come to the target. The algorithm initializes particles, calculates fitness values, updates personal and global best values, changes velocities to update data, and repeats until a maximum number of iterations or minimum error is reached. PSO can be used to solve navigation and traveling salesman problems in the Pacman video game world.