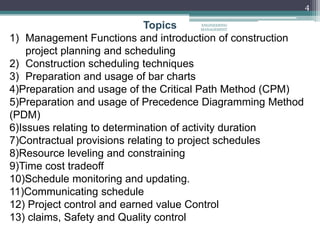
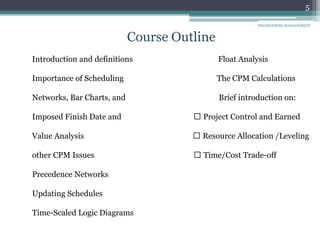
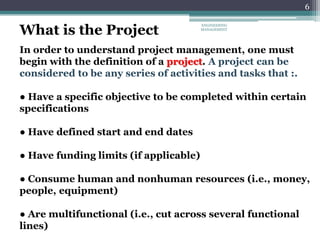
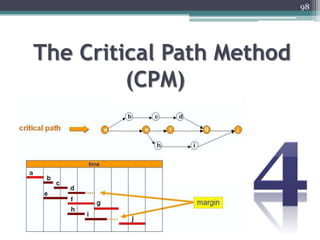
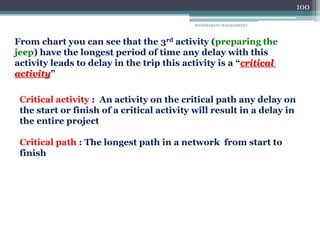
Biniam Zewdie G/Kidan *
•Haramaya Institute of University
P.O.Box:138; Dire Dawa, Ethiopia
•Mobile: +251910408218/+25191582832
•E-mail: nzg2001nzg@gmail.com/zewdienico@gmail.com
Engineering Project
Management
Department Agricultural Engineering (AGEN)
&
Department Water Resource and Irrigation Engineering(WRIE)
3
Your Expectations of Me
Be prepared
Be on time
Teach for full 50 minute period
Fair grading system
Front load the class work
Do not humiliate students
Practice golden rule
Provide real world examples
Make you think
4
Topics
1) Management Functions and introduction of construction
project planning and scheduling
2) Construction scheduling techniques
3) Preparation and usage of bar charts
4)Preparation and usage of the Critical Path Method (CPM)
5)Preparation and usage of Precedence Diagramming Method
(PDM)
6)Issues relating to determination of activity duration
7)Contractual provisions relating to project schedules
8)Resource leveling and constraining
9)Time cost tradeoff
10)Schedule monitoring and updating.
11)Communicating schedule
12) Project control and earned value Control
13) claims, Safety and Quality control
ENGINEERING
MANAGEMENT
5
Course Outline
Introduction and definitions Float Analysis
Importance of Scheduling The CPM Calculations
Networks, Bar Charts, and Brief introduction on:
Imposed Finish Date and Project Control and Earned
Value Analysis Resource Allocation /Leveling
other CPM Issues Time/Cost Trade-off
Precedence Networks
Updating Schedules
Time-Scaled Logic Diagrams
ENGINEERING MANAGEMENT
6
In order to understand project management, one must
begin with the definition of a project. A project can be
considered to be any series of activities and tasks that :.
● Have a specific objective to be completed within certain
specifications
● Have defined start and end dates
● Have funding limits (if applicable)
● Consume human and nonhuman resources (i.e., money,
people, equipment)
● Are multifunctional (i.e., cut across several functional
lines)
What is the Project
ENGINEERING
MANAGEMENT
7
OR
‘‘a temporary endeavor undertaken to create
a unique product, service, or result’’
ENGINEERING
MANAGEMENT
ENGINEERING
MANAGEMENT
8
9
Table 1-1. Comparative Overview of Project, Program, and Portfolio Management
ENGINEERING
MANAGEMENT
10
Objectives of Water Resources Management
The goal of the water resources management is sustainable
water use.
In order to achieve the effective and sustainable water
resources management, items which shall be required for the
proper monitoring, evaluating and controlling works are
summarized as follows;
a) Water quantity
b) Water quality
c) Hydro-meteorological and hydro-geological network
d) Drought management
(Reservoir operation/ Water diversion)
e) Watershed management
(Drainage water regulation/Forest protection/Land
conservation)
f) Facilities maintenance
11
ENGINEERING MANAGEMENT
Project Life
Cycle
12
Five Process group
Project initiation
● Selection of the best project
given resource limits
● Recognizing the benefits of
the project
● Preparation of the
documents to sanction the
project
● Assigning of the project manager
Project planning
● Definition of the work
requirements
● Definition of the quality and
quantity of work
● Definition of the resources needed
● Scheduling the activities
● Evaluation of the various risks
Project execution
● Negotiating for the project
team members
● Directing and managing the
work
● Working with the team
members to help them improve
Project monitoring and control
● Tracking progress
● Comparing actual outcome to
predicted outcome
● Analyzing variances and
impacts
● Making adjustments
Project closure
● Verifying that all of the work has
been accomplished
● Contractual closure of the contract
● Financial closure of the charge
numbers
● Administrative closure of the paper
work
ENGINEERING MANAGEMENT
ENGINEERING
MANAGEMENT
13
ENGINEERING
MANAGEMENT
14
ENGINEERING
MANAGEMENT
15
16
ENGINEERING
MANAGEMENT
ENGINEERING
MANAGEMENT
17
ENGINEERING
MANAGEMENT
18
ENGINEERING
MANAGEMENT
19
20
Successful project management can then be defined as
having achieved the project objectives:
● Within Time
● Within Cost
● At the desired performance/Technology level
● While utilizing the assigned resources effectively
and efficiently
● Accepted by the customer
ENGINEERING
MANAGEMENT
ENGINEERING
MANAGEMENT
21
22
What is Project Management
Project management is the planning, organizing, directing,
and controlling of company resources for a relatively
short-term objective that has been established to complete
specific goals and objectives.
ENGINEERING
MANAGEMENT
23
The potential benefits from project
management are:
● Identification of functional responsibilities
● Minimizing the need for continuous reporting
● Identification of time limits for scheduling
● Identification of a methodology for
trade-off analysis.
● Measurement of accomplishment
against plans
ENGINEERING
MANAGEMENT
ENGINEERING
MANAGEMENT
24
25
The above definition requires further comment. Classical
management is usually considered to have five functions
or principles:
● Planning
● Organizing
● Staffing
● Controlling
● Directing
ENGINEERING
MANAGEMENT
26
Planning
– Where the organization wants to be in the
future and how to get there.
Organizing
– Follows planning and reflects how the
organization tries to accomplish the plan.
– Involves the assignment of tasks, grouping of
tasks into departments, and allocation of resources.
ENGINEERING
MANAGEMENT
27
Leading
– The use of influence to motivate employees to
achieve the organization's goals.
– Creating a shared culture and values,
communicating goals to employees throughout
the organization, and infusing employees to
perform at a high level.
Controlling
– Monitoring employees' activities, determining if
the organization is on target toward its goals, and
making corrections as necessary
ENGINEERING
MANAGEMENT
ENGINEERING
MANAGEMENT
28
ENGINEERING
MANAGEMENT
29
30
Conceptual Skill—the ability to see the
organization as a whole and the relationship
between its parts.
Human Skill—The ability to work with and
through people.
Technical Skill—Mastery of specific
functions and specialized knowledge
Management Skills
ENGINEERING
MANAGEMENT
ENGINEERING
MANAGEMENT
31
ENGINEERING
MANAGEMENT
32
ENGINEERING
MANAGEMENT
33
34
Project management is designed to manage or control
company resources on a given activity, within time, within
cost, and within performance. Time, cost, and performance
are the constraints on the project.
Constraints of the project
ENGINEERING
MANAGEMENT
ENGINEERING
MANAGEMENT
35
ENGINEERING
MANAGEMENT
36
37
Resources
We have stated that the project manager must control company
resources within time, cost, and performance. Most companies have
six resources:
● Money
● Manpower
● Equipment
● Facilities
● Materials
● Information/technology
ENGINEERING
MANAGEMENT
ENGINEERING
MANAGEMENT
38
39
Actually, the project manager does not control
any of these resources directly, except perhaps
money (i.e., the project budget).
Resources are controlled by the line managers .
The project manager is responsible for
coordinating and integrating activities across
multiple, functional lines. The integration
activities performed by the project manager
include:
ENGINEERING
MANAGEMENT
40
● Integrating the activities necessary to develop a project plan
● Integrating the activities necessary to execute the plan
● Integrating the activities necessary to make changes to the plan
ENGINEERING
MANAGEMENT
Monitoring versus Evaluation
Monitoring
• Data collected on
program activities
• Ongoing, routine
• Focus on activities and
output, compared to
target
Are we doing the work
we planned?
Evaluation
• Data collected to answer
specific questions
• Periodic
• Focus on outcome,
impact
How effective were our
activities?
42
Project Scheduling Planning,
Scheduling, and Control
ENGINEERING
MANAGEMENT
43
Planning and Scheduling
Planning and scheduling are two terms that are
often thought of as synonymous
 They are not!
 Scheduling is just one part of the planning effort.
ENGINEERING
MANAGEMENT
44
 Project planning serves as a foundation for several
related functions such as cost estimating, scheduling,
and project control.
 Project scheduling is the determination of the
timing and sequence of operations in the project
and their assembly to give the overall completion
time
ENGINEERING
MANAGEMENT
45
Planning is the process of determining how a
project will be undertaken. It answers the
questions:
1. “What” is going to be done,
2. “how”,
3. “where”,
4. By “whom”, and
5. “when” (in general terms: start and finish).
Scheduling deals with “when” on a detailed
level… See Figure 1 .
ENGINEERING
MANAGEMENT
46
The Plan
What
How
much
By
whom
where
Why
How
when
Figure 1 . Planning and Scheduling
ENGINEERING
MANAGEMENT
47
The Plan
PMI defines project management plan as a ‘‘formal,
approved document that defines how the project is executed,
monitored and controlled”.
The plan can include elements that has to do with
scope, design and alternate designs, cost, time,
finance, land, procurement, operations, etc.
ENGINEERING
MANAGEMENT
48
WHY SCHEDUALE PROJECTS ?
1- To calculate the project completion.
2- To calculate the start or end of a specific activity.
3-To expose and adjust conflict between trades or
subcontractor.
4- To predict and calculate the cash flow .
5-To evaluate the effect of changing orders ‘CH’ .
ENGINEERING MANAGEMENT
49
6- To improve work efficiency.
7- To resolve delay claims , this is important in
critical path method ‘CPM’ discussed later..
8- To serve as an effective project control tool .
ENGINEERING
MANAGEMENT
50
The Tripod of Good Scheduling System
1. The Human Factor : A proficient scheduler or
scheduling team.
2. The Technology : A good scheduling computer
system (software and hardware)
3. The Management : A dynamic, responsive, and
supportive management.
 If anyone of the above three ‘‘legs’’ is missing, the system
will fail.
ENGINEERING
MANAGEMENT
51
Scheduling and project management
Planning, scheduling, and project control are extremely
important components of project management.
project management includes other components :
• cost estimating and management,
• procurement,
• project/contract administration,
• quality management,
• and safety management.
 These components are all interrelated in different ways.
ENGINEERING
MANAGEMENT
52
Bar (Gantt) Charts
ENGINEERING
MANAGEMENT
53
DEFINITION AND INTRODUCTION
• A bar chart is ‘‘a graphic representation of project
activities, shown in a time-scaled bar line with no
links shown between activities’’
 The bar may not indicate continuous work from
the start of the activity until its end.
or
 Non continuous (dashed) bars are sometimes
used to distinguish between real work (solid line)
and inactive periods (gaps between solid lines)
ENGINEERING
MANAGEMENT
54
• Before a bar chart can be constructed for a
project, the project must be broken into
smaller, usually homogeneous components,
each of which is called an activity, or a task.
Item Activity
M 10 Mobilization
Bars ( Month or Year )
ENGINEERING
MANAGEMENT
55
ADVANTAGES OF BAR CHARTS
1- Time-scaled
2- Simple to prepare
3- Can be more effective and efficient if CPM based
- Still the most popular method
4- Bars can be dashed to indicate work stoppage.
5- Can be loaded with other information (budget,
man hours, resources, etc.)
ENGINEERING
MANAGEMENT
56
Bar Charts Loaded with More Info.
Such as : budget, man hours and resources .
10 12 7 11 10 9 15
500$
220$
400$
850$
140$
500$
900$
ENGINEERING
MANAGEMENT
57
DISADVANTAGES OF BAR CHARTS
1- Does not show logic
2- Not practical for projects with too many
activities
- As a remedy, we can use bar charts to show:
1. A small group of the activities (subset)
2. Summary schedules
ENGINEERING
MANAGEMENT
58
Basic Networks
ENGINEERING
MANAGEMENT
59
DEFINITION AND INTRODUCTION
• A network is a logical and chronological graphic
representation of the activities (and events)
composing a project.
• Network diagrams are the preferred technique for
showing activity sequencing.
• Two main formats are the arrow and precedence
diagramming methods.
ENGINEERING
MANAGEMENT
60
Two classic formats
AOA: Activity on Arrow
AON: Activity on Node
Each task labeled with
Identifier (usually a letter/code)
Duration (in std. unit like days)
There are other variations of labeling
There is 1 start & 1 end event
Time goes from left to right
ENGINEERING
MANAGEMENT
61
Arrow Diagramming Method (ADM)
1. Also called activity-on-arrow (AOA) network
diagram or (I-J) method (because activities are
defined by the form node, I, and the to node, J)
2. Activities are represented by arrows.
3. Nodes or circles are the starting and ending
points of activities.
4. Can only show finish-to-start dependencies.
ENGINEERING
MANAGEMENT
62
i j
(a) Basic Activity
Activity Name
Node (Event) i
j > i
Each activity should have a unique i – j value
Node (Event) j
Basic Logic Patterns for Arrow Diagrams
ENGINEERING
MANAGEMENT
63
2
A
(b) Independent Activities
4 10
B
12
3 A
6 B
9
(c) Dependent Activities
ENGINEERING
MANAGEMENT
64
2
A
(d) A Merge
4
6
B 8
(e) A Burst
C
Activity C depends upon the completion of both Activities A & B
8
A
6
2
B
4
C
Activities B and C both depend upon the completion of Activity A
ENGINEERING
MANAGEMENT
65
(f) A Cross
20
18
C
16 D
14
A
12
B
Activities C and D both depend upon the completion of Activities A and B
ENGINEERING
MANAGEMENT
66
Example
Draw the arrow network for the project given next.
IPA
Activity
-
A
A
B
A
C
B
D
C,D
E
ENGINEERING
MANAGEMENT
67
Solution :
10
30
40
20 50
C
D
A
B
E
ENGINEERING
MANAGEMENT
68
Dummy activity (fictitious)
* Used to maintain unique numbering of activities.
* Used to complete logic, duration of “0”
* The use of dummy to maintain unique numbering of
activities.
ENGINEERING
MANAGEMENT
69
4 10
4 10
11
A
B
A
B
Divide node to correct
Dummy
(a) Incorrect Representation
(b) Correct Representation
ENGINEERING
MANAGEMENT
70
Example
Draw the arrow network for the project given next.
IPA
Activity
-
A
A
B
A
C
B,C
D
ENGINEERING
MANAGEMENT
71
10 30
20 40
C
D
A
B
Solution :
10
30
40
20 50
C
D
A
B
Dummy
Improper solution
proper solution
ENGINEERING
MANAGEMENT
72
72
72
Example
Draw the arrow network for the project given next.
IPA
Activity
-
A
A
B
A
C
B
D
B,C
E
C
F
ENGINEERING
MANAGEMENT
73
Solution :
10
30
40
20 60
C
E
A
B
Dummy 1
50
Dummy 2
D
F
ENGINEERING
MANAGEMENT
74
Removal of Redundant Dummies
A
A
A
A
B
B
B
B
C C
Original Diagram Diagram after removal
of redundant dummies
(a)
(b)
ENGINEERING
MANAGEMENT
75
A
A
A
A
C
C
B
C
B B
Original Diagram Diagram after removal
of redundant dummies
(c)
(d)
B E
C
E
E E
ENGINEERING
MANAGEMENT
76
Immediately Preceding
Activity (IPA)
Depends Upon
Activity
-----
A
B
-----
A
A, B
A
B
C
B C
A
Redundant
Relationship
ENGINEERING
MANAGEMENT
77
Activity List with Dependencies:
Depends Upon
Description
Activity
-----
-----
A
A, B, C
A, B, C
B, C, J, M
B, C, D, E, K
D, E, F, G, L
-----
-----
-----
-----
Site Clearing
Removal of Trees
Excavation for Foundations
Site Grading
Excavation for Utility Trenches
Placing formwork & Reinforcement
Installing sewer lines
Pouring concrete
Obtain formwork & reinforcing steel
Obtain sewer lines
Obtain concrete
Steelworker availability
A
B
C
D
E
F
G
H
J
K
L
M
ENGINEERING
MANAGEMENT
78
Depends Upon
Description
Activity
-----
-----
A
A, B, C
A, B, C
B, C, J, M
B, C, D, E, K
D, E, F, G, L
-----
-----
-----
-----
Site Clearing
Removal of Trees
Excavation for Foundations
Site Grading
Excavation for Utility Trenches
Placing formwork & Reinforcement
Installing sewer lines
Pouring concrete
Obtain formwork & reinforcing steel
Obtain sewer lines
Obtain concrete
Steelworker availability
A
B
C
D
E
F
G
H
J
K
L
M
Removing Redundant Relationships:
ENGINEERING
MANAGEMENT
79
AOA Representation
H
40
G
45
C
F
D
35
15
10
5
B
A
20
M
25
J
30
E
L
K
ENGINEERING
MANAGEMENT
80
NODE NETWORKS MTHOD (AON)
a) Independent Activities
10
A
20
B
Activity number
Activity name
b) Dependent Activities
20
B
10
A
Link
Link
B depends on A
ENGINEERING
MANAGEMENT
81
30
C
10
A
20
B
40
D
c) A Merge Relationship
C depends on A & B
D depends on C
d) A Burst Relationship
20
B
30
C
40
D
10
A
B depends on A
C depends on B
D depends on B
ENGINEERING
MANAGEMENT
82
e) Start & Finish Dummy Activities
A
C
B
E
D
A
Start
Dummy
Finish
Dummy
C
B
E
D
ENGINEERING
MANAGEMENT
83
83
Example
Draw the arrow network for the project given next.
IPA
Activity
-
A
A
B
A
C
B
D
C,D
E
ENGINEERING MANAGEMENT
84
Solution :
A E
C
D
B
ENGINEERING MANAGEMENT
85
85
Example
Draw the arrow network for the project given next.
IPA
Activity
-
A
A
B
A
C
B,C
D
ENGINEERING MANAGEMENT
86
A
C
D
B
Solution :
ENGINEERING MANAGEMENT
87
87
87
87
Example
Draw the arrow network for the project given next.
IPA
Activity
-
A
A
B
A
C
B
D
B,C
E
C
F
ENGINEERING MANAGEMENT
88
Solution :
A PF
C
D
B
E
F
ENGINEERING MANAGEMENT
89
ENGINEERING MANAGEMENT
Lags and Leads
In some situations, an activity cannot start until a
certain time after the end of its Predecessor.
Lag is defined as a minimum waiting period
between the finish (or start) of an activity and the
start (or finish) of its successor.
Arrow networks cannot accommodate lags. The
only solution in such networks is to treat it as a real
activity with a real duration, no resources, and a $0
budget.
ENGINEERING MANAGEMENT
90
Examples
Place Concrete
3
Strips Forms
2
3
A lag in a node network
Place Concrete Strips Forms
Cure Concrete
A lag in an arrow network
ENGINEERING MANAGEMENT
91
The term lead simply means a negative lag. It is
seldom used in construction. In simple language: A
positive time gap (lag) means ‘‘after’’ and a negative
time gap (lead) means ‘‘before.’’
ENGINEERING MANAGEMENT
92
Recommendations for Proper Node Diagram Drawing
Incorrect Correct
ENGINEERING MANAGEMENT
93
A
B A B
A
B
A
B
Improper proper
ENGINEERING MANAGEMENT
94
Improper Proper
ENGINEERING MANAGEMENT
95
Improper Proper
ENGINEERING MANAGEMENT
96
A
B
C
Improper Proper
A
B
C
PS
(a) Do not start a network with more than one node
ENGINEERING MANAGEMENT
97
A
B
C
Improper Proper
A
B
C
PF
(a) Do not end a network with more than one node
98
The Critical Path Method
(CPM)
ENGINEERING MANAGEMENT
99
Suppose you decide with your friend to go in
hunting trip.
You must do specific activity such that the trip well
be at the right way. The following activity must be
done.
Introduction
ENGINEERING MANAGEMENT
100
From chart you can see that the 3rd activity (preparing the
jeep) have the longest period of time any delay with this
activity leads to delay in the trip this activity is a “critical
activity”
Critical activity : An activity on the critical path any delay on
the start or finish of a critical activity will result in a delay in
the entire project
Critical path : The longest path in a network from start to
finish
ENGINEERING MANAGEMENT
101
Steps Required To Schedule a Project
The preparation of CPM includes the following four steps:
1- Determine the work activities:
The project must be divided into smaller activities
or tasks .
The activity shouldn’t be more than 14-20
days (long durations should be avoided)
Use WBS in scheduling by using an order of
letters and numbers
ENGINEERING MANAGEMENT
102
2- Determine activity duration:
Duration = Total Quantity / Crew Productivity
The productivity has many sources :
1. The company
2. The market
3. Special books
Note: The scheduler must be aware about the non-working days ,
such as holydays or rain days, etc……
ENGINEERING MANAGEMENT
103
3- Determine the logical relationships :
This step is a technical matter and obtained
from the project manager and technical team,
and logical relationships shouldn’t confused
with constraints
4- Draw the logic network and perform the CPM
calculations
ENGINEERING MANAGEMENT
104
5-Reiew and analyze the schedule:
1. review the logic
2. Make sure the activity has the correct predecessor
3. make sure there is no redundant activity
ENGINEERING MANAGEMENT
105
6- Implement the schedule:
Definition: take the schedule from paper to the execution.
7-Monitor and control the schedule:
Definition: comparing what we planed with what
actually done.
8-Revise the database and record feedback.
9-Resource allocation and leveling.
(will discuss in chapter 6)
ENGINEERING MANAGEMENT
106
Example
Draw the logic network and perform the CPM calculations for the
schedule shown next.
Duration
IPA
Activity
5
-
A
8
A
B
6
A
C
9
B
D
6
B,C
E
3
C
F
1
D,E,F
G
ENGINEERING MANAGEMENT
107
In mathematical terms, the ES for activity j is as follows :
ESj =max( EFi )
where (EFi) represents the EF for all preceding activities.
Likewise, the EF time for activity j is as follows :
EF j= ESj + Dur j
where Dur j is the duration of activity j
Forward pass: The process of navigating through a
network from start to end and calculating the completion date
for the project and the early dates for each activity
Forward pass calculations
ENGINEERING MANAGEMENT
108
A
5
G
1
C
6
D
9
B
8
E
6
F
3
22,23
5,11
5,13 13,22
13,19
11,14
0,5
Solution :
ENGINEERING MANAGEMENT
109
In mathematical terms, the late finish LF for activity j is as follows :
(
LFj =min(LSk
where (LSk) represents the late start date for all succeeding
activities.
Likewise, the LS time for activity j (LS j) is as follows :
LS j= LFj - Dur j
where Dur j is the duration of activity
Backward pass: The process of navigating through a network
from end to start and calculating the late dates for each activity. The
late dates (along with the early dates) determine the critical activities,
the critical path, and the amount of float each activity has.
Backward pass calculations
ENGINEERING MANAGEMENT
110
Solution :
A
5
G
1
C
6
D
9
B
8
E
6
F
3
22,23
5,11
5,13 13,22
13,19
11,14
0,5
22,23
13,22
19,22
16,22
5,13
10,16
0,5
CPM ( ES = LS , EF = LF , TF = FF = 0)
ENGINEERING MANAGEMENT
111
Four Types Of Floats
There are several types of float. The simplest and most
important type of float is Total Float (TF)
 Total float (TF): The maximum amount of time
an activity can be delayed from its early start
without delaying the entire project.
TF = LS – ES
or
TF = LF - EF
or
TF = LF - Dur - ES
ENGINEERING MANAGEMENT
112
 Free Float: may be defined as the maximum
amount of time an activity can be delayed without
delaying the early start of the succeeding activities
FFi = min(ESi+1) - EFi
where min (ESi+1) means the least (i.e., earliest) of the early start
dates of succeeding activities
ENGINEERING MANAGEMENT
113
In the previous example we can find the free float and total float for
each activity as the following :
Activity C’s free float, FF = 11 - 11 = 0 days
And
Activity C’s total float, TF =16 - 11= 5 days …… and so on.
FF
TF
LF
LS
EF
ES
Duration
Activity
0
0
5
0
5
0
5
A
0
0
13
5
13
5
8
B
0
5
16
10
11
5
6
C
0
0
22
13
22
13
9
D
3
3
22
16
19
13
6
E
8
8
22
19
14
11
3
F
0
0
23
22
23
22
1
G
 Critical activity
 Note : We must always realize that FF ≤ TF
ENGINEERING MANAGEMENT
114
 Interfering float: may be defined as the maximum
amount of time an activity can be delayed without
delaying the entire project but causing delay to the
succeeding activities.
TF = FF - Int. or Int. F = TF - FF
 Independent float (Ind. F): we may define it as
the maximum amount of time an activity can be
delayed without delaying the early start of the
succeeding activities and without being affected
by the allowable delay of the preceding activities.
Ind. Fi = min(ESi+1) – max(LFi-1) – Duri
Note: make sure that Ind. F ≤ FF
ENGINEERING MANAGEMENT
115
Node Format
Activity Name
Activity ID
Duration
ES EF
LS LF
TF FF
ENGINEERING MANAGEMENT
116
Event Times in Arrow Networks
 The early event time, TE, is the largest (latest) date
obtained to reach an event (going from start to finish).
 The late event time, TL, is the smallest (earliest) date
obtained to reach an event (going from finish to start).
Examples
Perform the CPM calculations, including the event times, for the arrow
network shown below.
ENGINEERING MANAGEMENT
117
10 30
40
20 60
C
E
B
50
D
F
70
A
G
H
10
5
7
8
9
4
5
8
d1
d2
Arrow network for example
ENGINEERING MANAGEMENT
118
The preceding logic is similar to that of the forward and backward
passes: When you are going forward, pick the largest number.
When you are going backward, pick the smallest number.
i j
Act. Name
Dur.
TEi
TLi
TEj
TLj
CPM
ENGINEERING MANAGEMENT
119
10 30
40
20 60
C
E
B
50
D
F
70
A
G
H
10
5
7
8
9
4
5
8
d1
d2
10
10
7
0
0
15
10
10
19
19
24
27
27
27
(0,10)
(0,10)
(5,10)
(0,5)
(0,7)
(8,15)
(10,18)
(11,19)
(10,19)
(10,19)
(7,11)
(15,19)
(19,24)
(22,27)
(19,27)
(19,27)
ENGINEERING MANAGEMENT
120
Float Calculations From Event Times
Total Float
TFij = TLj - TEi - Tij
Example ( In the previous network )
TF40-50 = TL50 – TE40 – T40-50
= 19 – 7 – 4 = 8
ENGINEERING MANAGEMENT
121
Free Float
FFij = TEj - TEi – Tij
Example
FF40-50 = TE50 – TE40 – T40-50
= 19 – 7 – 4 = 8
ENGINEERING MANAGEMENT
122
Interfering Float
INTFij = TLj – TEj
Example
INTF40-50 = TL50 – TE50
= 19 – 19 = 0
Independent Float
INDFij= TEj – TLi - Tij
Example
INDF40-50 = TE50 – TL40 – T40-50
= 19 – 15 – 4 = 0
ENGINEERING MANAGEMENT
123
Summary
i j
T
TEi
TLi
TEj
TLj
Float
Direction
TF
FF
Int. F
Ind. F
ENGINEERING MANAGEMENT
124
Definitions
Activity, or task: A basic unit of work as part of the total project
that is easily measured and controlled. It is time- and resource
consuming.
Backward pass: The process of navigating through a network from
end to start and calculating the late dates for each activity. The late
dates (along with the early dates) determine the critical activities,
the critical path, and the amount of float each activity has.
Critical activity: An activity on the critical path. Any delay in the
start or finish of a critical activity will result in a delay in the entire
project.
Critical path: The longest path in a network, from start to finish,
including lags and constraints.
ENGINEERING MANAGEMENT
125
Early dates: The early start date and early finish date of an activity.
Early finish (EF): The earliest date on which an activity can finish within project
constraints.
Early start (ES): The earliest date on which an activity can start within project
constraints.
Event: A point in time marking a start or an end of an activity. In contrast to an
activity, an event does not consume time or resources.
Forward pass: The process of navigating through a network from start to end and
calculating the completion date for the project and the early dates for each activity.
Late dates: The late start date and late finish date of an activity.
Late finish (LF): The latest date on which an activity can finish without extending
the project duration.
Late start (LS): The latest date on which an activity can start without extending the
project duration.
126
Precedence Diagram
ENGINEERING MANAGEMENT
127
The Four Types Relationships
Activities represented by nodes and links that
allow the use of four relationships:
1) Finish to Start – FS
2) Start to Finish – SF
3) Finish to Finish – FF
4) Start to Start – SS
ENGINEERING MANAGEMENT
128
Finish to Start (FS) Relationship
. The traditional relationship between activities.
. Implies that the preceding activity must finish
before the succeeding activities can start.
. Example: the plaster must be finished before the
tile can start.
Plaster Tile
ENGINEERING MANAGEMENT
129
Star to Finish (SF) Relationship
. Appear illogical or irrational.
. Typically used with delay time OR LAG.
. The following examples proofs that its logical.
steel
reinforcement
Erect
formwork
Order
concrete
SF
Pour
concrete
5
ENGINEERING MANAGEMENT
130
Finish to Finish (FF) Relationship
• Both activities must finish at the same time.
• Can be used where activities can overlap to a
certain limit.
Erect
scaffolding
Remove
Old paint
sanding
painting inspect
Dismantle
scaffolding
FF/1
FF/2
ENGINEERING MANAGEMENT
131
Start to Start (SS) Relationship
• This method is uncommon and non exists in
project construction .
Spread grout
Clean surface
Set tile
SS
Clean floor area
ENGINEERING MANAGEMENT
132
Advantages of using Precedence Diagram
1. No dummy activities are required.
2. A single number can be assigned to identify each
activity.
3. Analytical solution is simpler.
ENGINEERING MANAGEMENT
133
Calculation
1) forward calculations
EF = ES + D
Calculate the Lag
LAGAB = ESB – EFA
Calculate the Free Float
FF = Min. (LAG)
ENGINEERING MANAGEMENT
134
2) Backward calculations
For the last task
LF=EF , if no information deny that.
LS=LF-D
Calculate Total Float
TF = LS – ES OR LF – EF
TFi = Min (lag ij + TFj )
Determine the Critical Path
ENGINEERING MANAGEMENT
135
Example
135
Dur.
ES
EF FF TF LF
LS
A
1 1
2
0
0
2
1
B
9 2
11
0
0
11
2
D
5 11
16
0
0
16
11 4 16
20
0
0
20
16 1 20
21
0
0
21
20
F H
C
5 5
10
3
0
7
2
E
4 10
14
3
0
11
7 6 14
20
3
3
17
11
G
5
4 3
1) Forward pass calculations 4) Backward pass calculations
2) Calculate the Lag ( LAGAB = ESB – EFA)
0
0 0 0 0
0 0
3) Calculate the Free Float (FF) FF = min.( LAG)
5) Calculate total Float (TF = LS – ES OR LF – EF)
ENGINEERING MANAGEMENT
136
136
Dur.
ES
EF FF TF LF
LS
A
1 1
2
0
0
2
1
B
9 2
11
0
0
11
2
D
5 11
16
0
0
16
11 4 16
20
0
0
20
16 1 20
21
0
0
21
20
F H
C
5 5
10
3
0
7
2
E
4 10
14
3
0
11
7 6 14
20
3
3
17
11
G
5
4 3
6) Determine the Critical Path
0
0 0 0 0
0 0
The critical path passes through the critical activities where TF = 0
137
Resource Allocation and
Resource Leveling
ENGINEERING MANAGEMENT
138
CATEGORIES OF RESOURCES
 Labor
 Materials
 Equipment's.
Schedule Updating and Project Control
139
140
Schedule Updating and Project Control
The most important use of schedules is project control :
the scheduler compares actual performance with baseline
performance.
What is Project Control
Project control comprises the following continuous process
1. monitoring work progress .
2.comparing it with the baseline schedule and budget.
3.finding any deviations .
4.taking corrective actions.
ENGINEERING MANAGEMENT
141
Schedule updating
Schedule updating is just one part of the project
control process.
Schedule updating must reflect
 Actual work , and
 involves change orders (CO) .
ENGINEERING MANAGEMENT
142
ENGINEERING MANAGEMENT
Evaluation Questions: main questions and sub-questions
ENGINEERING
MANAGEMENT
143
ENGINEERING
MANAGEMENT
144
145
146
ENGINEERING
MANAGEMENT
147

PART- 2: Engineering Project Management

  • 1.
    Biniam Zewdie G/Kidan* •Haramaya Institute of University P.O.Box:138; Dire Dawa, Ethiopia •Mobile: +251910408218/+25191582832 •E-mail: nzg2001nzg@gmail.com/zewdienico@gmail.com
  • 2.
    Engineering Project Management Department AgriculturalEngineering (AGEN) & Department Water Resource and Irrigation Engineering(WRIE)
  • 3.
    3 Your Expectations ofMe Be prepared Be on time Teach for full 50 minute period Fair grading system Front load the class work Do not humiliate students Practice golden rule Provide real world examples Make you think
  • 4.
    4 Topics 1) Management Functionsand introduction of construction project planning and scheduling 2) Construction scheduling techniques 3) Preparation and usage of bar charts 4)Preparation and usage of the Critical Path Method (CPM) 5)Preparation and usage of Precedence Diagramming Method (PDM) 6)Issues relating to determination of activity duration 7)Contractual provisions relating to project schedules 8)Resource leveling and constraining 9)Time cost tradeoff 10)Schedule monitoring and updating. 11)Communicating schedule 12) Project control and earned value Control 13) claims, Safety and Quality control ENGINEERING MANAGEMENT
  • 5.
    5 Course Outline Introduction anddefinitions Float Analysis Importance of Scheduling The CPM Calculations Networks, Bar Charts, and Brief introduction on: Imposed Finish Date and Project Control and Earned Value Analysis Resource Allocation /Leveling other CPM Issues Time/Cost Trade-off Precedence Networks Updating Schedules Time-Scaled Logic Diagrams ENGINEERING MANAGEMENT
  • 6.
    6 In order tounderstand project management, one must begin with the definition of a project. A project can be considered to be any series of activities and tasks that :. ● Have a specific objective to be completed within certain specifications ● Have defined start and end dates ● Have funding limits (if applicable) ● Consume human and nonhuman resources (i.e., money, people, equipment) ● Are multifunctional (i.e., cut across several functional lines) What is the Project ENGINEERING MANAGEMENT
  • 7.
    7 OR ‘‘a temporary endeavorundertaken to create a unique product, service, or result’’ ENGINEERING MANAGEMENT
  • 8.
  • 9.
    9 Table 1-1. ComparativeOverview of Project, Program, and Portfolio Management
  • 10.
    ENGINEERING MANAGEMENT 10 Objectives of WaterResources Management The goal of the water resources management is sustainable water use. In order to achieve the effective and sustainable water resources management, items which shall be required for the proper monitoring, evaluating and controlling works are summarized as follows; a) Water quantity b) Water quality c) Hydro-meteorological and hydro-geological network d) Drought management (Reservoir operation/ Water diversion) e) Watershed management (Drainage water regulation/Forest protection/Land conservation) f) Facilities maintenance
  • 11.
  • 12.
    12 Five Process group Projectinitiation ● Selection of the best project given resource limits ● Recognizing the benefits of the project ● Preparation of the documents to sanction the project ● Assigning of the project manager Project planning ● Definition of the work requirements ● Definition of the quality and quantity of work ● Definition of the resources needed ● Scheduling the activities ● Evaluation of the various risks Project execution ● Negotiating for the project team members ● Directing and managing the work ● Working with the team members to help them improve Project monitoring and control ● Tracking progress ● Comparing actual outcome to predicted outcome ● Analyzing variances and impacts ● Making adjustments Project closure ● Verifying that all of the work has been accomplished ● Contractual closure of the contract ● Financial closure of the charge numbers ● Administrative closure of the paper work ENGINEERING MANAGEMENT
  • 13.
  • 14.
  • 15.
  • 16.
  • 17.
  • 18.
  • 19.
  • 20.
    20 Successful project managementcan then be defined as having achieved the project objectives: ● Within Time ● Within Cost ● At the desired performance/Technology level ● While utilizing the assigned resources effectively and efficiently ● Accepted by the customer ENGINEERING MANAGEMENT
  • 21.
  • 22.
    22 What is ProjectManagement Project management is the planning, organizing, directing, and controlling of company resources for a relatively short-term objective that has been established to complete specific goals and objectives. ENGINEERING MANAGEMENT
  • 23.
    23 The potential benefitsfrom project management are: ● Identification of functional responsibilities ● Minimizing the need for continuous reporting ● Identification of time limits for scheduling ● Identification of a methodology for trade-off analysis. ● Measurement of accomplishment against plans ENGINEERING MANAGEMENT
  • 24.
  • 25.
    25 The above definitionrequires further comment. Classical management is usually considered to have five functions or principles: ● Planning ● Organizing ● Staffing ● Controlling ● Directing ENGINEERING MANAGEMENT
  • 26.
    26 Planning – Where theorganization wants to be in the future and how to get there. Organizing – Follows planning and reflects how the organization tries to accomplish the plan. – Involves the assignment of tasks, grouping of tasks into departments, and allocation of resources. ENGINEERING MANAGEMENT
  • 27.
    27 Leading – The useof influence to motivate employees to achieve the organization's goals. – Creating a shared culture and values, communicating goals to employees throughout the organization, and infusing employees to perform at a high level. Controlling – Monitoring employees' activities, determining if the organization is on target toward its goals, and making corrections as necessary ENGINEERING MANAGEMENT
  • 28.
  • 29.
  • 30.
    30 Conceptual Skill—the abilityto see the organization as a whole and the relationship between its parts. Human Skill—The ability to work with and through people. Technical Skill—Mastery of specific functions and specialized knowledge Management Skills ENGINEERING MANAGEMENT
  • 31.
  • 32.
  • 33.
  • 34.
    34 Project management isdesigned to manage or control company resources on a given activity, within time, within cost, and within performance. Time, cost, and performance are the constraints on the project. Constraints of the project ENGINEERING MANAGEMENT
  • 35.
  • 36.
  • 37.
    37 Resources We have statedthat the project manager must control company resources within time, cost, and performance. Most companies have six resources: ● Money ● Manpower ● Equipment ● Facilities ● Materials ● Information/technology ENGINEERING MANAGEMENT
  • 38.
  • 39.
    39 Actually, the projectmanager does not control any of these resources directly, except perhaps money (i.e., the project budget). Resources are controlled by the line managers . The project manager is responsible for coordinating and integrating activities across multiple, functional lines. The integration activities performed by the project manager include: ENGINEERING MANAGEMENT
  • 40.
    40 ● Integrating theactivities necessary to develop a project plan ● Integrating the activities necessary to execute the plan ● Integrating the activities necessary to make changes to the plan ENGINEERING MANAGEMENT
  • 41.
    Monitoring versus Evaluation Monitoring •Data collected on program activities • Ongoing, routine • Focus on activities and output, compared to target Are we doing the work we planned? Evaluation • Data collected to answer specific questions • Periodic • Focus on outcome, impact How effective were our activities?
  • 42.
    42 Project Scheduling Planning, Scheduling,and Control ENGINEERING MANAGEMENT
  • 43.
    43 Planning and Scheduling Planningand scheduling are two terms that are often thought of as synonymous  They are not!  Scheduling is just one part of the planning effort. ENGINEERING MANAGEMENT
  • 44.
    44  Project planningserves as a foundation for several related functions such as cost estimating, scheduling, and project control.  Project scheduling is the determination of the timing and sequence of operations in the project and their assembly to give the overall completion time ENGINEERING MANAGEMENT
  • 45.
    45 Planning is theprocess of determining how a project will be undertaken. It answers the questions: 1. “What” is going to be done, 2. “how”, 3. “where”, 4. By “whom”, and 5. “when” (in general terms: start and finish). Scheduling deals with “when” on a detailed level… See Figure 1 . ENGINEERING MANAGEMENT
  • 46.
    46 The Plan What How much By whom where Why How when Figure 1. Planning and Scheduling ENGINEERING MANAGEMENT
  • 47.
    47 The Plan PMI definesproject management plan as a ‘‘formal, approved document that defines how the project is executed, monitored and controlled”. The plan can include elements that has to do with scope, design and alternate designs, cost, time, finance, land, procurement, operations, etc. ENGINEERING MANAGEMENT
  • 48.
    48 WHY SCHEDUALE PROJECTS? 1- To calculate the project completion. 2- To calculate the start or end of a specific activity. 3-To expose and adjust conflict between trades or subcontractor. 4- To predict and calculate the cash flow . 5-To evaluate the effect of changing orders ‘CH’ . ENGINEERING MANAGEMENT
  • 49.
    49 6- To improvework efficiency. 7- To resolve delay claims , this is important in critical path method ‘CPM’ discussed later.. 8- To serve as an effective project control tool . ENGINEERING MANAGEMENT
  • 50.
    50 The Tripod ofGood Scheduling System 1. The Human Factor : A proficient scheduler or scheduling team. 2. The Technology : A good scheduling computer system (software and hardware) 3. The Management : A dynamic, responsive, and supportive management.  If anyone of the above three ‘‘legs’’ is missing, the system will fail. ENGINEERING MANAGEMENT
  • 51.
    51 Scheduling and projectmanagement Planning, scheduling, and project control are extremely important components of project management. project management includes other components : • cost estimating and management, • procurement, • project/contract administration, • quality management, • and safety management.  These components are all interrelated in different ways. ENGINEERING MANAGEMENT
  • 52.
  • 53.
    53 DEFINITION AND INTRODUCTION •A bar chart is ‘‘a graphic representation of project activities, shown in a time-scaled bar line with no links shown between activities’’  The bar may not indicate continuous work from the start of the activity until its end. or  Non continuous (dashed) bars are sometimes used to distinguish between real work (solid line) and inactive periods (gaps between solid lines) ENGINEERING MANAGEMENT
  • 54.
    54 • Before abar chart can be constructed for a project, the project must be broken into smaller, usually homogeneous components, each of which is called an activity, or a task. Item Activity M 10 Mobilization Bars ( Month or Year ) ENGINEERING MANAGEMENT
  • 55.
    55 ADVANTAGES OF BARCHARTS 1- Time-scaled 2- Simple to prepare 3- Can be more effective and efficient if CPM based - Still the most popular method 4- Bars can be dashed to indicate work stoppage. 5- Can be loaded with other information (budget, man hours, resources, etc.) ENGINEERING MANAGEMENT
  • 56.
    56 Bar Charts Loadedwith More Info. Such as : budget, man hours and resources . 10 12 7 11 10 9 15 500$ 220$ 400$ 850$ 140$ 500$ 900$ ENGINEERING MANAGEMENT
  • 57.
    57 DISADVANTAGES OF BARCHARTS 1- Does not show logic 2- Not practical for projects with too many activities - As a remedy, we can use bar charts to show: 1. A small group of the activities (subset) 2. Summary schedules ENGINEERING MANAGEMENT
  • 58.
  • 59.
    59 DEFINITION AND INTRODUCTION •A network is a logical and chronological graphic representation of the activities (and events) composing a project. • Network diagrams are the preferred technique for showing activity sequencing. • Two main formats are the arrow and precedence diagramming methods. ENGINEERING MANAGEMENT
  • 60.
    60 Two classic formats AOA:Activity on Arrow AON: Activity on Node Each task labeled with Identifier (usually a letter/code) Duration (in std. unit like days) There are other variations of labeling There is 1 start & 1 end event Time goes from left to right ENGINEERING MANAGEMENT
  • 61.
    61 Arrow Diagramming Method(ADM) 1. Also called activity-on-arrow (AOA) network diagram or (I-J) method (because activities are defined by the form node, I, and the to node, J) 2. Activities are represented by arrows. 3. Nodes or circles are the starting and ending points of activities. 4. Can only show finish-to-start dependencies. ENGINEERING MANAGEMENT
  • 62.
    62 i j (a) BasicActivity Activity Name Node (Event) i j > i Each activity should have a unique i – j value Node (Event) j Basic Logic Patterns for Arrow Diagrams ENGINEERING MANAGEMENT
  • 63.
    63 2 A (b) Independent Activities 410 B 12 3 A 6 B 9 (c) Dependent Activities ENGINEERING MANAGEMENT
  • 64.
    64 2 A (d) A Merge 4 6 B8 (e) A Burst C Activity C depends upon the completion of both Activities A & B 8 A 6 2 B 4 C Activities B and C both depend upon the completion of Activity A ENGINEERING MANAGEMENT
  • 65.
    65 (f) A Cross 20 18 C 16D 14 A 12 B Activities C and D both depend upon the completion of Activities A and B ENGINEERING MANAGEMENT
  • 66.
    66 Example Draw the arrownetwork for the project given next. IPA Activity - A A B A C B D C,D E ENGINEERING MANAGEMENT
  • 67.
  • 68.
    68 Dummy activity (fictitious) *Used to maintain unique numbering of activities. * Used to complete logic, duration of “0” * The use of dummy to maintain unique numbering of activities. ENGINEERING MANAGEMENT
  • 69.
    69 4 10 4 10 11 A B A B Dividenode to correct Dummy (a) Incorrect Representation (b) Correct Representation ENGINEERING MANAGEMENT
  • 70.
    70 Example Draw the arrownetwork for the project given next. IPA Activity - A A B A C B,C D ENGINEERING MANAGEMENT
  • 71.
    71 10 30 20 40 C D A B Solution: 10 30 40 20 50 C D A B Dummy Improper solution proper solution ENGINEERING MANAGEMENT
  • 72.
    72 72 72 Example Draw the arrownetwork for the project given next. IPA Activity - A A B A C B D B,C E C F ENGINEERING MANAGEMENT
  • 73.
    73 Solution : 10 30 40 20 60 C E A B Dummy1 50 Dummy 2 D F ENGINEERING MANAGEMENT
  • 74.
    74 Removal of RedundantDummies A A A A B B B B C C Original Diagram Diagram after removal of redundant dummies (a) (b) ENGINEERING MANAGEMENT
  • 75.
    75 A A A A C C B C B B Original DiagramDiagram after removal of redundant dummies (c) (d) B E C E E E ENGINEERING MANAGEMENT
  • 76.
    76 Immediately Preceding Activity (IPA) DependsUpon Activity ----- A B ----- A A, B A B C B C A Redundant Relationship ENGINEERING MANAGEMENT
  • 77.
    77 Activity List withDependencies: Depends Upon Description Activity ----- ----- A A, B, C A, B, C B, C, J, M B, C, D, E, K D, E, F, G, L ----- ----- ----- ----- Site Clearing Removal of Trees Excavation for Foundations Site Grading Excavation for Utility Trenches Placing formwork & Reinforcement Installing sewer lines Pouring concrete Obtain formwork & reinforcing steel Obtain sewer lines Obtain concrete Steelworker availability A B C D E F G H J K L M ENGINEERING MANAGEMENT
  • 78.
    78 Depends Upon Description Activity ----- ----- A A, B,C A, B, C B, C, J, M B, C, D, E, K D, E, F, G, L ----- ----- ----- ----- Site Clearing Removal of Trees Excavation for Foundations Site Grading Excavation for Utility Trenches Placing formwork & Reinforcement Installing sewer lines Pouring concrete Obtain formwork & reinforcing steel Obtain sewer lines Obtain concrete Steelworker availability A B C D E F G H J K L M Removing Redundant Relationships: ENGINEERING MANAGEMENT
  • 79.
  • 80.
    80 NODE NETWORKS MTHOD(AON) a) Independent Activities 10 A 20 B Activity number Activity name b) Dependent Activities 20 B 10 A Link Link B depends on A ENGINEERING MANAGEMENT
  • 81.
    81 30 C 10 A 20 B 40 D c) A MergeRelationship C depends on A & B D depends on C d) A Burst Relationship 20 B 30 C 40 D 10 A B depends on A C depends on B D depends on B ENGINEERING MANAGEMENT
  • 82.
    82 e) Start &Finish Dummy Activities A C B E D A Start Dummy Finish Dummy C B E D ENGINEERING MANAGEMENT
  • 83.
    83 83 Example Draw the arrownetwork for the project given next. IPA Activity - A A B A C B D C,D E ENGINEERING MANAGEMENT
  • 84.
  • 85.
    85 85 Example Draw the arrownetwork for the project given next. IPA Activity - A A B A C B,C D ENGINEERING MANAGEMENT
  • 86.
  • 87.
    87 87 87 87 Example Draw the arrownetwork for the project given next. IPA Activity - A A B A C B D B,C E C F ENGINEERING MANAGEMENT
  • 88.
  • 89.
    89 ENGINEERING MANAGEMENT Lags andLeads In some situations, an activity cannot start until a certain time after the end of its Predecessor. Lag is defined as a minimum waiting period between the finish (or start) of an activity and the start (or finish) of its successor. Arrow networks cannot accommodate lags. The only solution in such networks is to treat it as a real activity with a real duration, no resources, and a $0 budget.
  • 90.
    ENGINEERING MANAGEMENT 90 Examples Place Concrete 3 StripsForms 2 3 A lag in a node network Place Concrete Strips Forms Cure Concrete A lag in an arrow network
  • 91.
    ENGINEERING MANAGEMENT 91 The termlead simply means a negative lag. It is seldom used in construction. In simple language: A positive time gap (lag) means ‘‘after’’ and a negative time gap (lead) means ‘‘before.’’
  • 92.
    ENGINEERING MANAGEMENT 92 Recommendations forProper Node Diagram Drawing Incorrect Correct
  • 93.
    ENGINEERING MANAGEMENT 93 A B AB A B A B Improper proper
  • 94.
  • 95.
  • 96.
    ENGINEERING MANAGEMENT 96 A B C Improper Proper A B C PS (a)Do not start a network with more than one node
  • 97.
    ENGINEERING MANAGEMENT 97 A B C Improper Proper A B C PF (a)Do not end a network with more than one node
  • 98.
  • 99.
    ENGINEERING MANAGEMENT 99 Suppose youdecide with your friend to go in hunting trip. You must do specific activity such that the trip well be at the right way. The following activity must be done. Introduction
  • 100.
    ENGINEERING MANAGEMENT 100 From chartyou can see that the 3rd activity (preparing the jeep) have the longest period of time any delay with this activity leads to delay in the trip this activity is a “critical activity” Critical activity : An activity on the critical path any delay on the start or finish of a critical activity will result in a delay in the entire project Critical path : The longest path in a network from start to finish
  • 101.
    ENGINEERING MANAGEMENT 101 Steps RequiredTo Schedule a Project The preparation of CPM includes the following four steps: 1- Determine the work activities: The project must be divided into smaller activities or tasks . The activity shouldn’t be more than 14-20 days (long durations should be avoided) Use WBS in scheduling by using an order of letters and numbers
  • 102.
    ENGINEERING MANAGEMENT 102 2- Determineactivity duration: Duration = Total Quantity / Crew Productivity The productivity has many sources : 1. The company 2. The market 3. Special books Note: The scheduler must be aware about the non-working days , such as holydays or rain days, etc……
  • 103.
    ENGINEERING MANAGEMENT 103 3- Determinethe logical relationships : This step is a technical matter and obtained from the project manager and technical team, and logical relationships shouldn’t confused with constraints 4- Draw the logic network and perform the CPM calculations
  • 104.
    ENGINEERING MANAGEMENT 104 5-Reiew andanalyze the schedule: 1. review the logic 2. Make sure the activity has the correct predecessor 3. make sure there is no redundant activity
  • 105.
    ENGINEERING MANAGEMENT 105 6- Implementthe schedule: Definition: take the schedule from paper to the execution. 7-Monitor and control the schedule: Definition: comparing what we planed with what actually done. 8-Revise the database and record feedback. 9-Resource allocation and leveling. (will discuss in chapter 6)
  • 106.
    ENGINEERING MANAGEMENT 106 Example Draw thelogic network and perform the CPM calculations for the schedule shown next. Duration IPA Activity 5 - A 8 A B 6 A C 9 B D 6 B,C E 3 C F 1 D,E,F G
  • 107.
    ENGINEERING MANAGEMENT 107 In mathematicalterms, the ES for activity j is as follows : ESj =max( EFi ) where (EFi) represents the EF for all preceding activities. Likewise, the EF time for activity j is as follows : EF j= ESj + Dur j where Dur j is the duration of activity j Forward pass: The process of navigating through a network from start to end and calculating the completion date for the project and the early dates for each activity Forward pass calculations
  • 108.
  • 109.
    ENGINEERING MANAGEMENT 109 In mathematicalterms, the late finish LF for activity j is as follows : ( LFj =min(LSk where (LSk) represents the late start date for all succeeding activities. Likewise, the LS time for activity j (LS j) is as follows : LS j= LFj - Dur j where Dur j is the duration of activity Backward pass: The process of navigating through a network from end to start and calculating the late dates for each activity. The late dates (along with the early dates) determine the critical activities, the critical path, and the amount of float each activity has. Backward pass calculations
  • 110.
    ENGINEERING MANAGEMENT 110 Solution : A 5 G 1 C 6 D 9 B 8 E 6 F 3 22,23 5,11 5,1313,22 13,19 11,14 0,5 22,23 13,22 19,22 16,22 5,13 10,16 0,5 CPM ( ES = LS , EF = LF , TF = FF = 0)
  • 111.
    ENGINEERING MANAGEMENT 111 Four TypesOf Floats There are several types of float. The simplest and most important type of float is Total Float (TF)  Total float (TF): The maximum amount of time an activity can be delayed from its early start without delaying the entire project. TF = LS – ES or TF = LF - EF or TF = LF - Dur - ES
  • 112.
    ENGINEERING MANAGEMENT 112  FreeFloat: may be defined as the maximum amount of time an activity can be delayed without delaying the early start of the succeeding activities FFi = min(ESi+1) - EFi where min (ESi+1) means the least (i.e., earliest) of the early start dates of succeeding activities
  • 113.
    ENGINEERING MANAGEMENT 113 In theprevious example we can find the free float and total float for each activity as the following : Activity C’s free float, FF = 11 - 11 = 0 days And Activity C’s total float, TF =16 - 11= 5 days …… and so on. FF TF LF LS EF ES Duration Activity 0 0 5 0 5 0 5 A 0 0 13 5 13 5 8 B 0 5 16 10 11 5 6 C 0 0 22 13 22 13 9 D 3 3 22 16 19 13 6 E 8 8 22 19 14 11 3 F 0 0 23 22 23 22 1 G  Critical activity  Note : We must always realize that FF ≤ TF
  • 114.
    ENGINEERING MANAGEMENT 114  Interferingfloat: may be defined as the maximum amount of time an activity can be delayed without delaying the entire project but causing delay to the succeeding activities. TF = FF - Int. or Int. F = TF - FF  Independent float (Ind. F): we may define it as the maximum amount of time an activity can be delayed without delaying the early start of the succeeding activities and without being affected by the allowable delay of the preceding activities. Ind. Fi = min(ESi+1) – max(LFi-1) – Duri Note: make sure that Ind. F ≤ FF
  • 115.
    ENGINEERING MANAGEMENT 115 Node Format ActivityName Activity ID Duration ES EF LS LF TF FF
  • 116.
    ENGINEERING MANAGEMENT 116 Event Timesin Arrow Networks  The early event time, TE, is the largest (latest) date obtained to reach an event (going from start to finish).  The late event time, TL, is the smallest (earliest) date obtained to reach an event (going from finish to start). Examples Perform the CPM calculations, including the event times, for the arrow network shown below.
  • 117.
    ENGINEERING MANAGEMENT 117 10 30 40 2060 C E B 50 D F 70 A G H 10 5 7 8 9 4 5 8 d1 d2 Arrow network for example
  • 118.
    ENGINEERING MANAGEMENT 118 The precedinglogic is similar to that of the forward and backward passes: When you are going forward, pick the largest number. When you are going backward, pick the smallest number. i j Act. Name Dur. TEi TLi TEj TLj CPM
  • 119.
    ENGINEERING MANAGEMENT 119 10 30 40 2060 C E B 50 D F 70 A G H 10 5 7 8 9 4 5 8 d1 d2 10 10 7 0 0 15 10 10 19 19 24 27 27 27 (0,10) (0,10) (5,10) (0,5) (0,7) (8,15) (10,18) (11,19) (10,19) (10,19) (7,11) (15,19) (19,24) (22,27) (19,27) (19,27)
  • 120.
    ENGINEERING MANAGEMENT 120 Float CalculationsFrom Event Times Total Float TFij = TLj - TEi - Tij Example ( In the previous network ) TF40-50 = TL50 – TE40 – T40-50 = 19 – 7 – 4 = 8
  • 121.
    ENGINEERING MANAGEMENT 121 Free Float FFij= TEj - TEi – Tij Example FF40-50 = TE50 – TE40 – T40-50 = 19 – 7 – 4 = 8
  • 122.
    ENGINEERING MANAGEMENT 122 Interfering Float INTFij= TLj – TEj Example INTF40-50 = TL50 – TE50 = 19 – 19 = 0 Independent Float INDFij= TEj – TLi - Tij Example INDF40-50 = TE50 – TL40 – T40-50 = 19 – 15 – 4 = 0
  • 123.
  • 124.
    ENGINEERING MANAGEMENT 124 Definitions Activity, ortask: A basic unit of work as part of the total project that is easily measured and controlled. It is time- and resource consuming. Backward pass: The process of navigating through a network from end to start and calculating the late dates for each activity. The late dates (along with the early dates) determine the critical activities, the critical path, and the amount of float each activity has. Critical activity: An activity on the critical path. Any delay in the start or finish of a critical activity will result in a delay in the entire project. Critical path: The longest path in a network, from start to finish, including lags and constraints.
  • 125.
    ENGINEERING MANAGEMENT 125 Early dates:The early start date and early finish date of an activity. Early finish (EF): The earliest date on which an activity can finish within project constraints. Early start (ES): The earliest date on which an activity can start within project constraints. Event: A point in time marking a start or an end of an activity. In contrast to an activity, an event does not consume time or resources. Forward pass: The process of navigating through a network from start to end and calculating the completion date for the project and the early dates for each activity. Late dates: The late start date and late finish date of an activity. Late finish (LF): The latest date on which an activity can finish without extending the project duration. Late start (LS): The latest date on which an activity can start without extending the project duration.
  • 126.
  • 127.
    ENGINEERING MANAGEMENT 127 The FourTypes Relationships Activities represented by nodes and links that allow the use of four relationships: 1) Finish to Start – FS 2) Start to Finish – SF 3) Finish to Finish – FF 4) Start to Start – SS
  • 128.
    ENGINEERING MANAGEMENT 128 Finish toStart (FS) Relationship . The traditional relationship between activities. . Implies that the preceding activity must finish before the succeeding activities can start. . Example: the plaster must be finished before the tile can start. Plaster Tile
  • 129.
    ENGINEERING MANAGEMENT 129 Star toFinish (SF) Relationship . Appear illogical or irrational. . Typically used with delay time OR LAG. . The following examples proofs that its logical. steel reinforcement Erect formwork Order concrete SF Pour concrete 5
  • 130.
    ENGINEERING MANAGEMENT 130 Finish toFinish (FF) Relationship • Both activities must finish at the same time. • Can be used where activities can overlap to a certain limit. Erect scaffolding Remove Old paint sanding painting inspect Dismantle scaffolding FF/1 FF/2
  • 131.
    ENGINEERING MANAGEMENT 131 Start toStart (SS) Relationship • This method is uncommon and non exists in project construction . Spread grout Clean surface Set tile SS Clean floor area
  • 132.
    ENGINEERING MANAGEMENT 132 Advantages ofusing Precedence Diagram 1. No dummy activities are required. 2. A single number can be assigned to identify each activity. 3. Analytical solution is simpler.
  • 133.
    ENGINEERING MANAGEMENT 133 Calculation 1) forwardcalculations EF = ES + D Calculate the Lag LAGAB = ESB – EFA Calculate the Free Float FF = Min. (LAG)
  • 134.
    ENGINEERING MANAGEMENT 134 2) Backwardcalculations For the last task LF=EF , if no information deny that. LS=LF-D Calculate Total Float TF = LS – ES OR LF – EF TFi = Min (lag ij + TFj ) Determine the Critical Path
  • 135.
    ENGINEERING MANAGEMENT 135 Example 135 Dur. ES EF FFTF LF LS A 1 1 2 0 0 2 1 B 9 2 11 0 0 11 2 D 5 11 16 0 0 16 11 4 16 20 0 0 20 16 1 20 21 0 0 21 20 F H C 5 5 10 3 0 7 2 E 4 10 14 3 0 11 7 6 14 20 3 3 17 11 G 5 4 3 1) Forward pass calculations 4) Backward pass calculations 2) Calculate the Lag ( LAGAB = ESB – EFA) 0 0 0 0 0 0 0 3) Calculate the Free Float (FF) FF = min.( LAG) 5) Calculate total Float (TF = LS – ES OR LF – EF)
  • 136.
    ENGINEERING MANAGEMENT 136 136 Dur. ES EF FFTF LF LS A 1 1 2 0 0 2 1 B 9 2 11 0 0 11 2 D 5 11 16 0 0 16 11 4 16 20 0 0 20 16 1 20 21 0 0 21 20 F H C 5 5 10 3 0 7 2 E 4 10 14 3 0 11 7 6 14 20 3 3 17 11 G 5 4 3 6) Determine the Critical Path 0 0 0 0 0 0 0 The critical path passes through the critical activities where TF = 0
  • 137.
  • 138.
    ENGINEERING MANAGEMENT 138 CATEGORIES OFRESOURCES  Labor  Materials  Equipment's.
  • 139.
    Schedule Updating andProject Control 139
  • 140.
    140 Schedule Updating andProject Control The most important use of schedules is project control : the scheduler compares actual performance with baseline performance. What is Project Control Project control comprises the following continuous process 1. monitoring work progress . 2.comparing it with the baseline schedule and budget. 3.finding any deviations . 4.taking corrective actions. ENGINEERING MANAGEMENT
  • 141.
    141 Schedule updating Schedule updatingis just one part of the project control process. Schedule updating must reflect  Actual work , and  involves change orders (CO) . ENGINEERING MANAGEMENT
  • 142.
    142 ENGINEERING MANAGEMENT Evaluation Questions:main questions and sub-questions
  • 143.
  • 144.
  • 145.
  • 146.
  • 147.

Editor's Notes

  • #42  THIS SLIDE IS ANIMATED Let’s begin by comparing monitoring and evaluation. CLICK to display Monitoring. Monitoring is the routine collection and analysis of program data, specifically on program activities. Data collection is ongoing (weekly, monthly, quarterly, semiannually, etc.). CLICK to display question. Monitoring compares results to the original targets to answer the question: Are we doing the work we planned? It can alert us to problems early because we continually review program data. CLICK to display Evaluation. Evaluation answers specific questions about our performance. It is in-depth analysis that tells us if we should continue or improve our activities. CLICK to display question. Evaluation is less frequent and answers the question: How effective were our activities? Sometimes monitoring leads us to an evaluation. We may see a trend in the routine data that we cannot explain. So we could design an evaluation to help us understand what is going on.