Downloaded 2,350 times

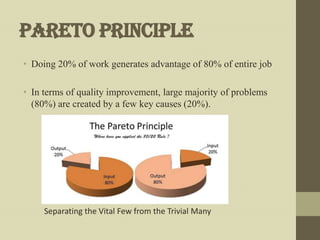
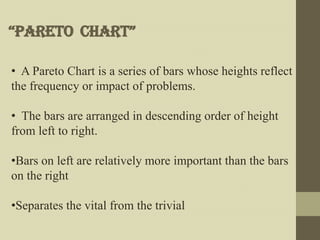


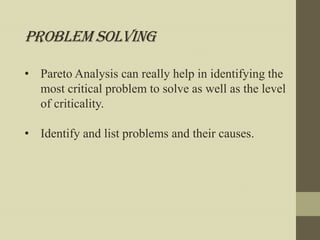


Pareto analysis is a statistical technique used to determine the few key causes that create the majority of problems. It separates the vital few causes from the trivial many. A Pareto chart arranges data in descending order of frequency or impact, with the largest categories on the left. This visualizes that 20% of causes often account for 80% of problems. The Pareto principle can be applied to problem solving, to-do lists, relationships, passions, and decluttering to focus on the most impactful 20% of tasks, people, or possessions.


