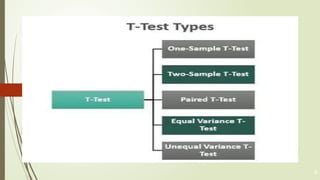
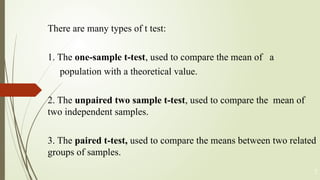
PARAMETRIC
(STUDENT’S – T-TEST)
PRIYADARSHINI J. L. COLLEGE OF PHARMACY,
Electronic Zone Building , MIDC, Hingna Road
Nagpur- 440016
2023-2024 1
Presented by
Swapnil S. Tirmanwar
LEARNING OBJECTIVES
2
Content
Definition of Parametric test
Definition of t - test
Computation of t – test
One – tailed test
Two – tailed test
Restrictions and cautions
PARAMETRIC TEST
• A parametric test is a statistical test that
makes assumptions about the parameters of
the population distribution(s) from which
one’s data is drawn.
3
Used for Quantitative data.
Used for continuous variables.
• Used when data are measured on approximate
interval or ratio scales of measurement.
• Data should follow normal distribution.
4
APPLICATIONS
STUDENT’S - TEST
Student t test is a statistical test which is widely used to compare
the mean of two groups of samples.
• It is therefore to evaluate whether the means of the two sets
of data are statistically significantly different from each other.
• Developed by Prof. W. S. Gossett.
5
6
There are many types of t test:
1. The one-sample t-test, used to compare the mean of a
population with a theoretical value.
2. The unpaired two sample t-test, used to compare the mean of
two independent samples.
3. The paired t-test, used to compare the means between two related
groups of samples.
7
COMPUTATION OF T-TEST
Formula used is
t is the t-value,
X{1} and overline x{2} are the means of the two groups being compared,
s2 is the common variance of the two groups, and
n{1} and n{2} are the number of observations in each of the groups.
8
ONE - TAILED TEST
• In one-tailed test, the alternative hypothesis (HA)
is that the mean of a particular nominated sample (A
or B) will be greater than the mean of the other
sample (B or A).
• The critical value of 't' is lower in one-tailed test.
9
TWO - TAILED TEST
• In two-tailed test, the alternative hypothesis
(HA) is that means of the two samples A and B
are merely different.
• Two-tailed test is more stringent and thus
recommended.
10
• The t-test assumes that data are measured at interval/ratio
level.
• Data should be derived from Normally distributed
populations.
• Counts data may not be Normally distributed, so count
data should be transformed logarithmically before
performing t-test.
• Proportions and percentages data need to be arcsine
transformed.
11
RESTRICTIONS AND CAUTIONS
THANK YOU
12

PARAMETRIC student test presentation (ppt)

  • 1.
    PARAMETRIC (STUDENT’S – T-TEST) PRIYADARSHINIJ. L. COLLEGE OF PHARMACY, Electronic Zone Building , MIDC, Hingna Road Nagpur- 440016 2023-2024 1 Presented by Swapnil S. Tirmanwar
  • 2.
    LEARNING OBJECTIVES 2 Content Definition ofParametric test Definition of t - test Computation of t – test One – tailed test Two – tailed test Restrictions and cautions
  • 3.
    PARAMETRIC TEST • Aparametric test is a statistical test that makes assumptions about the parameters of the population distribution(s) from which one’s data is drawn. 3
  • 4.
    Used for Quantitativedata. Used for continuous variables. • Used when data are measured on approximate interval or ratio scales of measurement. • Data should follow normal distribution. 4 APPLICATIONS
  • 5.
    STUDENT’S - TEST Studentt test is a statistical test which is widely used to compare the mean of two groups of samples. • It is therefore to evaluate whether the means of the two sets of data are statistically significantly different from each other. • Developed by Prof. W. S. Gossett. 5
  • 6.
  • 7.
    There are manytypes of t test: 1. The one-sample t-test, used to compare the mean of a population with a theoretical value. 2. The unpaired two sample t-test, used to compare the mean of two independent samples. 3. The paired t-test, used to compare the means between two related groups of samples. 7
  • 8.
    COMPUTATION OF T-TEST Formulaused is t is the t-value, X{1} and overline x{2} are the means of the two groups being compared, s2 is the common variance of the two groups, and n{1} and n{2} are the number of observations in each of the groups. 8
  • 9.
    ONE - TAILEDTEST • In one-tailed test, the alternative hypothesis (HA) is that the mean of a particular nominated sample (A or B) will be greater than the mean of the other sample (B or A). • The critical value of 't' is lower in one-tailed test. 9
  • 10.
    TWO - TAILEDTEST • In two-tailed test, the alternative hypothesis (HA) is that means of the two samples A and B are merely different. • Two-tailed test is more stringent and thus recommended. 10
  • 11.
    • The t-testassumes that data are measured at interval/ratio level. • Data should be derived from Normally distributed populations. • Counts data may not be Normally distributed, so count data should be transformed logarithmically before performing t-test. • Proportions and percentages data need to be arcsine transformed. 11 RESTRICTIONS AND CAUTIONS
  • 12.