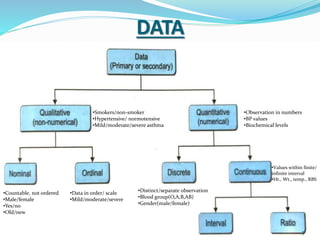
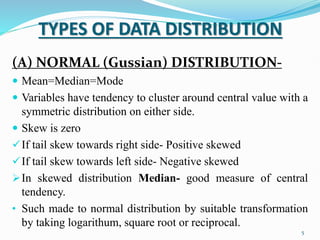
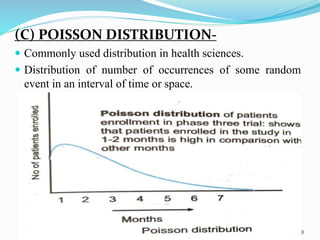
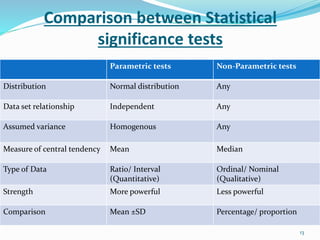
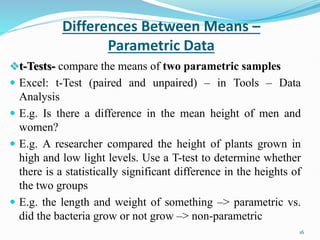
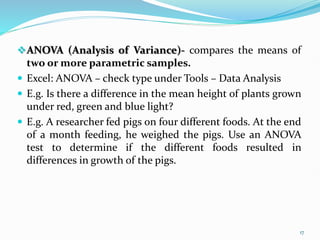
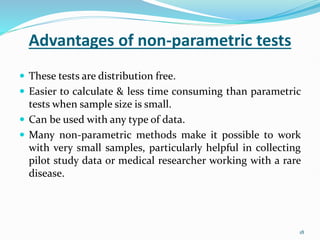
Dr. Devesh Pandey
MBBS, MD (Pharmacology)
8-12-2020 1
Statistical Tests
 Mathematical calculation or analysis of observed and
collected data from the population or sampling.
 Statistical Power- Result obtained of tests, measure of
probability that a statistical test rejects a false null
hypothesis or probability of finding a significant result.
 Broadly, data classified into two-
1. Qualitative data (non-numerical)
2. Quantitative data (numerical)
2
DATA
•Smokers/non-smoker
•Hypertensive/ normotensive
•Mild/moderate/severe asthma
•Observation in numbers
•BP values
•Biochemical levels
•Countable, not ordered
•Male/female
•Yes/no
•Old/new
•Data in order/ scale
•Mild/moderate/severe
•Distinct/separate observation
•Blood group(O,A,B,AB)
•Gender(male/female)
•Values within finite/
infinite interval
•Ht., Wt., temp., RBS
3
Measure of Data
(A) Mean-
 Arithmetic average of any given data.
(B) Median-
 Middle value of any given data when it is arranged in
ascending/ descending order.
(C) Mode-
 Very frequently occuring event in given data.
4
TYPES OF DATA DISTRIBUTION
(A) NORMAL (Gussian) DISTRIBUTION-
 Mean=Median=Mode
 Variables have tendency to cluster around central value with a
symmetric distribution on either side.
 Skew is zero
If tail skew towards right side- Positive skewed
If tail skew towards left side- Negative skewed
In skewed distribution Median- good measure of central
tendency.
• Such made to normal distribution by suitable transformation
by taking logarithum, square root or reciprocal.
5
6
(B) BINOMIAL DISTRIBUTION-
 Data where only two possibilities.
 E.g. smokers/ non-smokers, male/ females, survived/
not survived.
 Two peaks
7
(C) POISSON DISTRIBUTION-
 Commonly used distribution in health sciences.
 Distribution of number of occurrences of some random
event in an interval of time or space.
8
9
10
11
Classification
12
Comparison between Statistical
significance tests
Parametric tests Non-Parametric tests
Distribution Normal distribution Any
Data set relationship Independent Any
Assumed variance Homogenous Any
Measure of central tendency Mean Median
Type of Data Ratio/ Interval
(Quantitative)
Ordinal/ Nominal
(Qualitative)
Strength More powerful Less powerful
Comparison Mean ±SD Percentage/ proportion
13
Equivalent Tests
Parametric tests Non-Parametric tests
Correlation test- Pearson Spearman rank order
(Independent measures 2 groups)
Unpaired student t-test
Mann-Whitney U test
(Repeated measures 2 condition)
Paired t - test
Wilcoxon signed rank test
(Independent measures >2 conditions)
ANOVA one way
Kruskal-wallis test
(Repeated measures > 2 conditions)
ANOVA one way
Friedman test
14
PARAMETRIC TESTS
Parameter: is any numerical quantity that characterizes a
given population or some aspect of it.
P-value- (Statistical significance)
Represents risk observed in experiment due to chance.
Determines significance/non-significance of a result.
<0.05 value- significant (uncertainty of 5%)
Confidence interval (CI)- (Clinical significance)
95%- means 95% chance of cases to fall in the range.
15
Differences Between Means –
Parametric Data
t-Tests- compare the means of two parametric samples
 Excel: t-Test (paired and unpaired) – in Tools – Data
Analysis
 E.g. Is there a difference in the mean height of men and
women?
 E.g. A researcher compared the height of plants grown in
high and low light levels. Use a T-test to determine whether
there is a statistically significant difference in the heights of
the two groups
 E.g. the length and weight of something –> parametric vs.
did the bacteria grow or not grow –> non-parametric
16
ANOVA (Analysis of Variance)- compares the means of
two or more parametric samples.
 Excel: ANOVA – check type under Tools – Data Analysis
 E.g. Is there a difference in the mean height of plants grown
under red, green and blue light?
 E.g. A researcher fed pigs on four different foods. At the end
of a month feeding, he weighed the pigs. Use an ANOVA
test to determine if the different foods resulted in
differences in growth of the pigs.
17
Advantages of non-parametric tests
 These tests are distribution free.
 Easier to calculate & less time consuming than parametric
tests when sample size is small.
 Can be used with any type of data.
 Many non-parametric methods make it possible to work
with very small samples, particularly helpful in collecting
pilot study data or medical researcher working with a rare
disease.
18
19

Parametric and Non parametric Tests.pptx

  • 1.
    Dr. Devesh Pandey MBBS,MD (Pharmacology) 8-12-2020 1
  • 2.
    Statistical Tests  Mathematicalcalculation or analysis of observed and collected data from the population or sampling.  Statistical Power- Result obtained of tests, measure of probability that a statistical test rejects a false null hypothesis or probability of finding a significant result.  Broadly, data classified into two- 1. Qualitative data (non-numerical) 2. Quantitative data (numerical) 2
  • 3.
    DATA •Smokers/non-smoker •Hypertensive/ normotensive •Mild/moderate/severe asthma •Observationin numbers •BP values •Biochemical levels •Countable, not ordered •Male/female •Yes/no •Old/new •Data in order/ scale •Mild/moderate/severe •Distinct/separate observation •Blood group(O,A,B,AB) •Gender(male/female) •Values within finite/ infinite interval •Ht., Wt., temp., RBS 3
  • 4.
    Measure of Data (A)Mean-  Arithmetic average of any given data. (B) Median-  Middle value of any given data when it is arranged in ascending/ descending order. (C) Mode-  Very frequently occuring event in given data. 4
  • 5.
    TYPES OF DATADISTRIBUTION (A) NORMAL (Gussian) DISTRIBUTION-  Mean=Median=Mode  Variables have tendency to cluster around central value with a symmetric distribution on either side.  Skew is zero If tail skew towards right side- Positive skewed If tail skew towards left side- Negative skewed In skewed distribution Median- good measure of central tendency. • Such made to normal distribution by suitable transformation by taking logarithum, square root or reciprocal. 5
  • 6.
  • 7.
    (B) BINOMIAL DISTRIBUTION- Data where only two possibilities.  E.g. smokers/ non-smokers, male/ females, survived/ not survived.  Two peaks 7
  • 8.
    (C) POISSON DISTRIBUTION- Commonly used distribution in health sciences.  Distribution of number of occurrences of some random event in an interval of time or space. 8
  • 9.
  • 10.
  • 11.
  • 12.
  • 13.
    Comparison between Statistical significancetests Parametric tests Non-Parametric tests Distribution Normal distribution Any Data set relationship Independent Any Assumed variance Homogenous Any Measure of central tendency Mean Median Type of Data Ratio/ Interval (Quantitative) Ordinal/ Nominal (Qualitative) Strength More powerful Less powerful Comparison Mean ±SD Percentage/ proportion 13
  • 14.
    Equivalent Tests Parametric testsNon-Parametric tests Correlation test- Pearson Spearman rank order (Independent measures 2 groups) Unpaired student t-test Mann-Whitney U test (Repeated measures 2 condition) Paired t - test Wilcoxon signed rank test (Independent measures >2 conditions) ANOVA one way Kruskal-wallis test (Repeated measures > 2 conditions) ANOVA one way Friedman test 14
  • 15.
    PARAMETRIC TESTS Parameter: isany numerical quantity that characterizes a given population or some aspect of it. P-value- (Statistical significance) Represents risk observed in experiment due to chance. Determines significance/non-significance of a result. <0.05 value- significant (uncertainty of 5%) Confidence interval (CI)- (Clinical significance) 95%- means 95% chance of cases to fall in the range. 15
  • 16.
    Differences Between Means– Parametric Data t-Tests- compare the means of two parametric samples  Excel: t-Test (paired and unpaired) – in Tools – Data Analysis  E.g. Is there a difference in the mean height of men and women?  E.g. A researcher compared the height of plants grown in high and low light levels. Use a T-test to determine whether there is a statistically significant difference in the heights of the two groups  E.g. the length and weight of something –> parametric vs. did the bacteria grow or not grow –> non-parametric 16
  • 17.
    ANOVA (Analysis ofVariance)- compares the means of two or more parametric samples.  Excel: ANOVA – check type under Tools – Data Analysis  E.g. Is there a difference in the mean height of plants grown under red, green and blue light?  E.g. A researcher fed pigs on four different foods. At the end of a month feeding, he weighed the pigs. Use an ANOVA test to determine if the different foods resulted in differences in growth of the pigs. 17
  • 18.
    Advantages of non-parametrictests  These tests are distribution free.  Easier to calculate & less time consuming than parametric tests when sample size is small.  Can be used with any type of data.  Many non-parametric methods make it possible to work with very small samples, particularly helpful in collecting pilot study data or medical researcher working with a rare disease. 18
  • 19.