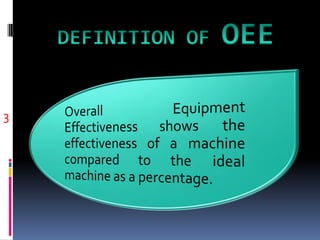
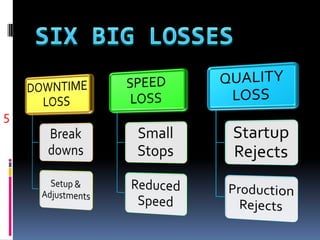
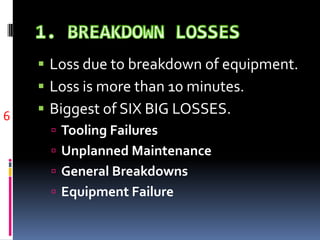
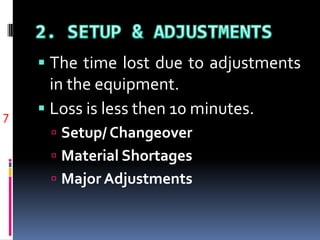
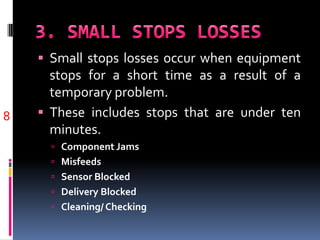
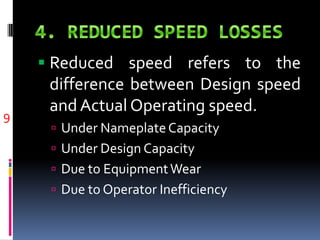
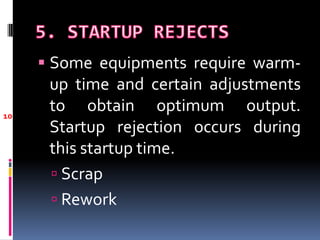
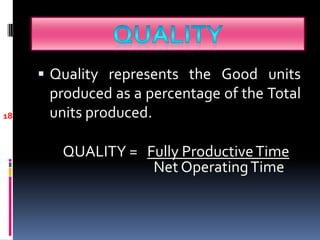
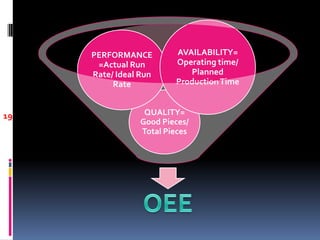
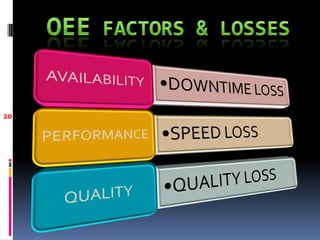
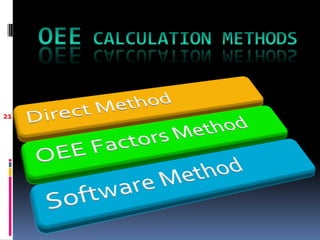
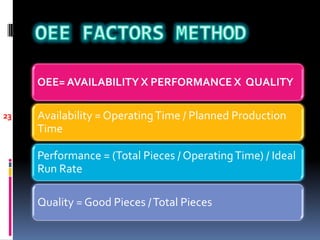
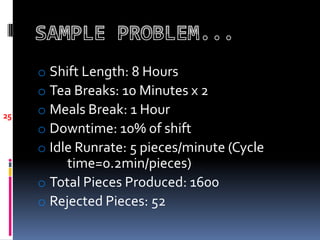
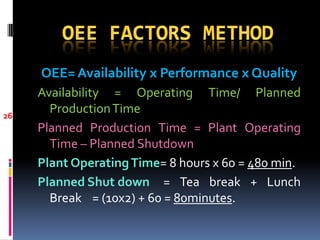
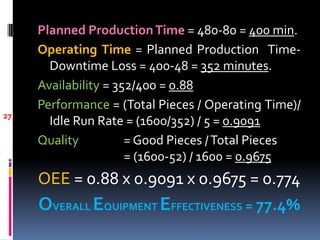
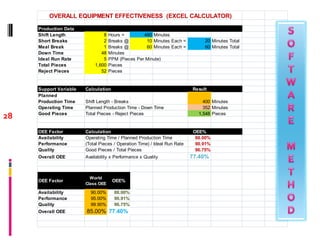
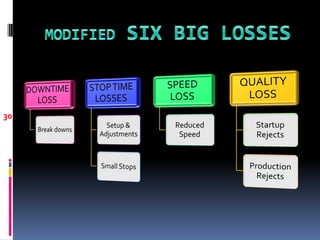
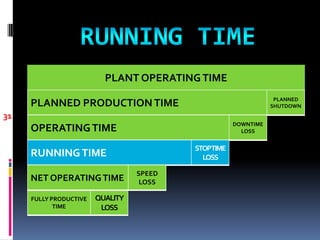
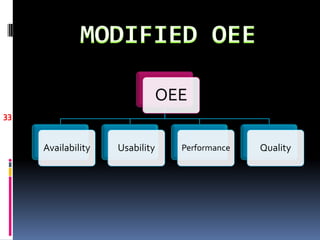
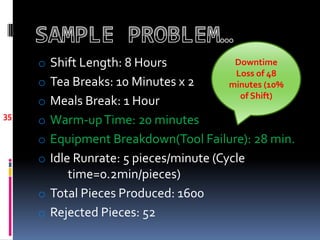
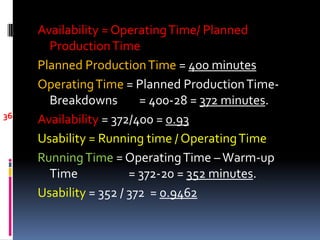
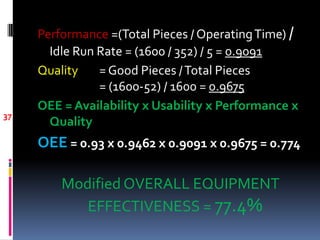
WELCOME
KAILAS SREE CHANDRAN
CLASS: S7 INDUSTRIAL 432
Guide:V REGIKUMAR
OVERALL EQUIPMENT EFFECTIVENESS
OEE
MODERN APPROACH TO
OVERALL EQUIPMENT EFFECTIVENESS
OEE
2
3
4
5
 Loss due to breakdown of equipment.
 Loss is more than 10 minutes.
 Biggest of SIX BIG LOSSES.
 Tooling Failures
 Unplanned Maintenance
 General Breakdowns
 Equipment Failure
6
 The time lost due to adjustments
in the equipment.
 Loss is less then 10 minutes.
 Setup/ Changeover
 Material Shortages
 Major Adjustments
7
 Small stops losses occur when equipment
stops for a short time as a result of a
temporary problem.
 These includes stops that are under ten
minutes.
 Component Jams
 Misfeeds
 Sensor Blocked
 Delivery Blocked
 Cleaning/ Checking
8
 Reduced speed refers to the
difference between Design speed
and Actual Operating speed.
 Under NameplateCapacity
 Under Design Capacity
 Due to EquipmentWear
 Due to Operator Inefficiency
9
 Some equipments require warm-
up time and certain adjustments
to obtain optimum output.
Startup rejection occurs during
this startup time.
 Scrap
 Rework
10
 These losses occurs when products
produced are not conforming to the
specifications.
 These are rejects during steady-state
production.
 Scrap
 Rework
11
12
 The amount of time the facility is open and
available for operation.
 One year consists of 365 days, one day
consists of 24 hours, 60 minutes in one
hour, 60 seconds in one minute.
 PLANT OPERATING TIME = Fully
Productive Time + Quality Loss + Speed
Loss + Downtime Loss + Planned
Shutdown
13
PLANT OPERATINGTIME
PLANNED PRODUCTIONTIME PLANNED
SHUTDOWN
OPERATINGTIME DOWNTIME
LOSS
NET OPERATINGTIME
SPEED
LOSS
FULLY PRODUCTIVETIME
QUALITY
LOSS
14
OEE FACTORS
15
 Availability represents the percentage
of scheduled time that the equipment is
available to operate.
 Availability takes into account Down
Time Losses.
AVAILABILITY = OperatingTime
Planned ProductionTime
16
 Performance represents the speed at
which the equipment runs as a
percentage of its designed speed.
 Performance takes into account Speed
loss.
PERFORMANCE = Net OperatingTime
OperatingTime
17
 Quality represents the Good units
produced as a percentage of the Total
units produced.
QUALITY = Fully ProductiveTime
Net OperatingTime
18
QUALITY=
Good Pieces/
Total Pieces
PERFORMANCE
=Actual Run
Rate/ Ideal Run
Rate
AVAILABILITY=
Operating time/
Planned
ProductionTime
19
20
21
22
OEE= AVAILABILITY X PERFORMANCE X QUALITY
Availability = OperatingTime / Planned Production
Time
Performance = (Total Pieces / OperatingTime) / Ideal
Run Rate
Quality = Good Pieces /Total Pieces
23
 This method use computers for
accessing inputs, calculating OEE
and its analysis.
 E.g.: OEE IMPACT, VISUAL OEE,
OEETOOLKIT, PROVIDEAM etc.
 Spreadsheets
 System Software
24
o Shift Length: 8 Hours
o Tea Breaks: 10 Minutes x 2
o Meals Break: 1 Hour
o Downtime: 10% of shift
o Idle Runrate: 5 pieces/minute (Cycle
time=0.2min/pieces)
o Total Pieces Produced: 1600
o Rejected Pieces: 52
25
OEE= Availability x Performance x Quality
Availability = Operating Time/ Planned
ProductionTime
Planned Production Time = Plant Operating
Time – Planned Shutdown
Plant OperatingTime= 8 hours x 60 = 480 min.
Planned Shut down = Tea break + Lunch
Break = (10x2) + 60 = 80minutes.
26
Planned ProductionTime = 480-80 = 400 min.
Operating Time = Planned Production Time-
Downtime Loss = 400-48 = 352 minutes.
Availability = 352/400 = 0.88
Performance = (Total Pieces / Operating Time)/
Idle Run Rate = (1600/352) / 5 = 0.9091
Quality = Good Pieces /Total Pieces
= (1600-52) / 1600 = 0.9675
OEE = 0.88 x 0.9091 x 0.9675 = 0.774
OVERALL EQUIPMENT EFFECTIVENESS = 77.4%
27
OVERALL EQUIPMENT EFFECTIVENESS (EXCEL CALCULATOR)
Production Data
Shift Length 8 Hours = 480 Minutes
Short Breaks 2 Breaks @ 10 Minutes Each = 20 Minutes Total
Meal Break 1 Breaks @ 60 Minutes Each = 60 Minutes Total
Down Time 48 Minutes
Ideal Run Rate 5 PPM (Pieces Per Minute)
Total Pieces 1,600 Pieces
Reject Pieces 52 Pieces
Support Variable Calculation Result
Planned
Production Time Shift Length - Breaks 400 Minutes
Operating Time Planned Production Time - Down Time 352 Minutes
Good Pieces Total Pieces - Reject Pieces 1,548 Pieces
OEE Factor Calculation OEE%
Availability Operating Time / Planned Production Time 88.00%
Performance (Total Pieces / Operation Time) / Ideal Run Rate 90.91%
Quality Good Pieces / Total Pieces 96.75%
Overall OEE Availability x Performance x Quality 77.40%
OEE Factor
World
Class OEE
OEE%
Availability 90.00% 88.00%
Performance 95.00% 90.91%
Quality 99.90% 96.75%
Overall OEE 85.00% 77.40%
28
 World class OEE is a standard which is used to
compare the OEE of the firm.
OEE Factor WORLD CLASS
Availability 90%
Performance 95%
Quality 99%
Overall Equipment
Effectiveness
85%
29
30
FULLY PRODUCTIVE
TIME
QUALITY
LOSS
PLANT OPERATINGTIME
PLANNED PRODUCTIONTIME PLANNED
SHUTDOWN
OPERATINGTIME DOWNTIME
LOSS
RUNNINGTIME
STOPTIME
LOSS
NET OPERATINGTIME
SPEED
LOSS
31
 Usability takes into account Stop Time
Loss.
USABILITY = RunningTime
OperatingTime
32
OEE
Availability Usability Performance Quality
33
34
o Shift Length: 8 Hours
o Tea Breaks: 10 Minutes x 2
o Meals Break: 1 Hour
o Warm-upTime: 20 minutes
o Equipment Breakdown(Tool Failure): 28 min.
o Idle Runrate: 5 pieces/minute (Cycle
time=0.2min/pieces)
o Total Pieces Produced: 1600
o Rejected Pieces: 52
Downtime
Loss of 48
minutes (10%
of Shift)
35
Availability = OperatingTime/ Planned
ProductionTime
Planned ProductionTime = 400 minutes
OperatingTime = Planned ProductionTime-
Breakdowns = 400-28 = 372 minutes.
Availability = 372/400 = 0.93
Usability = Running time / OperatingTime
RunningTime = OperatingTime –Warm-up
Time = 372-20 = 352 minutes.
Usability = 352 / 372 = 0.9462
36
Performance =(Total Pieces / OperatingTime) /
Idle Run Rate = (1600 / 352) / 5 = 0.9091
Quality = Good Pieces /Total Pieces
= (1600-52) / 1600 = 0.9675
OEE = Availability x Usability x Performance x
Quality
OEE = 0.93 x 0.9462 x 0.9091 x 0.9675 = 0.774
Modified OVERALL EQUIPMENT
EFFECTIVENESS = 77.4%
37
38
39
 Anil S. Badiger, ‘A proposal: evaluation of
OEE and impact of six big losses’, Int. J.
Process Management and Benchmarking,
Vol.2, No. 3, 2008, pp 234-248.
 Ravikumar M. M., ‘Improving Equipment
Effectiveness’, Int. Business Management,
Vol. 3, No.2, 2008, pp 91-96.
 www.bestmanagementarticles.com
 www.maintenanceworld.com
40
OEE CALCULATION PPT

OEE CALCULATION PPT

  • 1.
  • 2.
    KAILAS SREE CHANDRAN CLASS:S7 INDUSTRIAL 432 Guide:V REGIKUMAR OVERALL EQUIPMENT EFFECTIVENESS OEE
  • 3.
    MODERN APPROACH TO OVERALLEQUIPMENT EFFECTIVENESS OEE
  • 4.
  • 5.
  • 6.
  • 7.
  • 8.
     Loss dueto breakdown of equipment.  Loss is more than 10 minutes.  Biggest of SIX BIG LOSSES.  Tooling Failures  Unplanned Maintenance  General Breakdowns  Equipment Failure 6
  • 9.
     The timelost due to adjustments in the equipment.  Loss is less then 10 minutes.  Setup/ Changeover  Material Shortages  Major Adjustments 7
  • 10.
     Small stopslosses occur when equipment stops for a short time as a result of a temporary problem.  These includes stops that are under ten minutes.  Component Jams  Misfeeds  Sensor Blocked  Delivery Blocked  Cleaning/ Checking 8
  • 11.
     Reduced speedrefers to the difference between Design speed and Actual Operating speed.  Under NameplateCapacity  Under Design Capacity  Due to EquipmentWear  Due to Operator Inefficiency 9
  • 12.
     Some equipmentsrequire warm- up time and certain adjustments to obtain optimum output. Startup rejection occurs during this startup time.  Scrap  Rework 10
  • 13.
     These lossesoccurs when products produced are not conforming to the specifications.  These are rejects during steady-state production.  Scrap  Rework 11
  • 14.
  • 15.
     The amountof time the facility is open and available for operation.  One year consists of 365 days, one day consists of 24 hours, 60 minutes in one hour, 60 seconds in one minute.  PLANT OPERATING TIME = Fully Productive Time + Quality Loss + Speed Loss + Downtime Loss + Planned Shutdown 13
  • 16.
    PLANT OPERATINGTIME PLANNED PRODUCTIONTIMEPLANNED SHUTDOWN OPERATINGTIME DOWNTIME LOSS NET OPERATINGTIME SPEED LOSS FULLY PRODUCTIVETIME QUALITY LOSS 14
  • 17.
  • 18.
     Availability representsthe percentage of scheduled time that the equipment is available to operate.  Availability takes into account Down Time Losses. AVAILABILITY = OperatingTime Planned ProductionTime 16
  • 19.
     Performance representsthe speed at which the equipment runs as a percentage of its designed speed.  Performance takes into account Speed loss. PERFORMANCE = Net OperatingTime OperatingTime 17
  • 20.
     Quality representsthe Good units produced as a percentage of the Total units produced. QUALITY = Fully ProductiveTime Net OperatingTime 18
  • 21.
    QUALITY= Good Pieces/ Total Pieces PERFORMANCE =ActualRun Rate/ Ideal Run Rate AVAILABILITY= Operating time/ Planned ProductionTime 19
  • 22.
  • 23.
  • 24.
  • 25.
    OEE= AVAILABILITY XPERFORMANCE X QUALITY Availability = OperatingTime / Planned Production Time Performance = (Total Pieces / OperatingTime) / Ideal Run Rate Quality = Good Pieces /Total Pieces 23
  • 26.
     This methoduse computers for accessing inputs, calculating OEE and its analysis.  E.g.: OEE IMPACT, VISUAL OEE, OEETOOLKIT, PROVIDEAM etc.  Spreadsheets  System Software 24
  • 27.
    o Shift Length:8 Hours o Tea Breaks: 10 Minutes x 2 o Meals Break: 1 Hour o Downtime: 10% of shift o Idle Runrate: 5 pieces/minute (Cycle time=0.2min/pieces) o Total Pieces Produced: 1600 o Rejected Pieces: 52 25
  • 28.
    OEE= Availability xPerformance x Quality Availability = Operating Time/ Planned ProductionTime Planned Production Time = Plant Operating Time – Planned Shutdown Plant OperatingTime= 8 hours x 60 = 480 min. Planned Shut down = Tea break + Lunch Break = (10x2) + 60 = 80minutes. 26
  • 29.
    Planned ProductionTime =480-80 = 400 min. Operating Time = Planned Production Time- Downtime Loss = 400-48 = 352 minutes. Availability = 352/400 = 0.88 Performance = (Total Pieces / Operating Time)/ Idle Run Rate = (1600/352) / 5 = 0.9091 Quality = Good Pieces /Total Pieces = (1600-52) / 1600 = 0.9675 OEE = 0.88 x 0.9091 x 0.9675 = 0.774 OVERALL EQUIPMENT EFFECTIVENESS = 77.4% 27
  • 30.
    OVERALL EQUIPMENT EFFECTIVENESS(EXCEL CALCULATOR) Production Data Shift Length 8 Hours = 480 Minutes Short Breaks 2 Breaks @ 10 Minutes Each = 20 Minutes Total Meal Break 1 Breaks @ 60 Minutes Each = 60 Minutes Total Down Time 48 Minutes Ideal Run Rate 5 PPM (Pieces Per Minute) Total Pieces 1,600 Pieces Reject Pieces 52 Pieces Support Variable Calculation Result Planned Production Time Shift Length - Breaks 400 Minutes Operating Time Planned Production Time - Down Time 352 Minutes Good Pieces Total Pieces - Reject Pieces 1,548 Pieces OEE Factor Calculation OEE% Availability Operating Time / Planned Production Time 88.00% Performance (Total Pieces / Operation Time) / Ideal Run Rate 90.91% Quality Good Pieces / Total Pieces 96.75% Overall OEE Availability x Performance x Quality 77.40% OEE Factor World Class OEE OEE% Availability 90.00% 88.00% Performance 95.00% 90.91% Quality 99.90% 96.75% Overall OEE 85.00% 77.40% 28
  • 31.
     World classOEE is a standard which is used to compare the OEE of the firm. OEE Factor WORLD CLASS Availability 90% Performance 95% Quality 99% Overall Equipment Effectiveness 85% 29
  • 32.
  • 33.
    FULLY PRODUCTIVE TIME QUALITY LOSS PLANT OPERATINGTIME PLANNEDPRODUCTIONTIME PLANNED SHUTDOWN OPERATINGTIME DOWNTIME LOSS RUNNINGTIME STOPTIME LOSS NET OPERATINGTIME SPEED LOSS 31
  • 34.
     Usability takesinto account Stop Time Loss. USABILITY = RunningTime OperatingTime 32
  • 35.
  • 36.
  • 37.
    o Shift Length:8 Hours o Tea Breaks: 10 Minutes x 2 o Meals Break: 1 Hour o Warm-upTime: 20 minutes o Equipment Breakdown(Tool Failure): 28 min. o Idle Runrate: 5 pieces/minute (Cycle time=0.2min/pieces) o Total Pieces Produced: 1600 o Rejected Pieces: 52 Downtime Loss of 48 minutes (10% of Shift) 35
  • 38.
    Availability = OperatingTime/Planned ProductionTime Planned ProductionTime = 400 minutes OperatingTime = Planned ProductionTime- Breakdowns = 400-28 = 372 minutes. Availability = 372/400 = 0.93 Usability = Running time / OperatingTime RunningTime = OperatingTime –Warm-up Time = 372-20 = 352 minutes. Usability = 352 / 372 = 0.9462 36
  • 39.
    Performance =(Total Pieces/ OperatingTime) / Idle Run Rate = (1600 / 352) / 5 = 0.9091 Quality = Good Pieces /Total Pieces = (1600-52) / 1600 = 0.9675 OEE = Availability x Usability x Performance x Quality OEE = 0.93 x 0.9462 x 0.9091 x 0.9675 = 0.774 Modified OVERALL EQUIPMENT EFFECTIVENESS = 77.4% 37
  • 40.
  • 41.
  • 42.
     Anil S.Badiger, ‘A proposal: evaluation of OEE and impact of six big losses’, Int. J. Process Management and Benchmarking, Vol.2, No. 3, 2008, pp 234-248.  Ravikumar M. M., ‘Improving Equipment Effectiveness’, Int. Business Management, Vol. 3, No.2, 2008, pp 91-96.  www.bestmanagementarticles.com  www.maintenanceworld.com 40