Download to read offline
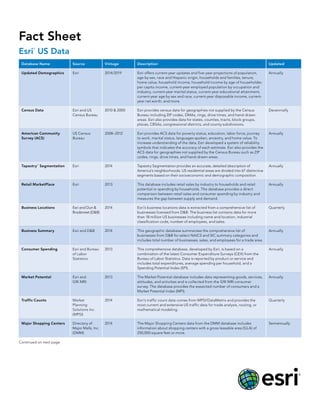
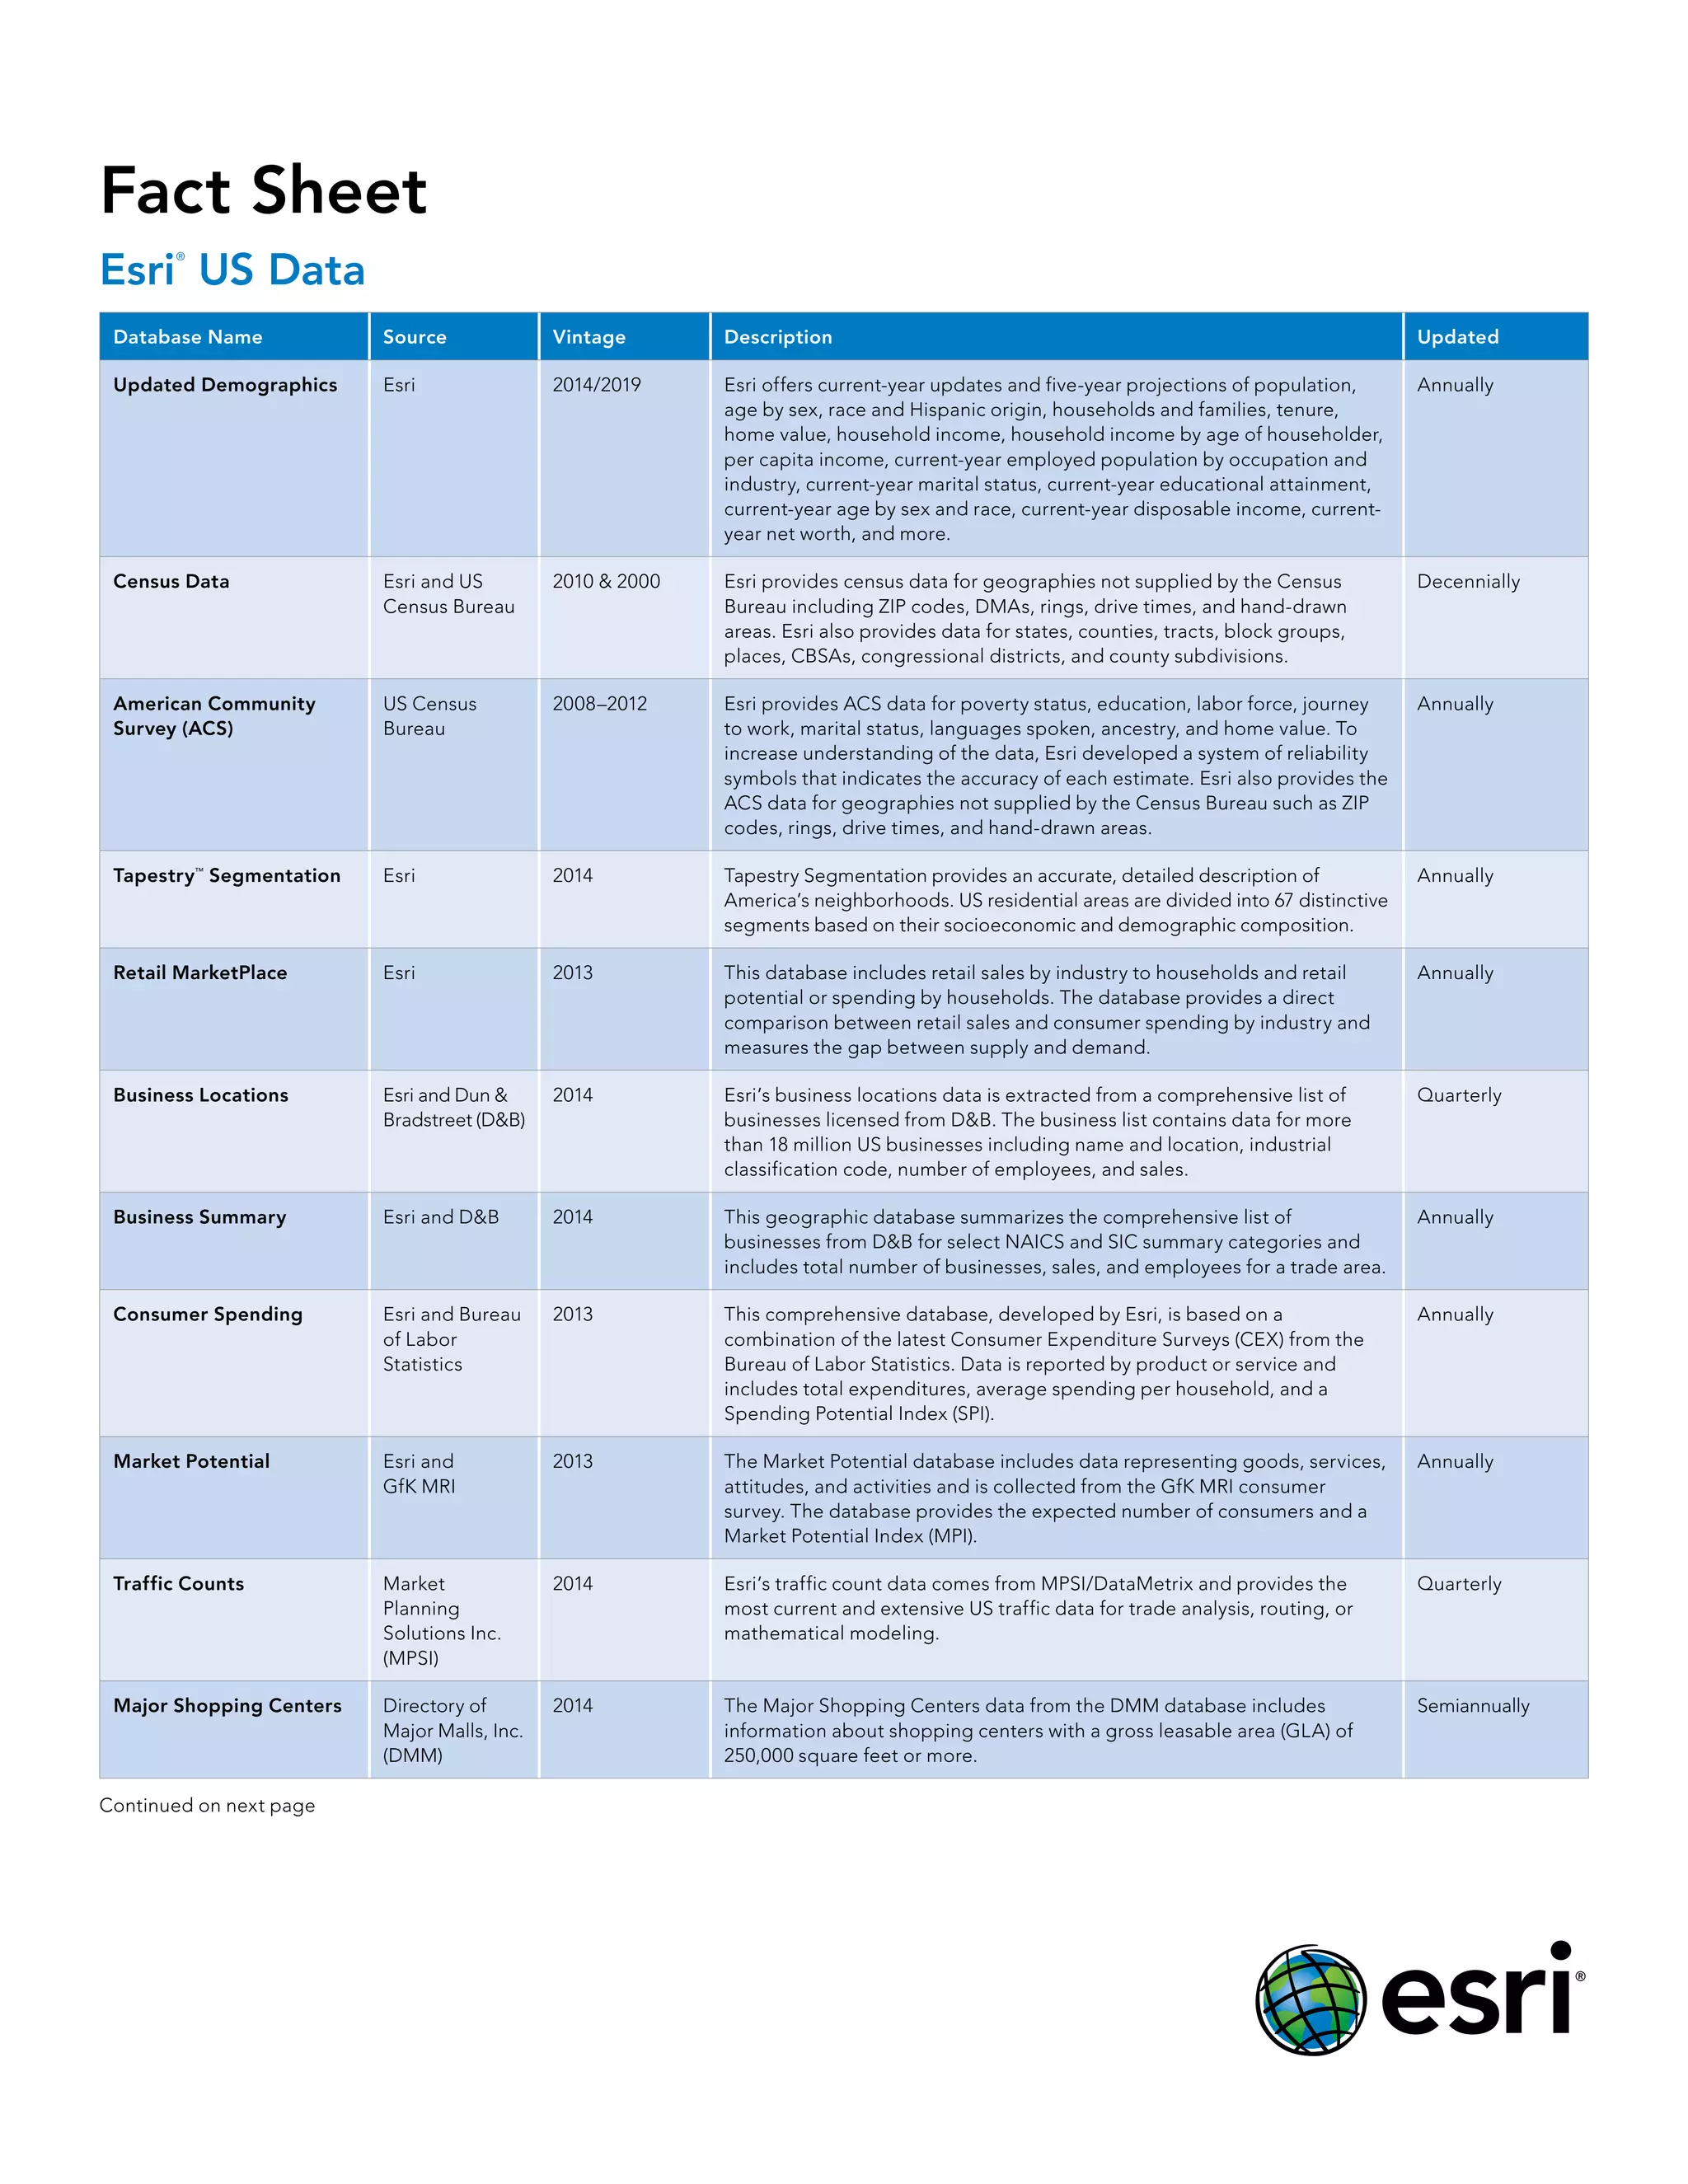

This document provides a summary of various US demographic and business data sources available from Esri, including descriptions, frequencies of updates, and data vintages. It describes datasets covering topics such as population, households, income, businesses, retail sales, crime, banking and demographics. The data comes from sources including the US Census Bureau, Bureau of Labor Statistics, Dun & Bradstreet and other public and private organizations. Most datasets are updated annually, with some updated decennially, quarterly or semiannually.


![Getting Started with Apache Spark: Big Data Made Simple [Free Meetup]](https://cdn.slidesharecdn.com/ss_thumbnails/apachesparkgettingstarted-260203175547-8361bcc3-thumbnail.jpg?width=640&height=640&fit=bounds)


