Download as PDF, PPTX
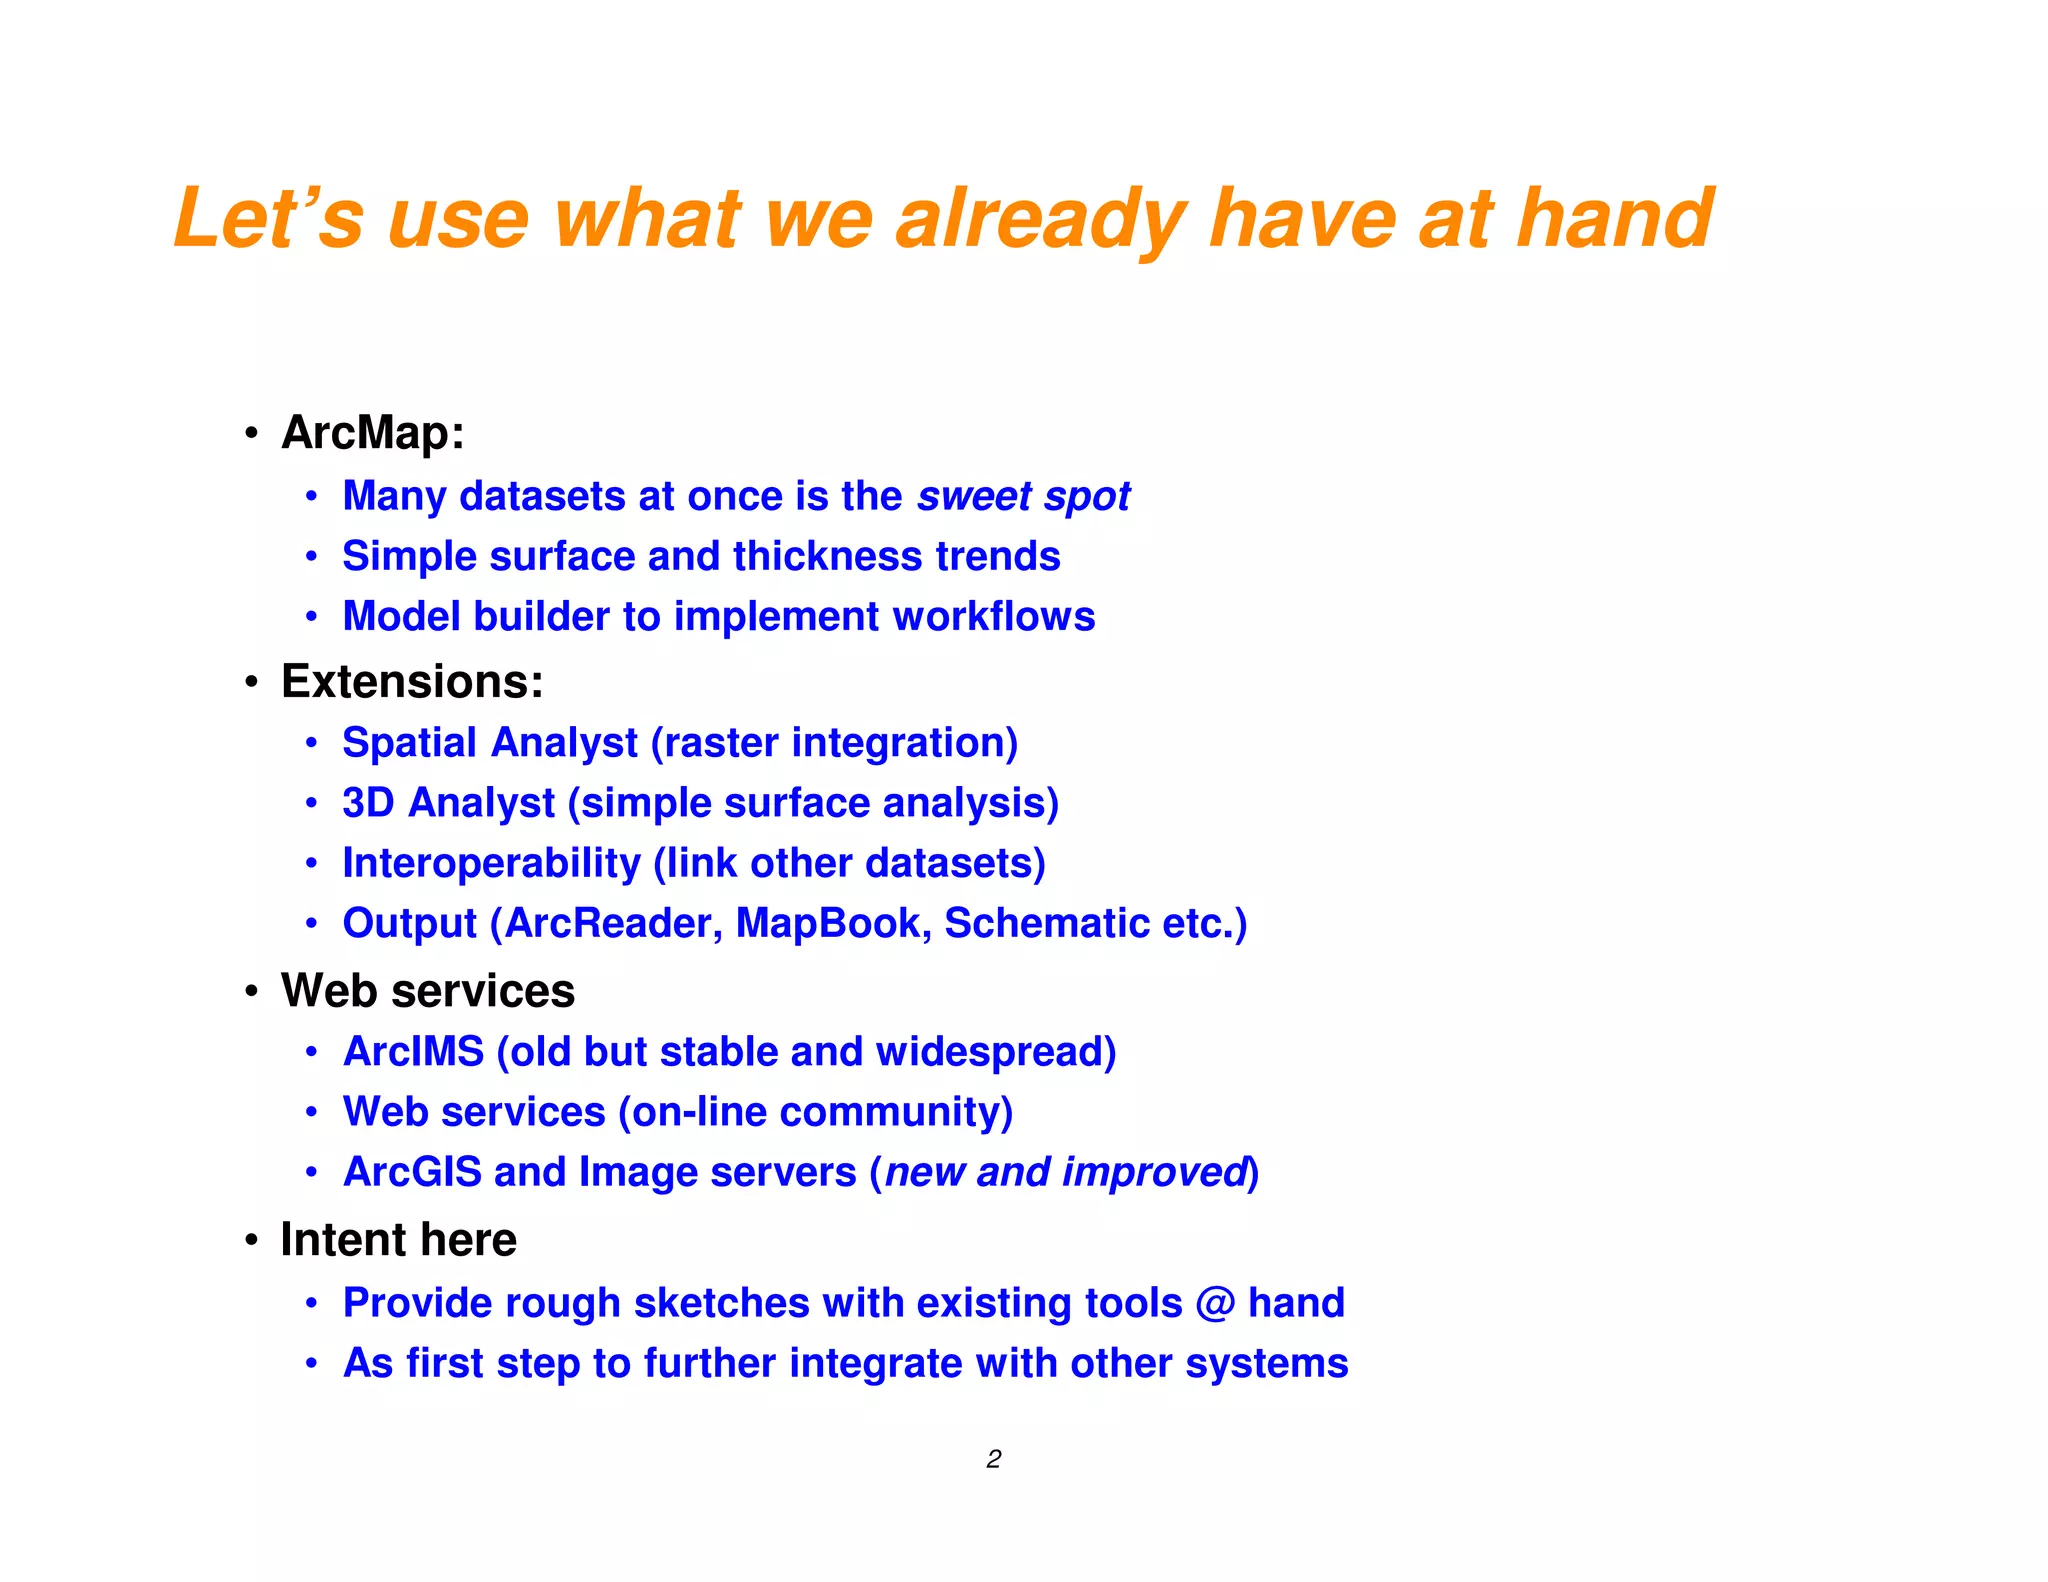
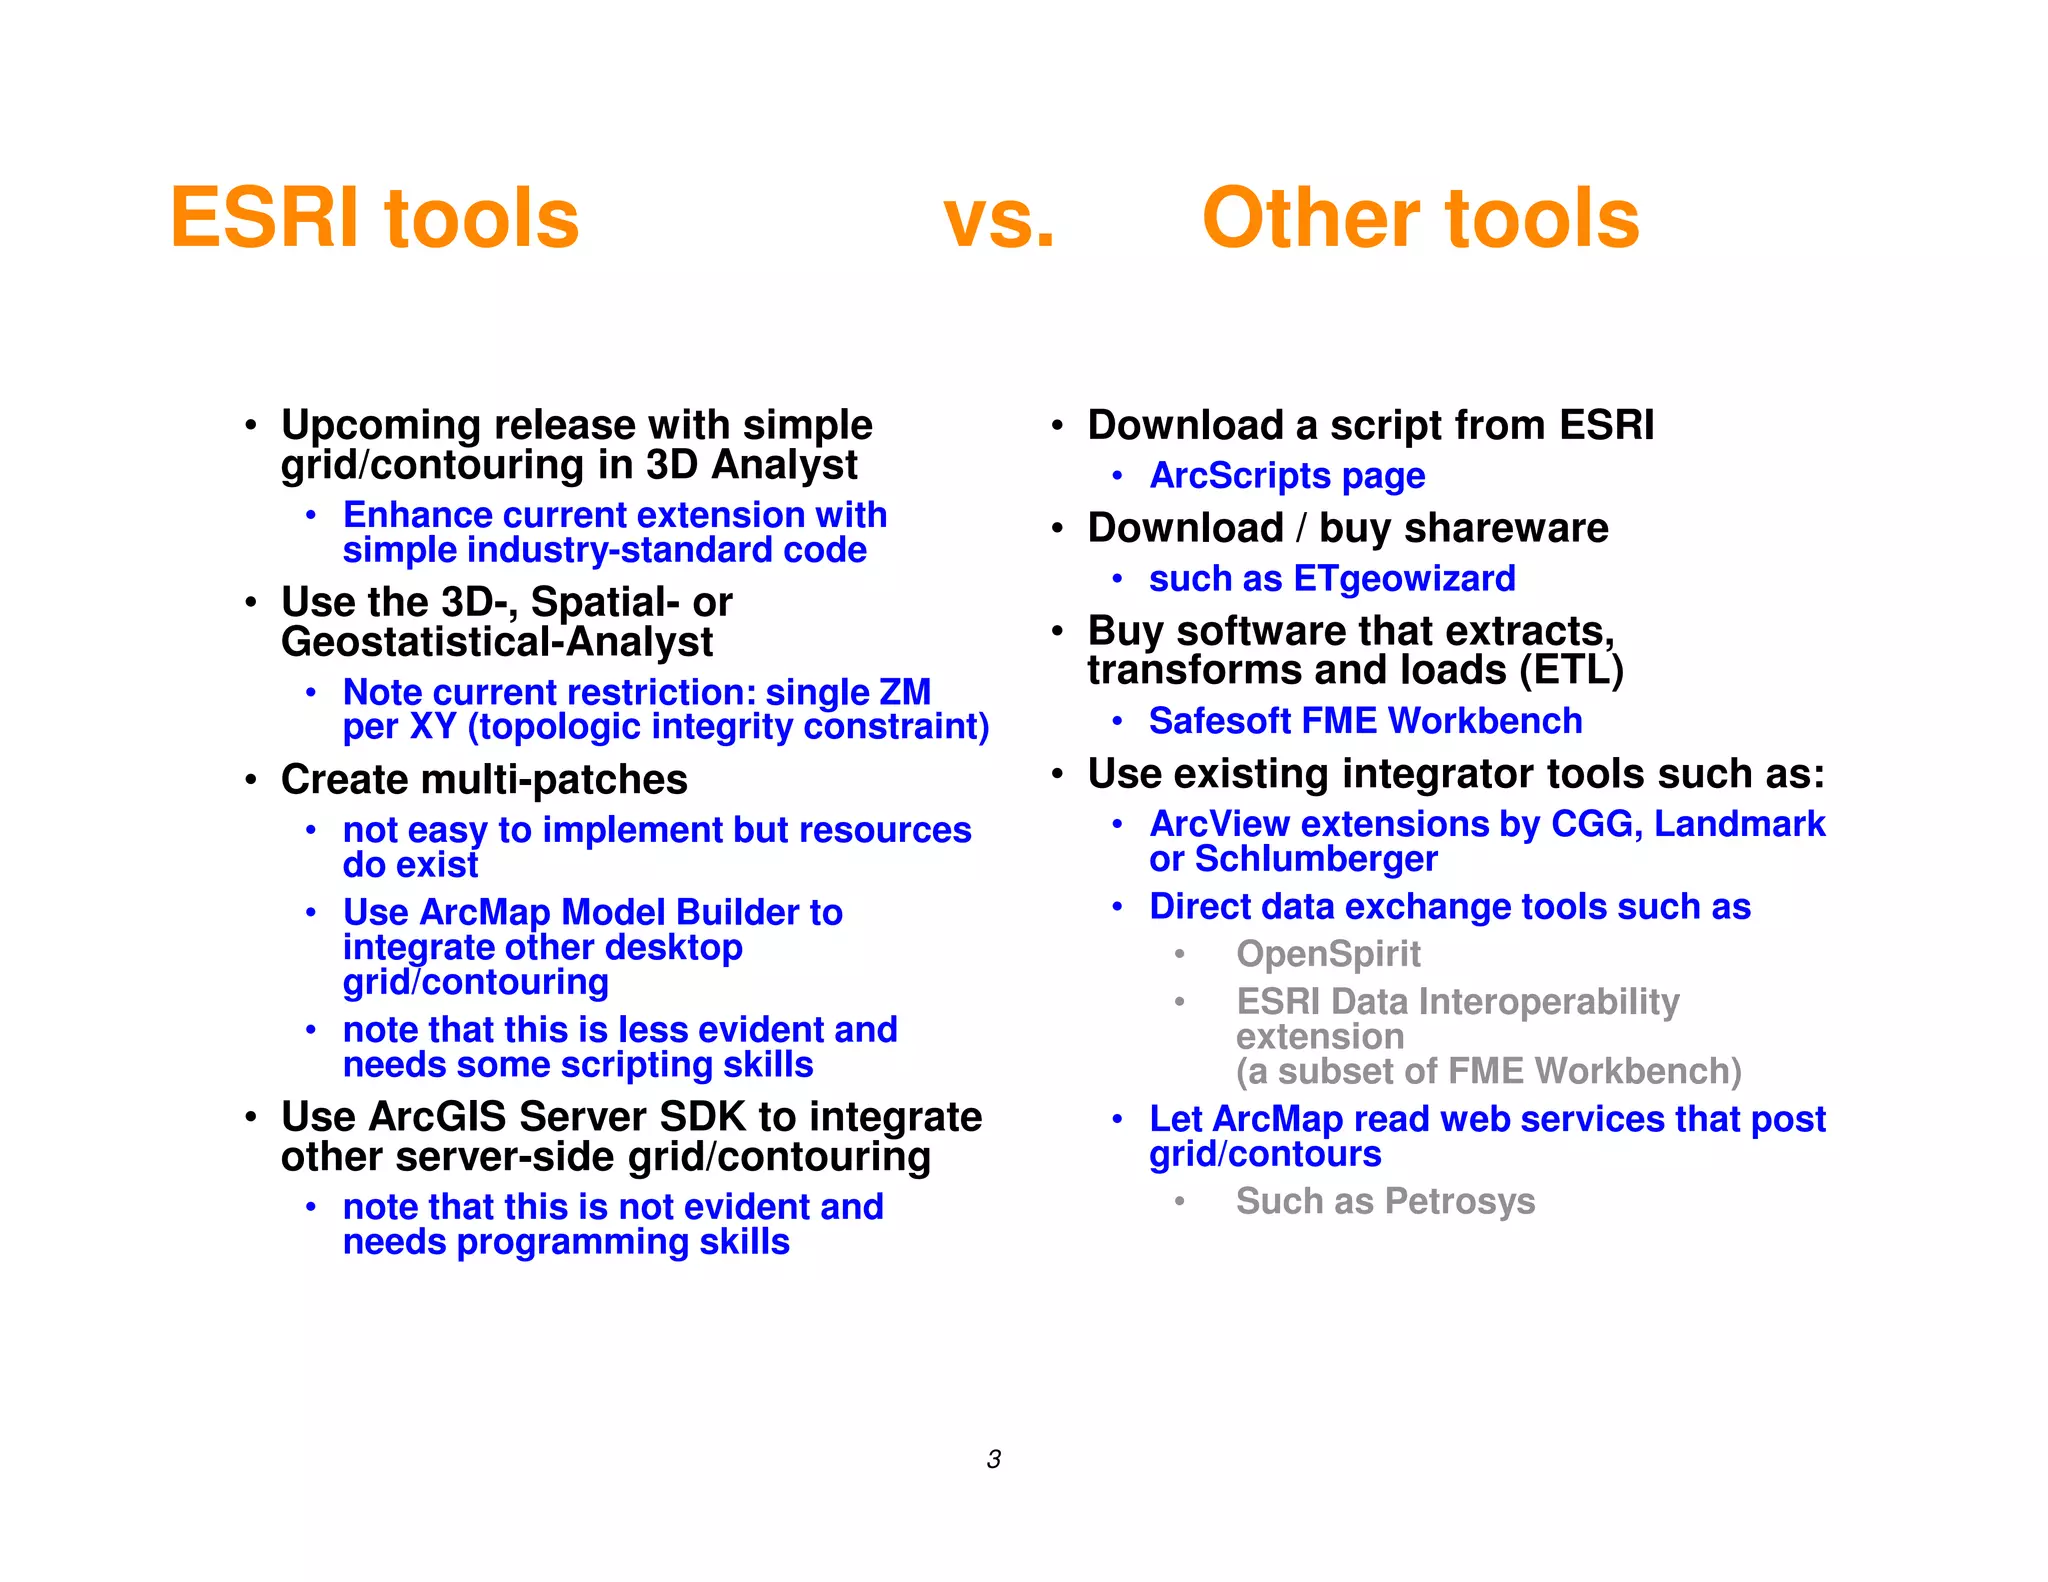
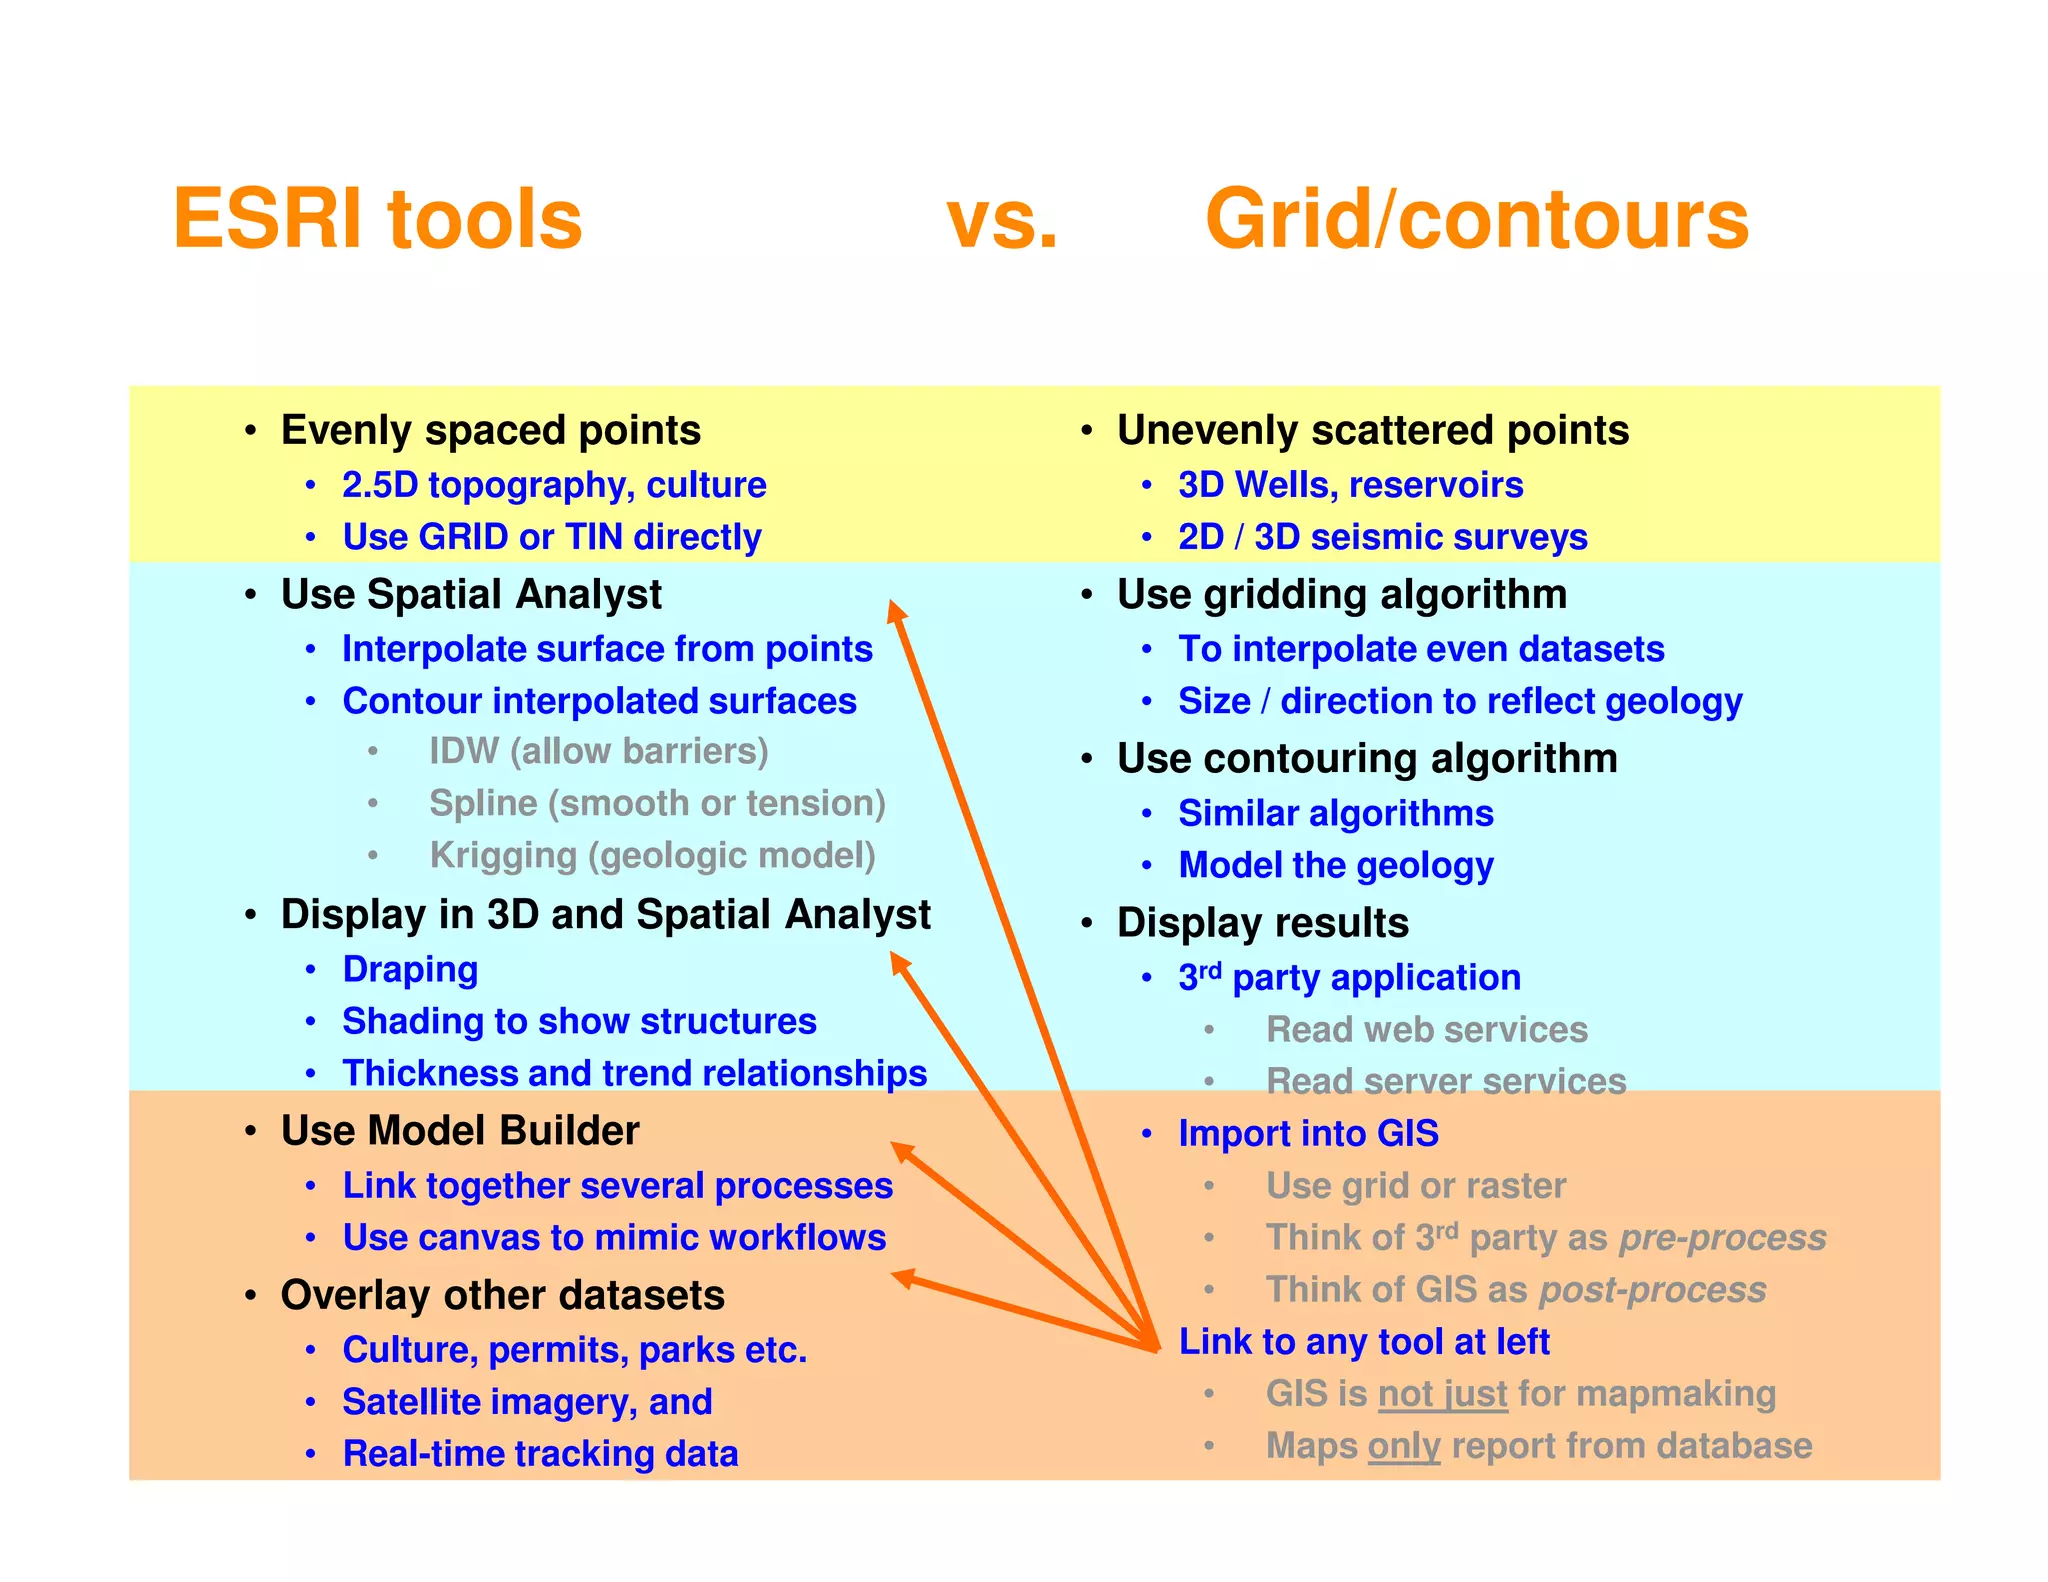
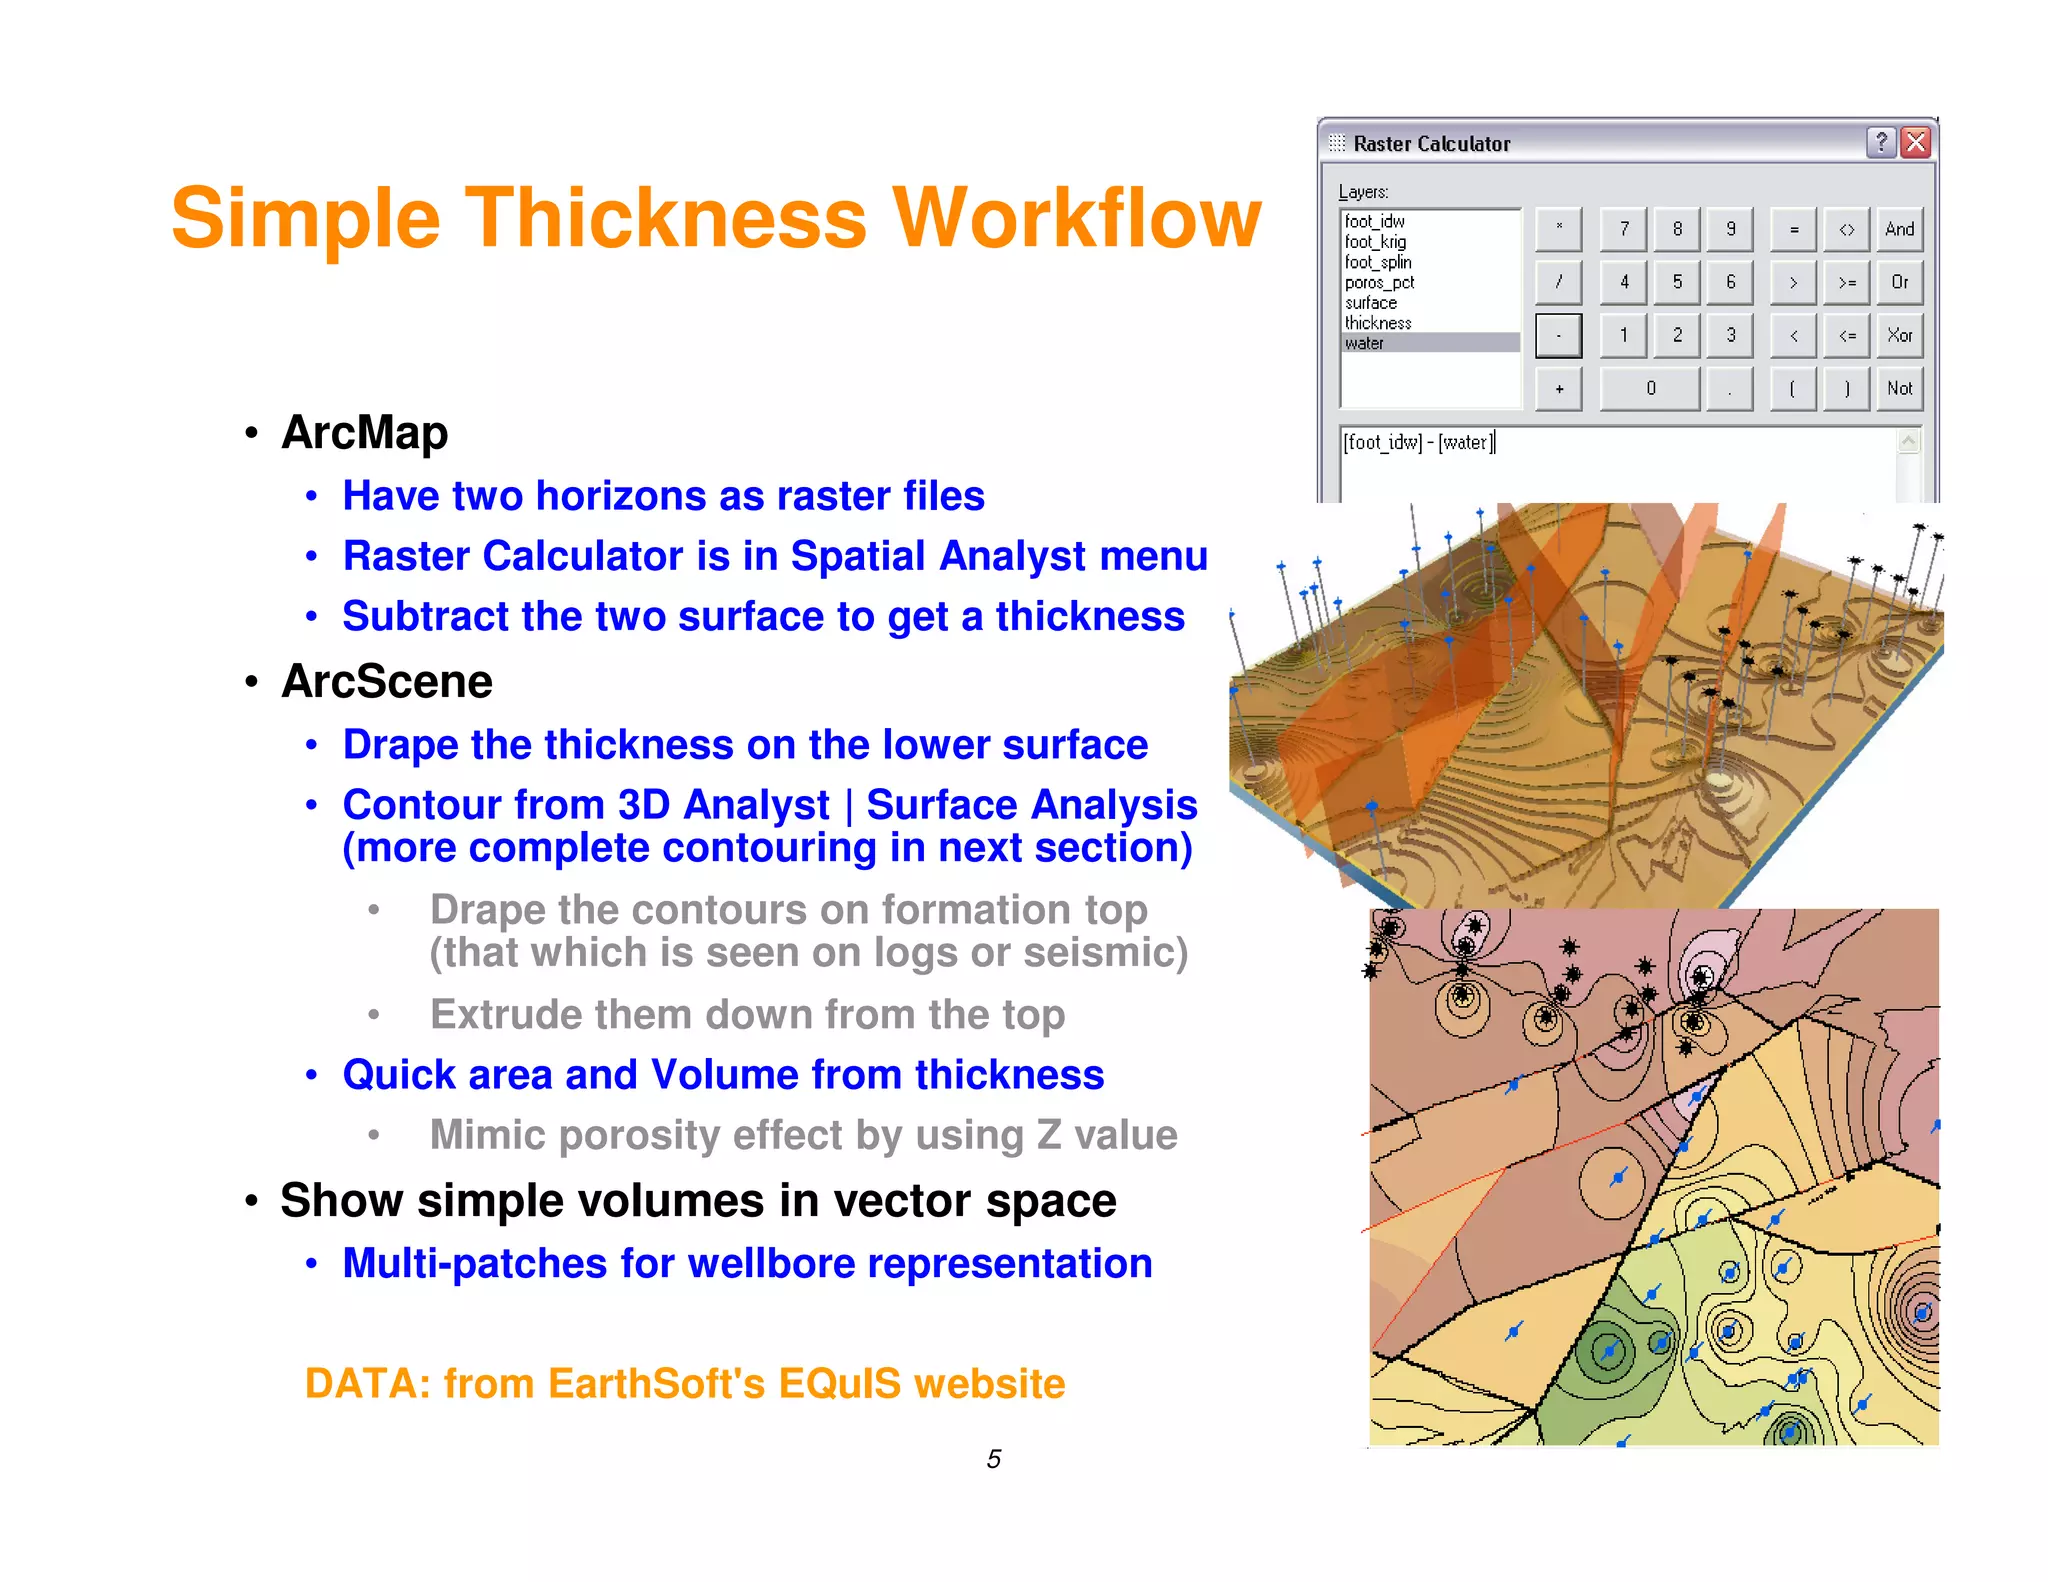
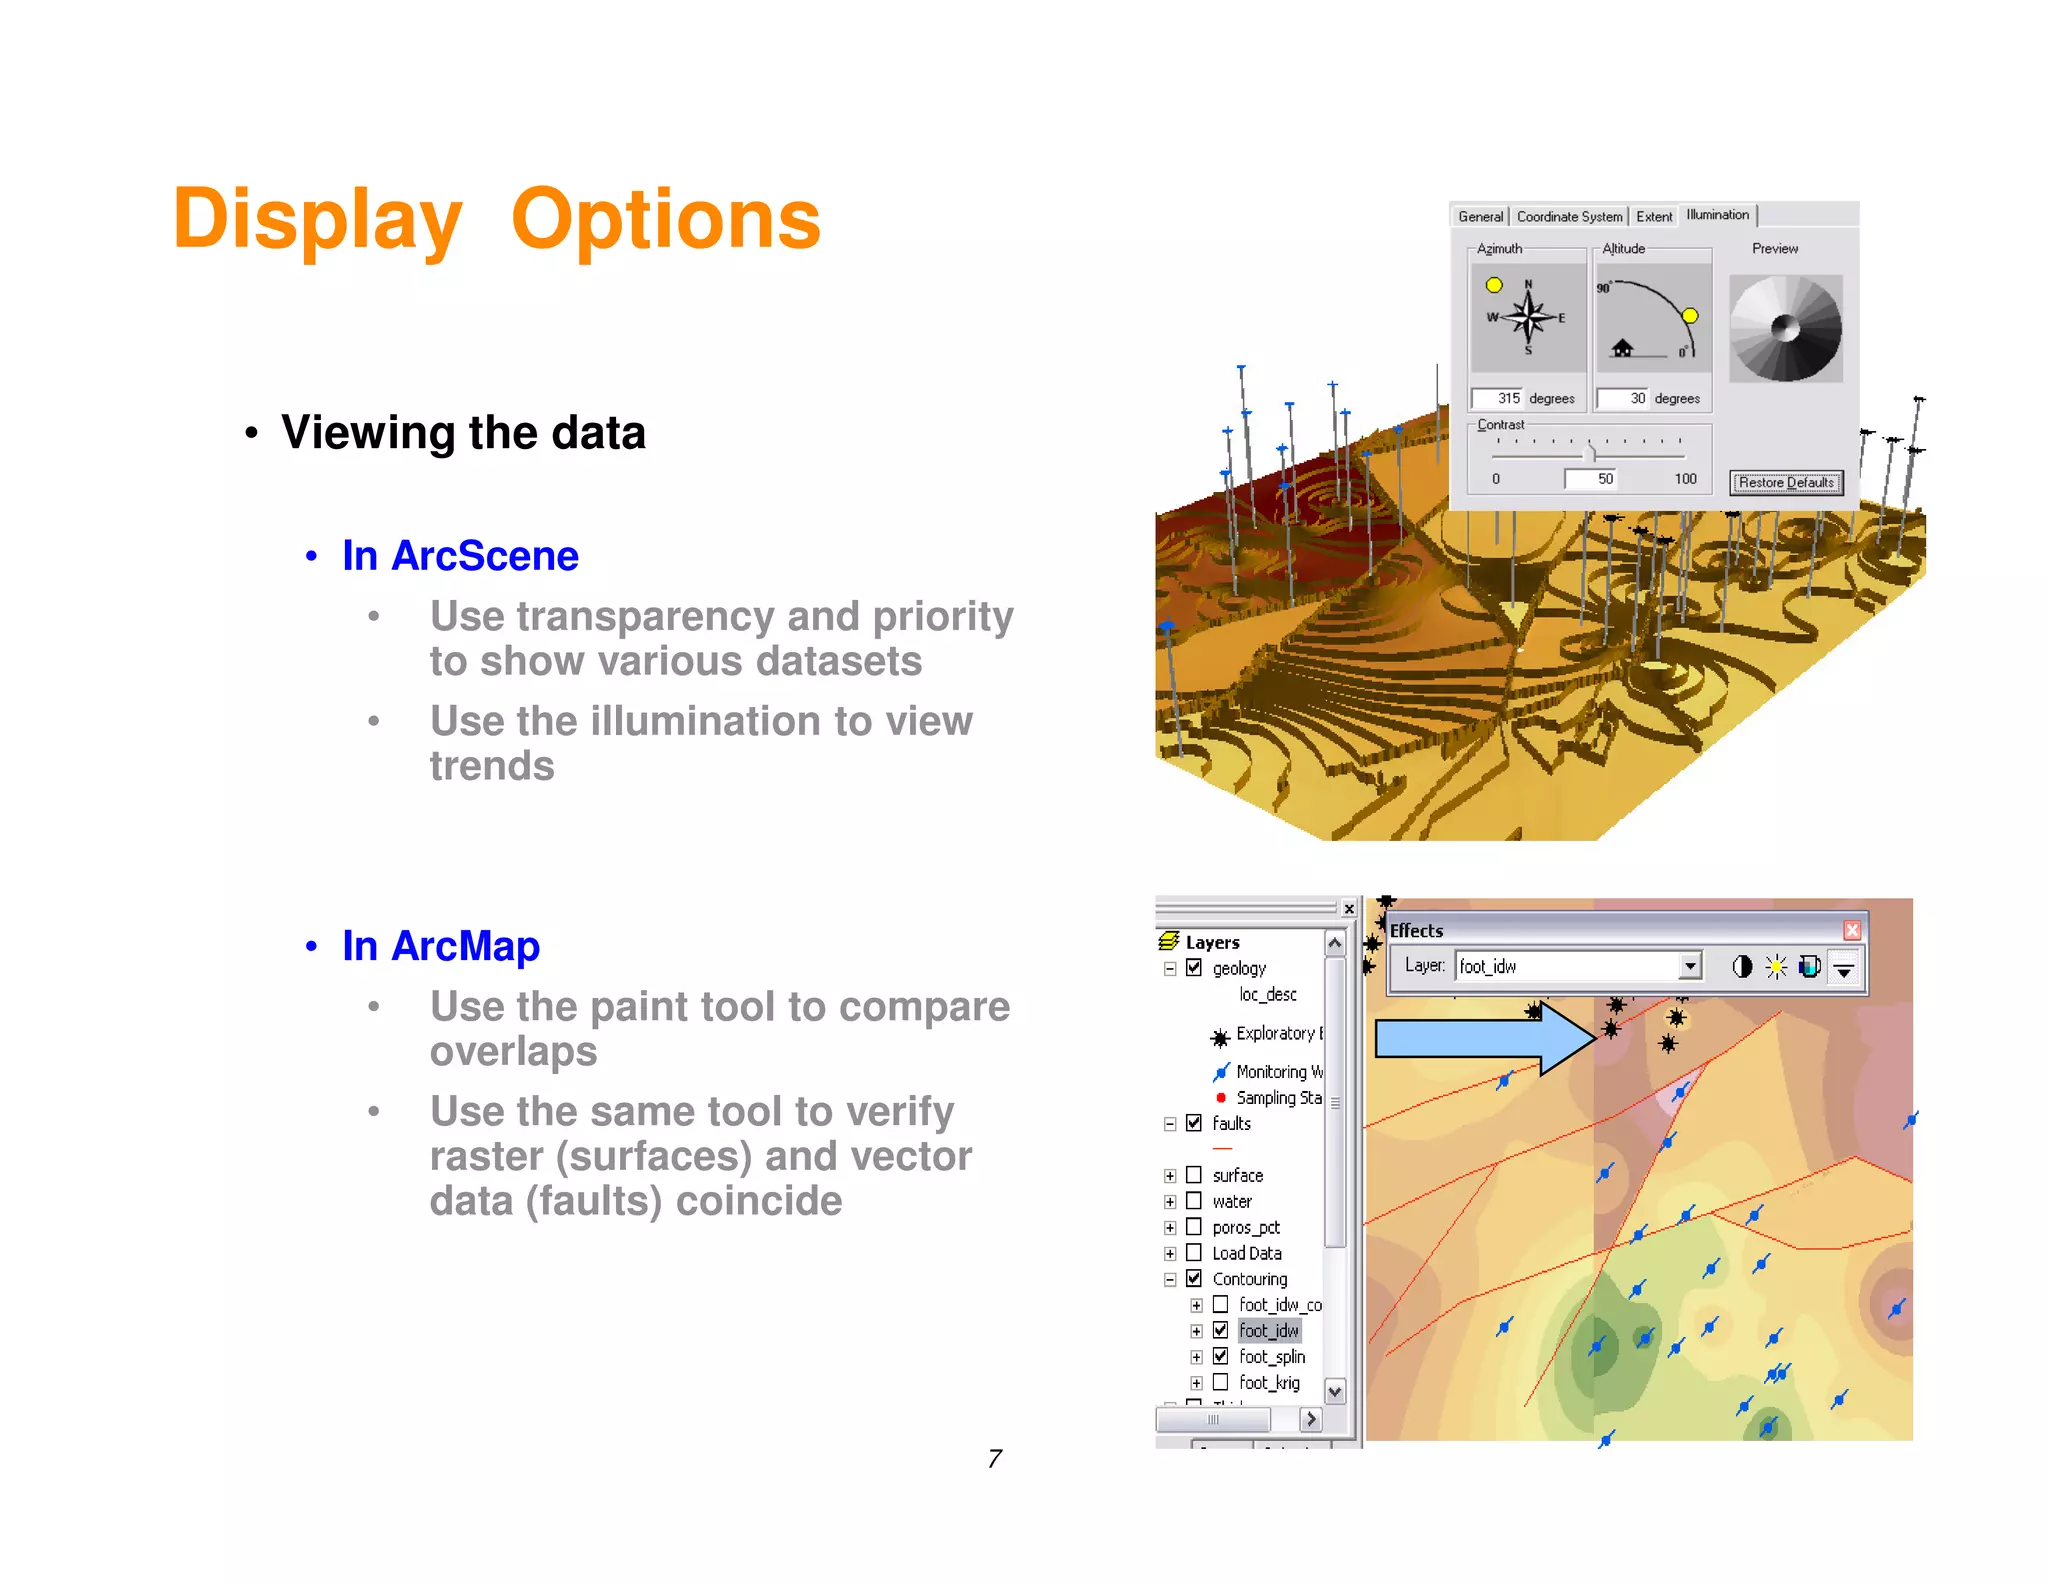
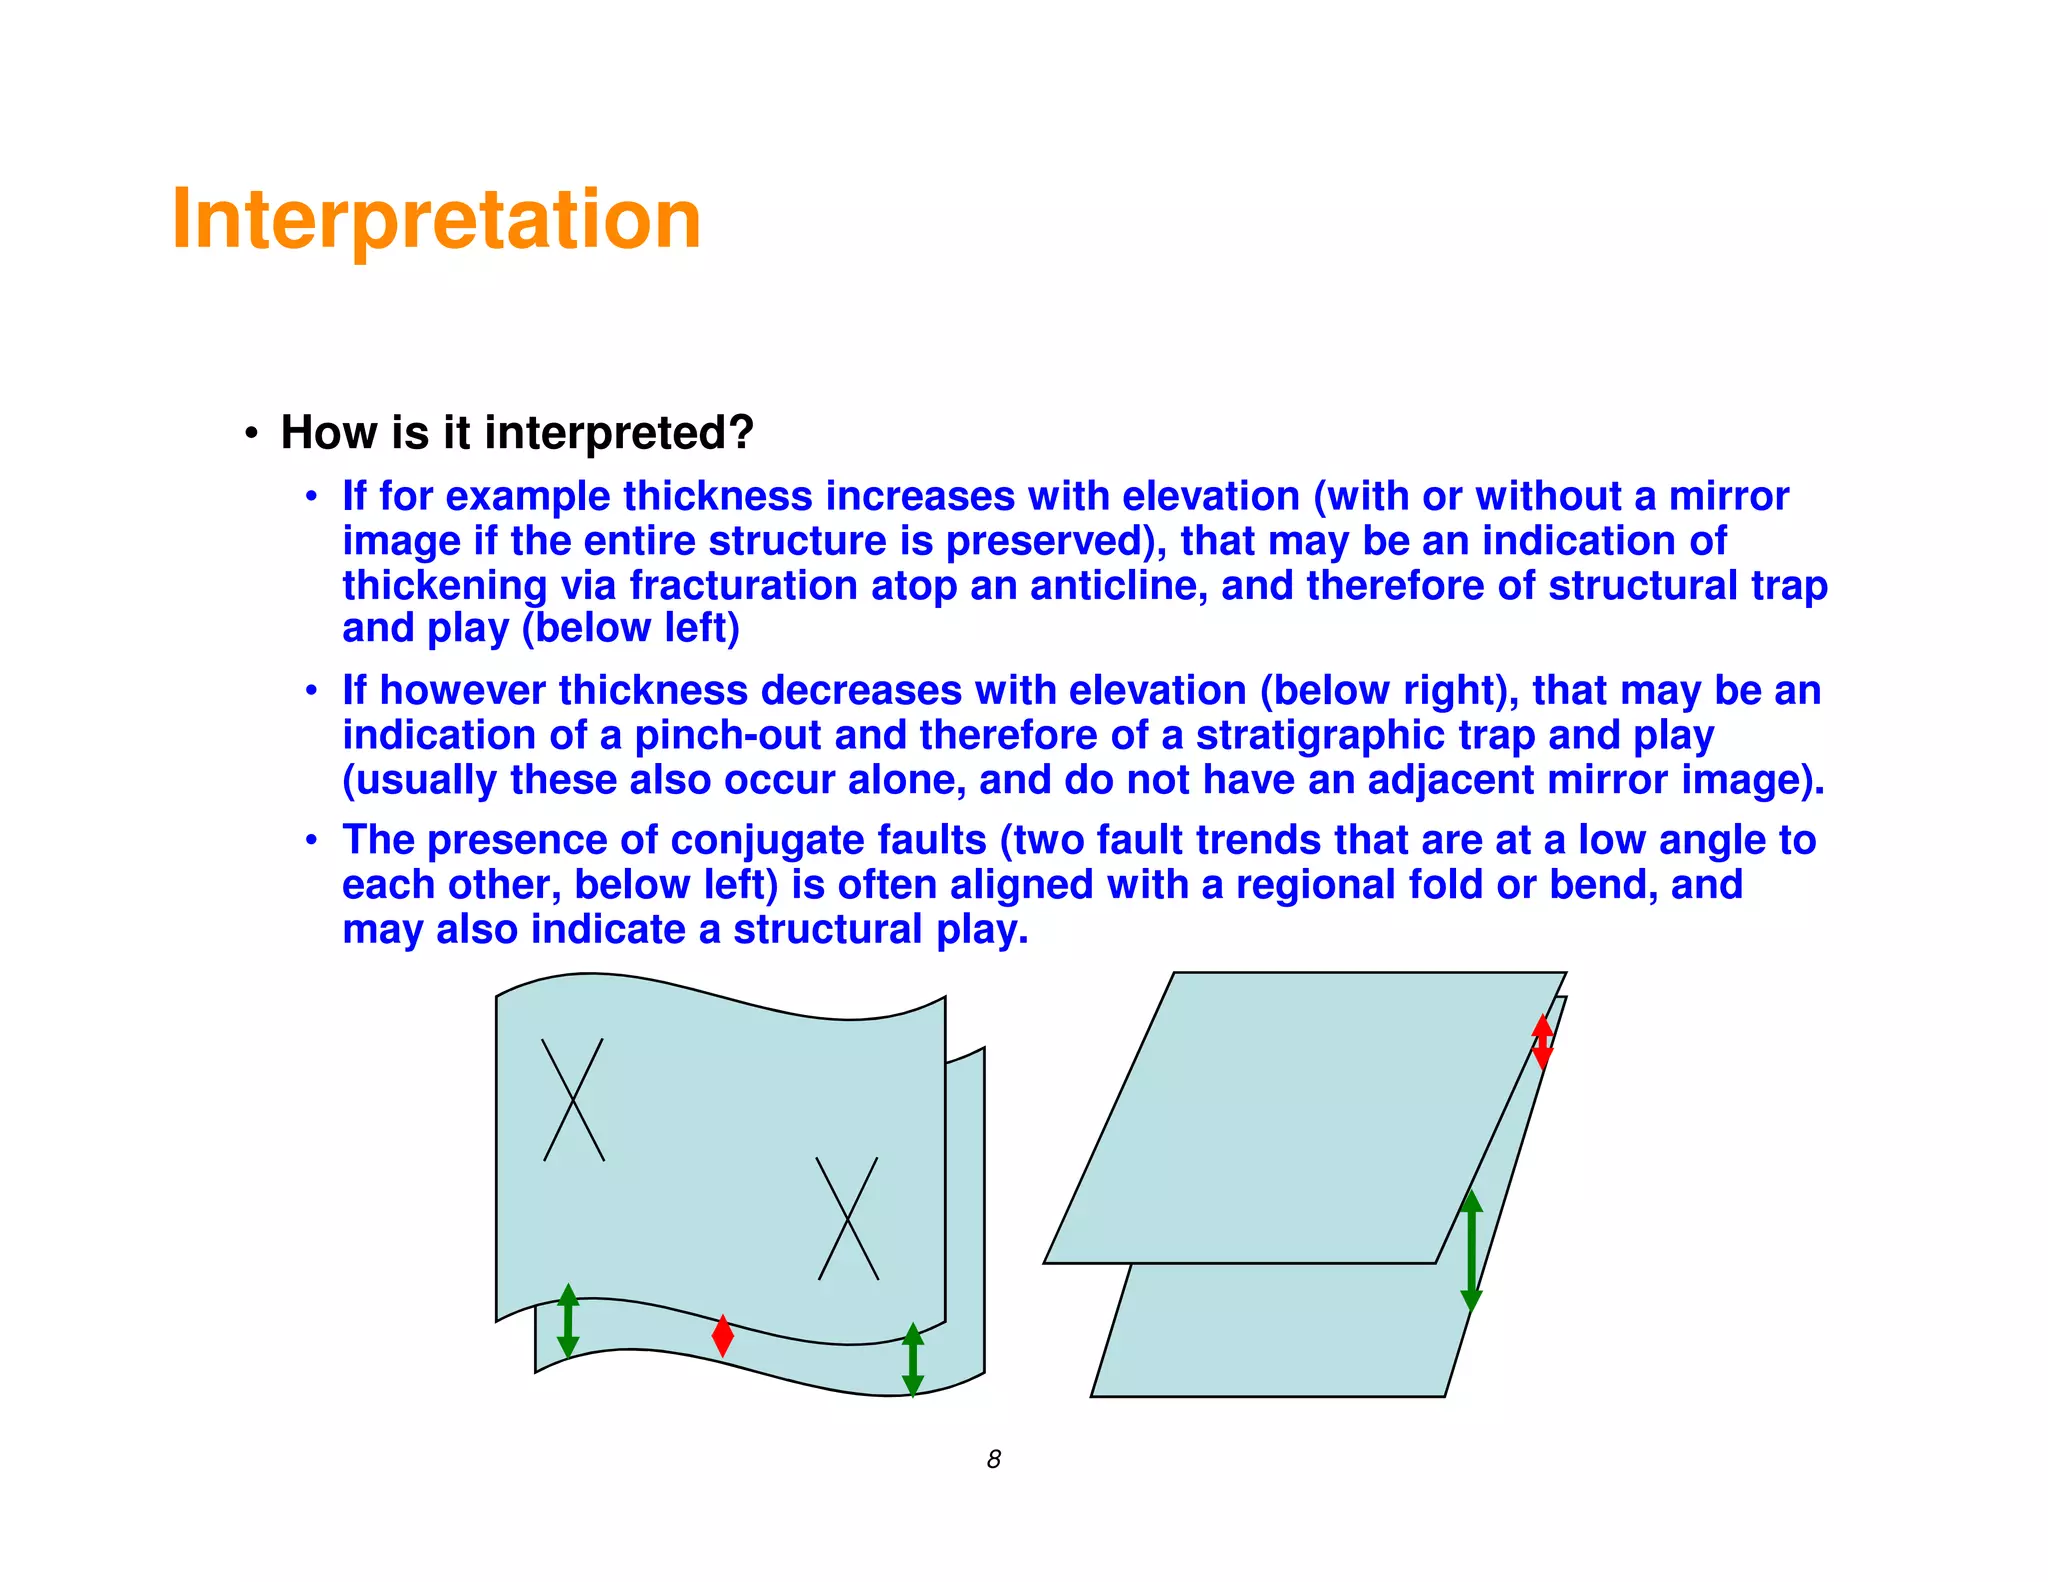

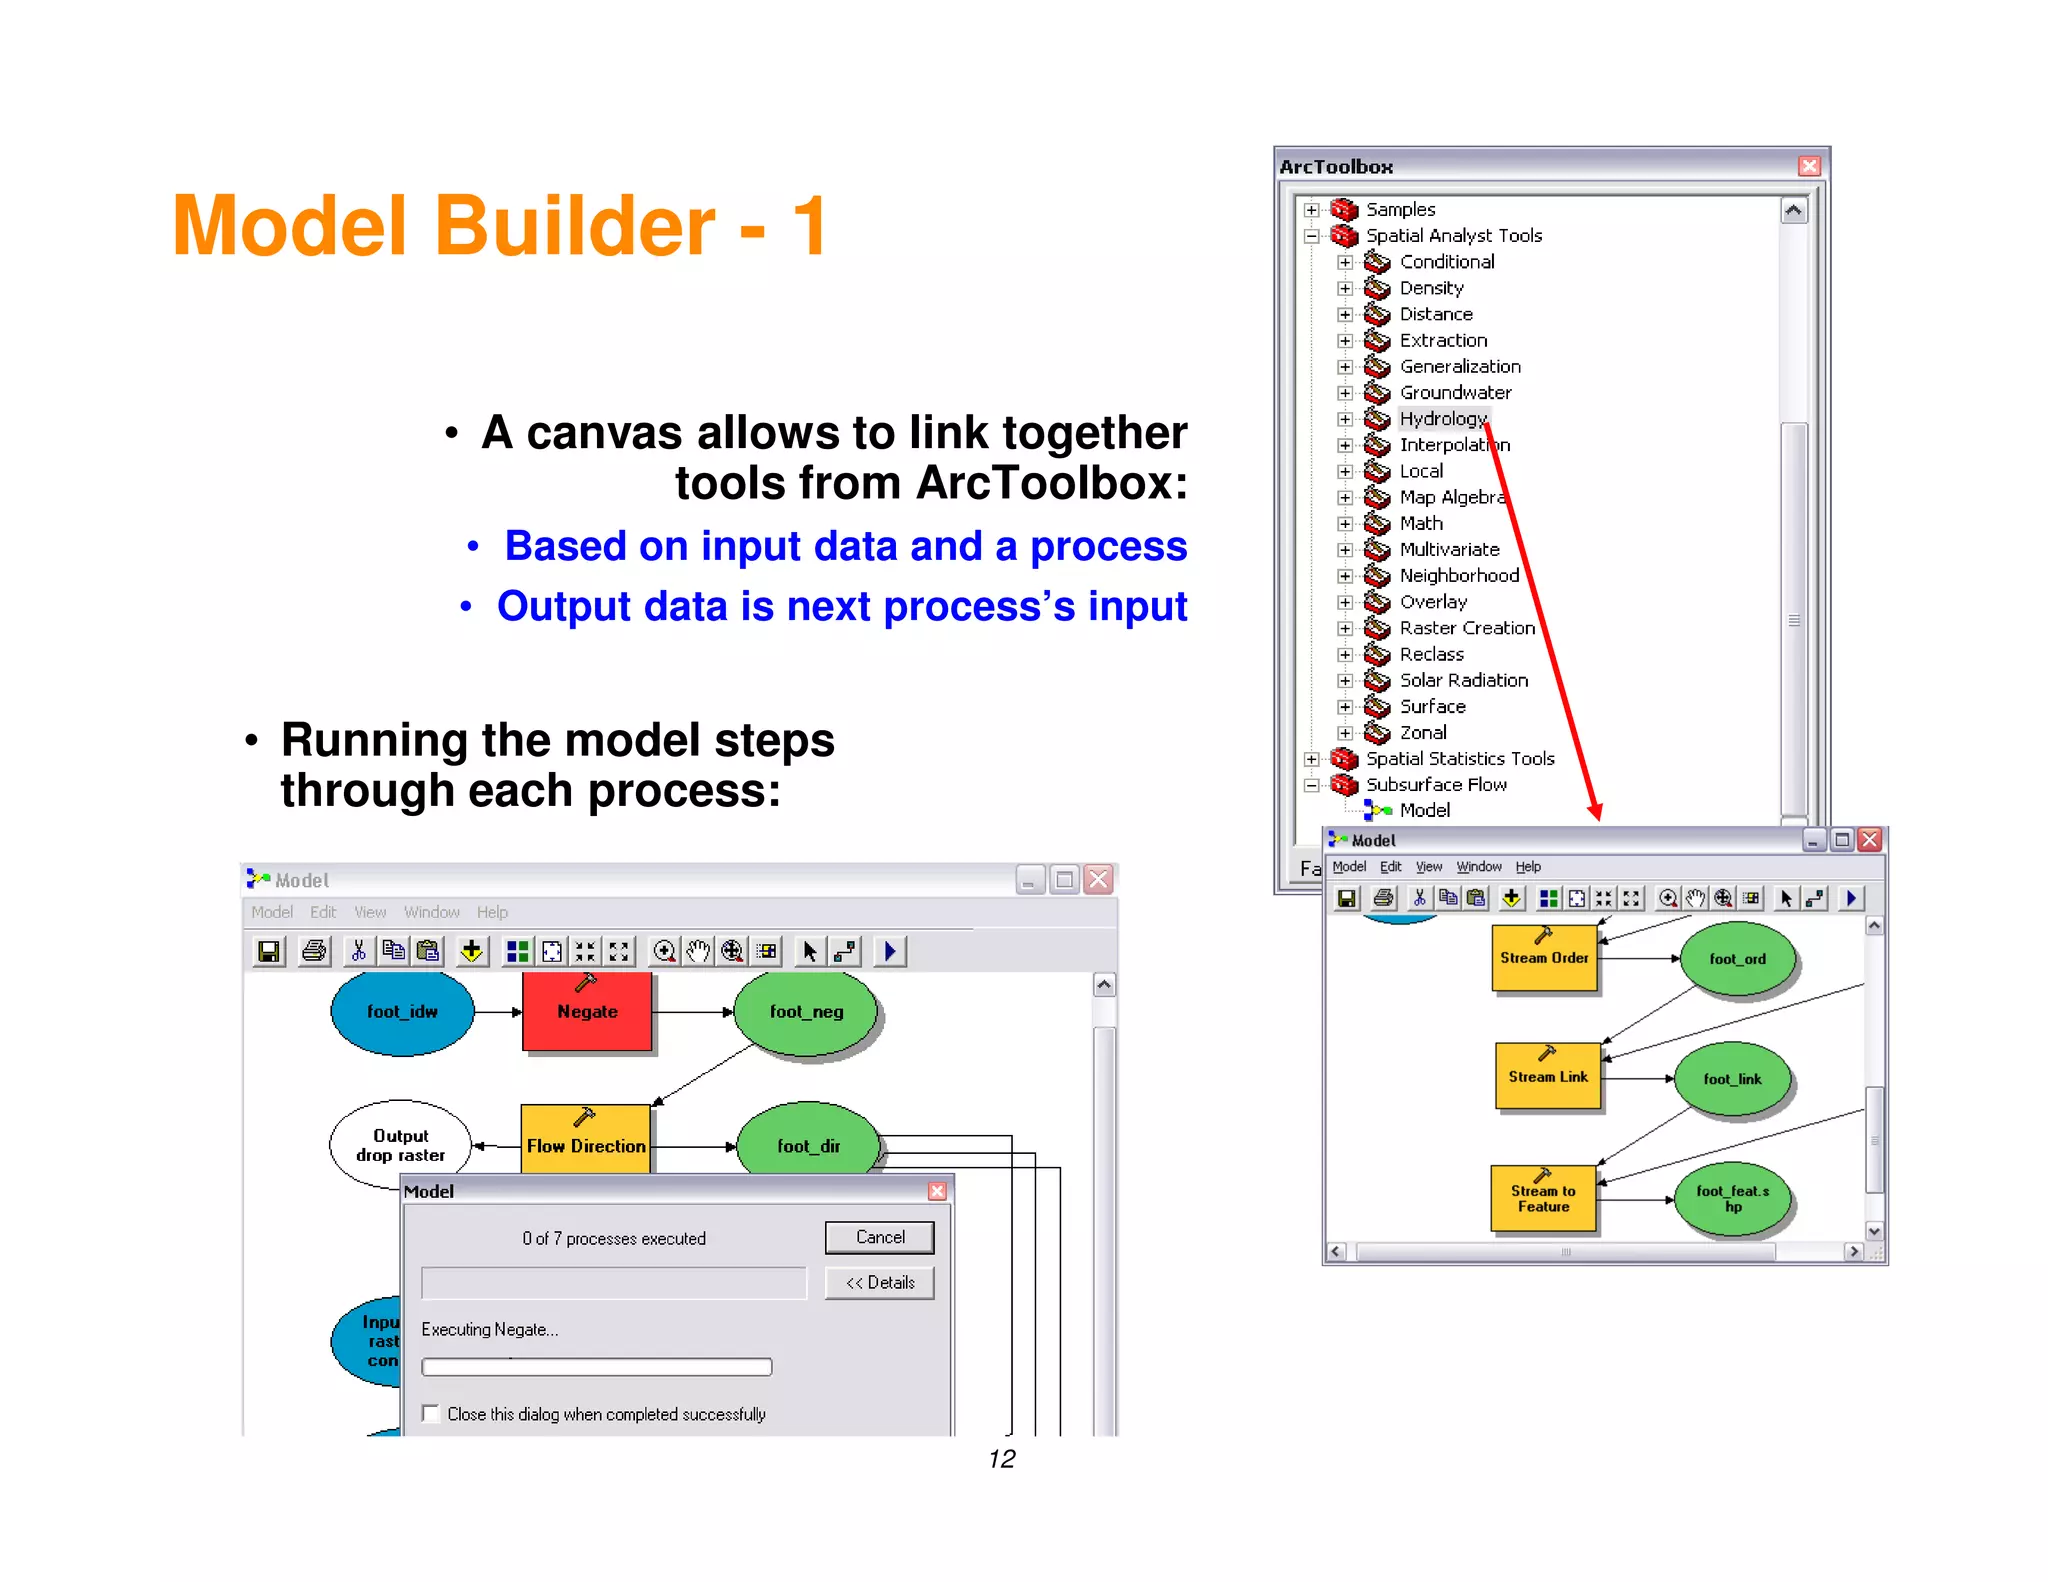
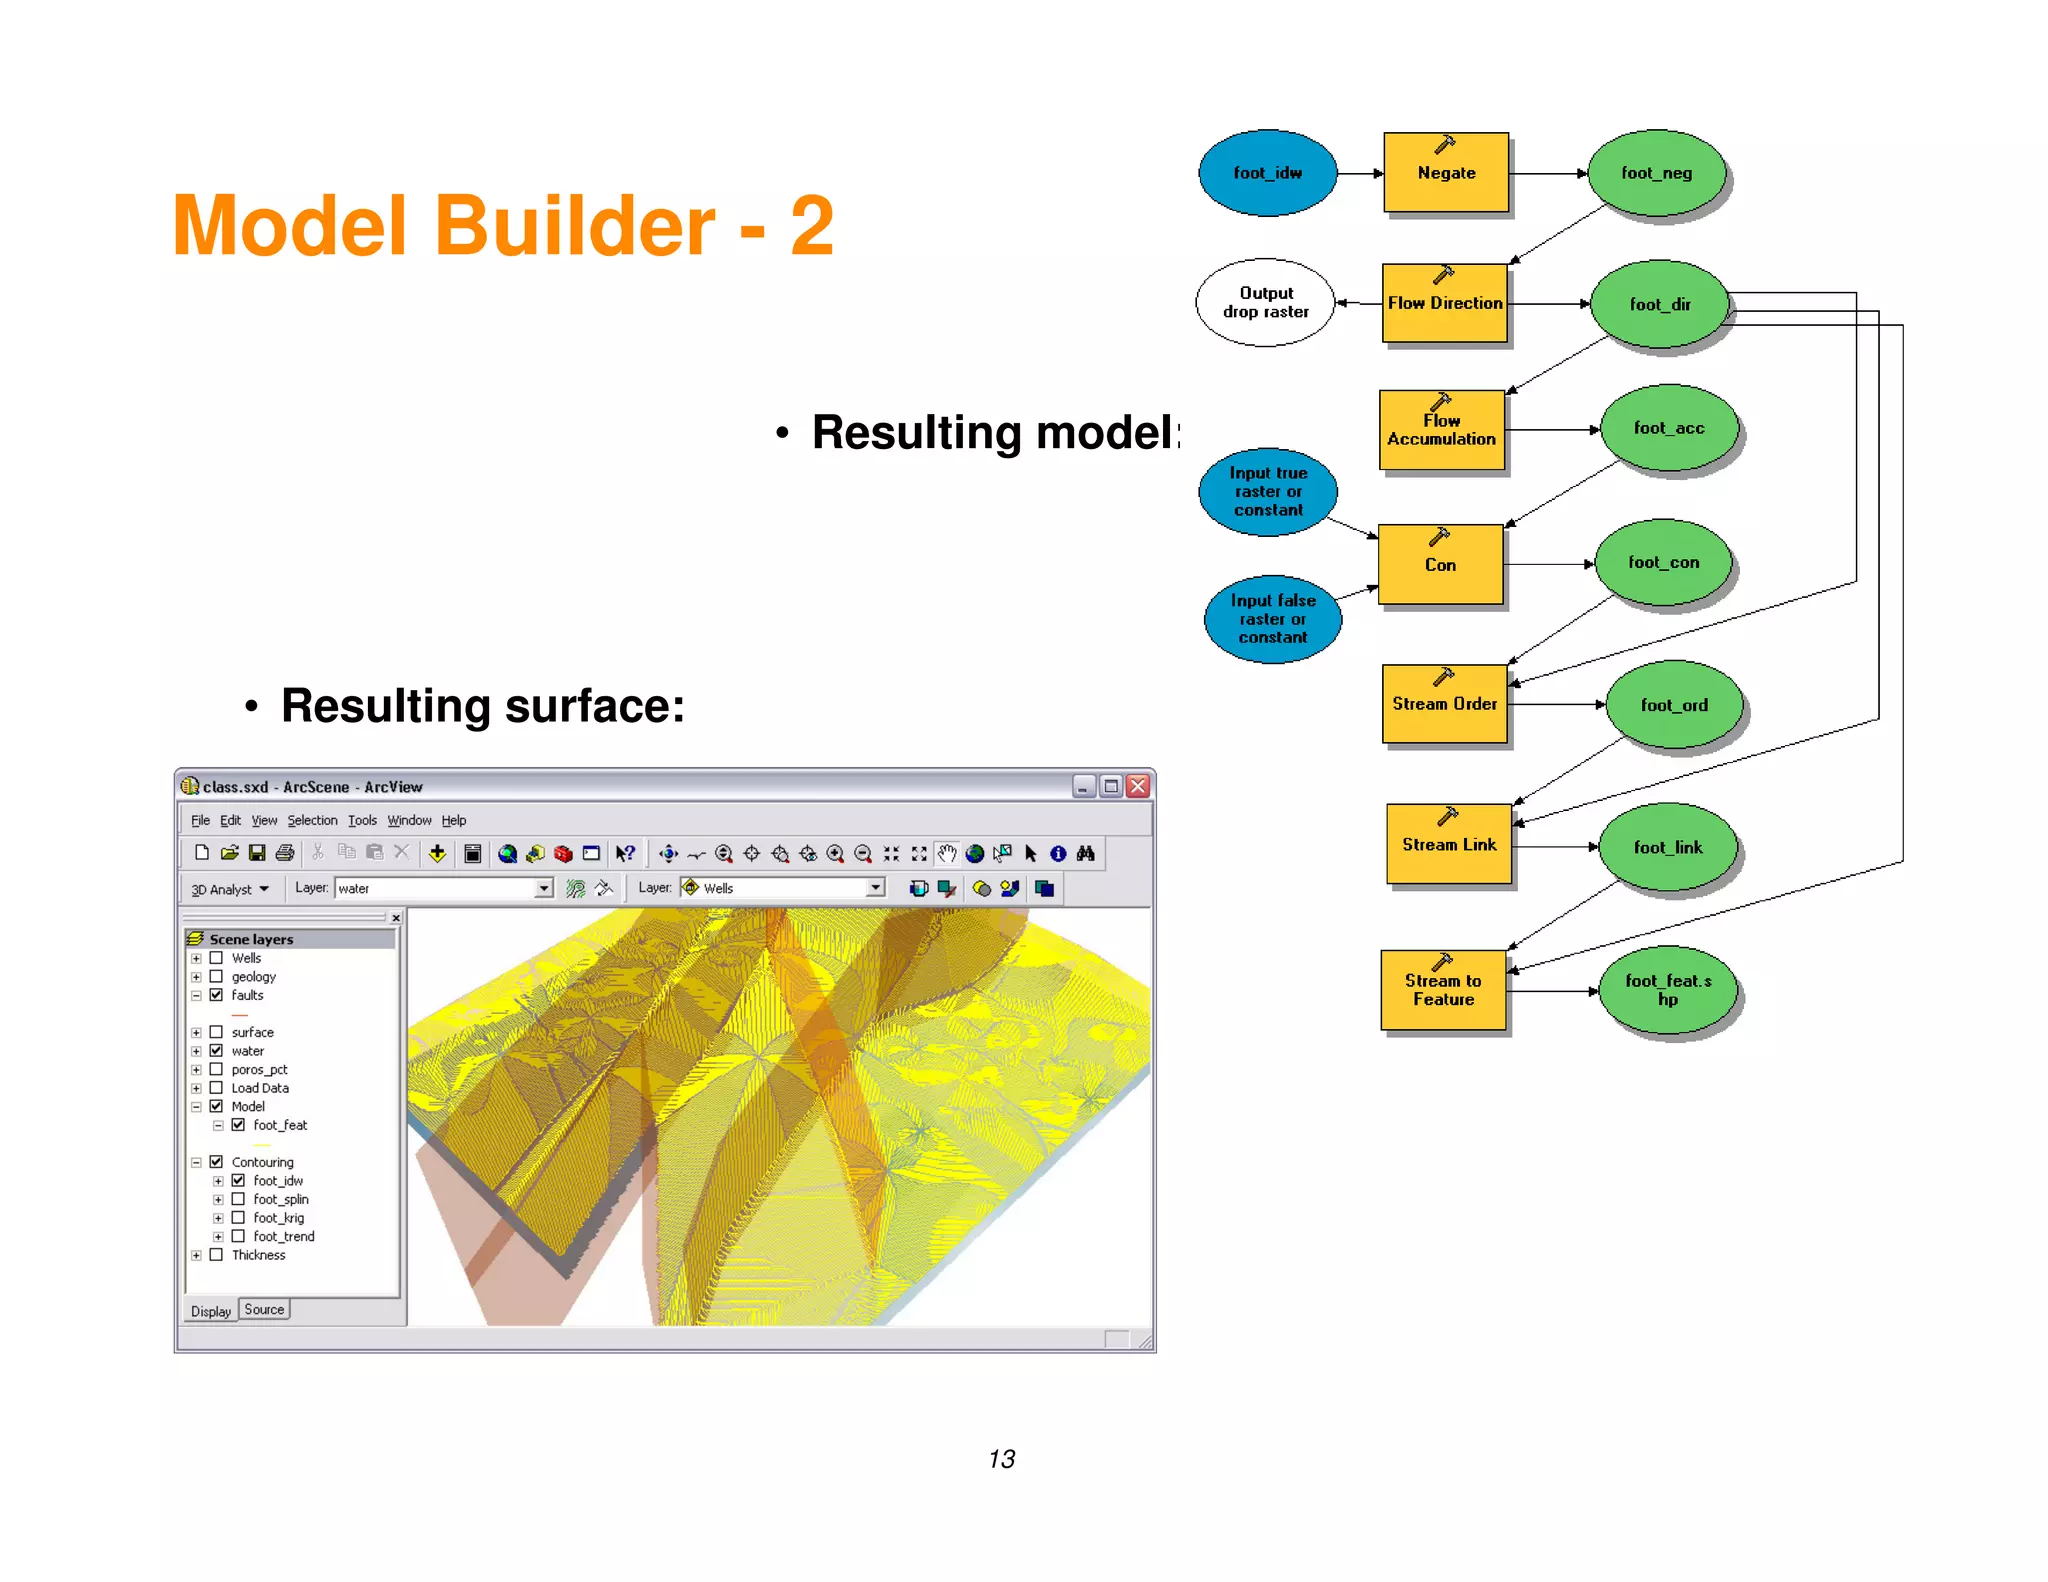

This document discusses using ESRI ArcGIS tools to perform geoscience analysis and visualization. It provides examples of using ArcMap, extensions like Spatial Analyst and 3D Analyst, and web services to [1] model simple surface and thickness trends, [2] compare ESRI tools to other gridding and contouring tools, and [3] demonstrate workflows for thickness mapping and contouring. The document concludes that ArcGIS tools can provide initial analysis and integration with other datasets but are not a replacement for specialized reservoir modeling packages.


