Combining earth observations and statistics for evidence based policy making ...Bente Lilja Bye
Arctic Frontiers 2019
Abstract
Looking at climate change, development of activities like fishing, shipping, tourism etc together with the history of policies in the polar region in and around Svalbard applying an holistic approach, can result in new information that will help us make better decisions for the Arctic area in the future.
3 different H2020 projects INTAROS, NextGEOSS, and DataBio join forces to provide new information using the latest in big data and cloud technology, access to Copernicus data and services, and user requirements from social scientists. Through analysis of different types of met-ocean data ((e.g. ice edge, SST) and fishery statistics to investigate potential links between climate change and activity in the polar region in and around Svalbard. We evaluate if the FAIR principles are met for the chosen variables, using Copernicus, BarentsWatch and other open data resources. Accessibility and functionality of the related APIs will be assessed, and whether the chosen APIs can jointly provide new information.
We will also present how one can combine available information from existing sources, such as catch reports, oceanographic measurements, oceanographic simulations, stock simulations and stock observations, can be used for improving assessment of fish stocks and their distribution. Part of these data will be derived from remote sensing, while others will be collected using vessels equipped with appropriate sensors and communication and communication tools.
Together this combinations of data will provide new information that will be useful for policy making in polar regions and that take into account the different sectors and actors involved.
Since 2014, EScIS and Cristal have worked together to implement the ESdat
EDMS to simplify the capture, management and reporting of environmental
data.
Presented by Christian Muller at the PERICLES workshop 'From Semantics of Change to Change of Semantics', University of Borås, 19 May 2015.
http://www.hb.se/en/About-UB/Current/Events/Pericles-F2F/Workshop/
How easy is it to find Insitu data on the Internet? This presentation uses a Arctic Observations Value Tree Analysis as an example of what can be found and how. Conclusions will highlight what should be improved for data dissemination systems to improve the situation. The presentation was held at the GEO Data Technology Workshop in April 2019.
EmerGEO, la aplicación para prevenir incendiosEsri
La Guardia Civil utiliza tecnología geográfica Esri para ayudar en la prevención y extinción de incendios de forma más inteligente y eficiente, manejando mejor los recursos.
Si quieres saber más, visita: http://www.esri.es/
Komal Anand Doshi presented on their projects at the Mobi Platform at the Transforming Transportation 2015.
Transforming Transportation 2015: Smart Cities for Shared Prosperity is the annual conference co-organized by the World Resources Institute and the World Bank.
Geographic information systems and location analytics change how we think and act. It alters what we measure, how we analyze things, and what predictions we make. It changes how we plan, design, evaluate, and ultimately manage our projects. GIS has scaled and is moving beyond projects or single systems to embrace organizational missions and become a pervasive force of change. But is this reality possible? GIS is the next GPS where our businesses, communities, and society can chart new directions. Discover how the mix of art, science, action, ideas, and collaboration turn this powerful notion into outcomes.
Las TI aplicadas a una Smart city o una Smart University como la Universidad de Alicante. Soluciones según la naturaleza de una comunidad como es la Universidad de Alicante
5 Unexpected Ways To Use Location AnalyticsQlikMaps
See the full webinar here >> http://ow.ly/YxvAE
Whether you are deciding how to utilize and implement location analytics for your company or you have a location analytics tool and you need to break from the status-quo, this webinar will be sure to trigger your imagination and help you unlock the hidden value of location in your company’s data.
Die Hysteroskopie zählt zur Basisdiagnostik des unerfüllten Kinderwunschs. Welche Kenntnisse lassen sich damit gewinnen? Wann sollte man sie durchführen?
INIA- CISA: Análisis de las amenazas en la fauna silvestreEsri
El Centro de Investigación en Sanidad Animal del Instituto Nacional de Investigación y Tecnología Agraria y Alimentaria utiliza la tecnología SIG para una mejor comprensión de las amenazas a las especies silvestres y su asociación con las actividades humanas
Corporate brochure for applied oceanography specialist Tidetech to take to commercial maritime conferences in Europe and Asia.
Words by me. Design by Dermot Heneghan.
GDG Cloud Southlake #33: Boule & Rebala: Effective AppSec in SDLC using Deplo...James Anderson
Effective Application Security in Software Delivery lifecycle using Deployment Firewall and DBOM
The modern software delivery process (or the CI/CD process) includes many tools, distributed teams, open-source code, and cloud platforms. Constant focus on speed to release software to market, along with the traditional slow and manual security checks has caused gaps in continuous security as an important piece in the software supply chain. Today organizations feel more susceptible to external and internal cyber threats due to the vast attack surface in their applications supply chain and the lack of end-to-end governance and risk management.
The software team must secure its software delivery process to avoid vulnerability and security breaches. This needs to be achieved with existing tool chains and without extensive rework of the delivery processes. This talk will present strategies and techniques for providing visibility into the true risk of the existing vulnerabilities, preventing the introduction of security issues in the software, resolving vulnerabilities in production environments quickly, and capturing the deployment bill of materials (DBOM).
Speakers:
Bob Boule
Robert Boule is a technology enthusiast with PASSION for technology and making things work along with a knack for helping others understand how things work. He comes with around 20 years of solution engineering experience in application security, software continuous delivery, and SaaS platforms. He is known for his dynamic presentations in CI/CD and application security integrated in software delivery lifecycle.
Gopinath Rebala
Gopinath Rebala is the CTO of OpsMx, where he has overall responsibility for the machine learning and data processing architectures for Secure Software Delivery. Gopi also has a strong connection with our customers, leading design and architecture for strategic implementations. Gopi is a frequent speaker and well-known leader in continuous delivery and integrating security into software delivery.
DevOps and Testing slides at DASA ConnectKari Kakkonen
My and Rik Marselis slides at 30.5.2024 DASA Connect conference. We discuss about what is testing, then what is agile testing and finally what is Testing in DevOps. Finally we had lovely workshop with the participants trying to find out different ways to think about quality and testing in different parts of the DevOps infinity loop.
Encryption in Microsoft 365 - ExpertsLive Netherlands 2024Albert Hoitingh
In this session I delve into the encryption technology used in Microsoft 365 and Microsoft Purview. Including the concepts of Customer Key and Double Key Encryption.
Connector Corner: Automate dynamic content and events by pushing a buttonDianaGray10
Here is something new! In our next Connector Corner webinar, we will demonstrate how you can use a single workflow to:
Create a campaign using Mailchimp with merge tags/fields
Send an interactive Slack channel message (using buttons)
Have the message received by managers and peers along with a test email for review
But there’s more:
In a second workflow supporting the same use case, you’ll see:
Your campaign sent to target colleagues for approval
If the “Approve” button is clicked, a Jira/Zendesk ticket is created for the marketing design team
But—if the “Reject” button is pushed, colleagues will be alerted via Slack message
Join us to learn more about this new, human-in-the-loop capability, brought to you by Integration Service connectors.
And...
Speakers:
Akshay Agnihotri, Product Manager
Charlie Greenberg, Host
Generating a custom Ruby SDK for your web service or Rails API using Smithyg2nightmarescribd
Have you ever wanted a Ruby client API to communicate with your web service? Smithy is a protocol-agnostic language for defining services and SDKs. Smithy Ruby is an implementation of Smithy that generates a Ruby SDK using a Smithy model. In this talk, we will explore Smithy and Smithy Ruby to learn how to generate custom feature-rich SDKs that can communicate with any web service, such as a Rails JSON API.
Essentials of Automations: Optimizing FME Workflows with ParametersSafe Software
Are you looking to streamline your workflows and boost your projects’ efficiency? Do you find yourself searching for ways to add flexibility and control over your FME workflows? If so, you’re in the right place.
Join us for an insightful dive into the world of FME parameters, a critical element in optimizing workflow efficiency. This webinar marks the beginning of our three-part “Essentials of Automation” series. This first webinar is designed to equip you with the knowledge and skills to utilize parameters effectively: enhancing the flexibility, maintainability, and user control of your FME projects.
Here’s what you’ll gain:
- Essentials of FME Parameters: Understand the pivotal role of parameters, including Reader/Writer, Transformer, User, and FME Flow categories. Discover how they are the key to unlocking automation and optimization within your workflows.
- Practical Applications in FME Form: Delve into key user parameter types including choice, connections, and file URLs. Allow users to control how a workflow runs, making your workflows more reusable. Learn to import values and deliver the best user experience for your workflows while enhancing accuracy.
- Optimization Strategies in FME Flow: Explore the creation and strategic deployment of parameters in FME Flow, including the use of deployment and geometry parameters, to maximize workflow efficiency.
- Pro Tips for Success: Gain insights on parameterizing connections and leveraging new features like Conditional Visibility for clarity and simplicity.
We’ll wrap up with a glimpse into future webinars, followed by a Q&A session to address your specific questions surrounding this topic.
Don’t miss this opportunity to elevate your FME expertise and drive your projects to new heights of efficiency.
UiPath Test Automation using UiPath Test Suite series, part 4DianaGray10
Welcome to UiPath Test Automation using UiPath Test Suite series part 4. In this session, we will cover Test Manager overview along with SAP heatmap.
The UiPath Test Manager overview with SAP heatmap webinar offers a concise yet comprehensive exploration of the role of a Test Manager within SAP environments, coupled with the utilization of heatmaps for effective testing strategies.
Participants will gain insights into the responsibilities, challenges, and best practices associated with test management in SAP projects. Additionally, the webinar delves into the significance of heatmaps as a visual aid for identifying testing priorities, areas of risk, and resource allocation within SAP landscapes. Through this session, attendees can expect to enhance their understanding of test management principles while learning practical approaches to optimize testing processes in SAP environments using heatmap visualization techniques
What will you get from this session?
1. Insights into SAP testing best practices
2. Heatmap utilization for testing
3. Optimization of testing processes
4. Demo
Topics covered:
Execution from the test manager
Orchestrator execution result
Defect reporting
SAP heatmap example with demo
Speaker:
Deepak Rai, Automation Practice Lead, Boundaryless Group and UiPath MVP
Transcript: Selling digital books in 2024: Insights from industry leaders - T...BookNet Canada
The publishing industry has been selling digital audiobooks and ebooks for over a decade and has found its groove. What’s changed? What has stayed the same? Where do we go from here? Join a group of leading sales peers from across the industry for a conversation about the lessons learned since the popularization of digital books, best practices, digital book supply chain management, and more.
Link to video recording: https://bnctechforum.ca/sessions/selling-digital-books-in-2024-insights-from-industry-leaders/
Presented by BookNet Canada on May 28, 2024, with support from the Department of Canadian Heritage.
Neuro-symbolic is not enough, we need neuro-*semantic*Frank van Harmelen
Neuro-symbolic (NeSy) AI is on the rise. However, simply machine learning on just any symbolic structure is not sufficient to really harvest the gains of NeSy. These will only be gained when the symbolic structures have an actual semantics. I give an operational definition of semantics as “predictable inference”.
All of this illustrated with link prediction over knowledge graphs, but the argument is general.
UiPath Test Automation using UiPath Test Suite series, part 3DianaGray10
Welcome to UiPath Test Automation using UiPath Test Suite series part 3. In this session, we will cover desktop automation along with UI automation.
Topics covered:
UI automation Introduction,
UI automation Sample
Desktop automation flow
Pradeep Chinnala, Senior Consultant Automation Developer @WonderBotz and UiPath MVP
Deepak Rai, Automation Practice Lead, Boundaryless Group and UiPath MVP
Designing Great Products: The Power of Design and Leadership by Chief Designe...
GIS-Based Web Services Provide Rapid Analysis and Dissemination of Maritime Data
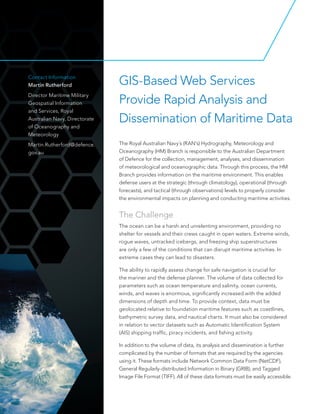
1. GIS-Based Web Services
Provide Rapid Analysis and
Dissemination of Maritime Data
Contact Information
Martin Rutherford
Director Maritime Military
Geospatial Information
and Services, Royal
Australian Navy, Directorate
of Oceanography and
Meteorology
Martin.Rutherford@defence.
gov.au
The Royal Australian Navy´s (RAN’s) Hydrography, Meteorology and
Oceanography (HM) Branch is responsible to the Australian Department
of Defence for the collection, management, analyses, and dissemination
of meteorological and oceanographic data. Through this process, the HM
Branch provides information on the maritime environment. This enables
defense users at the strategic (through climatology), operational (through
forecasts), and tactical (through observations) levels to properly consider
the environmental impacts on planning and conducting maritime activities.
The Challenge
The ocean can be a harsh and unrelenting environment, providing no
shelter for vessels and their crews caught in open waters. Extreme winds,
rogue waves, untracked icebergs, and freezing ship superstructures
are only a few of the conditions that can disrupt maritime activities. In
extreme cases they can lead to disasters.
The ability to rapidly assess change for safe navigation is crucial for
the mariner and the defense planner. The volume of data collected for
parameters such as ocean temperature and salinity, ocean currents,
winds, and waves is enormous, significantly increased with the added
dimensions of depth and time. To provide context, data must be
geolocated relative to foundation maritime features such as coastlines,
bathymetric survey data, and nautical charts. It must also be considered
in relation to vector datasets such as Automatic Identification System
(AIS) shipping traffic, piracy incidents, and fishing activity.
In addition to the volume of data, its analysis and dissemination is further
complicated by the number of formats that are required by the agencies
using it. These formats include Network Common Data Form (NetCDF),
General Regularly-distributed Information in Binary (GRIB), and Tagged
Image File Format (TIFF). All of these data formats must be easily accessible.